
 ?Mathematical formulae have been encoded as MathML and are displayed in this HTML version using MathJax in order to improve their display. Uncheck the box to turn MathJax off. This feature requires Javascript. Click on a formula to zoom.
ABSTRACT
Outdoor space is essential for urban residents’ daily activities, and thermal comfort is an important indicator to evaluate these places. Currently, there are few studies on city outdoor thermal comfort in western China. This paper, by use of weather stations and questionnaires, studies the relationship between outdoor thermal comfort, adaptive thermal comfort, residents’ social characteristics, and the thermal comfort in Xi’an. In the spring, “neutral” is the most commonly perceived thermal sensation (44.19%), followed by slightly uncomfortable (31.4%). Air temperature is the most important meteorological parameter affecting thermal sensation vote, followed by solar radiation. The thermal acceptable range in Xi’an is 2.69~32.10°C, and the neutral temperature is 17.40°C. In terms of social status, young people (age≤20) have the highest heat sensitivity, while the middle-aged (20< age≤40) have the lowest. And women’s heat sensitivity is higher than that of men. By comparing the thermal comfort ranges of Xi’an, Tianjin, and Harbin, it is found that thermal comfort shows regional and climatic differences.
Graphical Abstract
1. Introduction
With over half of the world’s population living in cities, the quality of urban outdoor environment has an impact on the livability and the well-being of residents. Outdoor thermal comfort is an important indicator of urban environment. Residents in the city like to spend time in comfortable outdoor space, such as walking in the park or playing with children on squares. Therefore, as an important evaluation index of urban planning, landscape design, and architectural design, outdoor comfort can be used to determine the urban heat island area so that appropriate mitigation measures can be taken. With the increase of resident activities in comfortable places outdoors, the service efficiency of urban outdoor space and urban vitality can be improved while the indoor air conditioning energy consumption and lighting energy consumption can be reduced. With the deepening of urban microclimate research, scholars have carried out systematic studies of outdoor thermal comfort.
Among the studies of climate region, Chen et al. took Harbin as an example to conduct a long-term questionnaire survey on outdoor adaptive thermal comfort in severe cold regions. They proposed a regression model and a neutral temperature for Harbin’s thermal comfort (Chen, et al. Citation2018). Ruiz investigated the urban outdoor thermal comfort of arid climate and proposed an adaptive thermal comfort model for dry areas (Ruiz and Correa Citation2015). With Tianjin as an example, Lai et al. used microclimatic monitoring and subject interviews to explore the outdoor thermal comfort in cold regions. The study shows that the neutral PET (Physiological Equivalent Temperature) range in Tianjin is 11~24°C (Lai, et al. Citation2014). Lin used Taiwan as an example to study the relationship between shading effect and thermal comfort in the subtropical region. The results reveal that the shadows of trees and buildings in summer can improve outdoor thermal comfort (Lin, Matzarakis, and Hwang Citation2010). Ali-Toudert used Ghardaia as an example to study the outdoor thermal comfort of hot and dry climates. It is found that the orientation of shallow and urban streets can significantly affect outdoor thermal comfort (Ali-Toudert and Mayer Citation2006). Ahmed, with Dhaka as an example, studied the outdoor thermal comfort of wet-tropics and found that the comfortable outdoor thermal environment can significantly improve the indoor thermal comfort level of naturally ventilated buildings (Ahmed Citation2003). Taking Fez, Morocco as an example, Johansson made a comparative study of the outdoor thermal comfort of deep and shallow street canyon. The results suggest that deep street canyon is the preferred urban design in hot and dry climate (Johansson Citation2006). Yang et al. studied urban outdoor thermal comfort in the tropics (Singapore) and found that the neutral operative temperature occurred at 28.7°C and the acceptable operative temperature range was 26.3–31.7°C (Yang, Wong, and Jusuf Citation2013). Zhou studied the outdoor and semi-outdoor thermal environment in a humid subtropical climate and found that neutral SET* was 24.8°C (Zhou, et al. Citation2013). Taking Umeå of north Sweden as an example, Yang made a relevant study between outdoor thermal comfort and human behavior pattern in a subarctic climate. The results suggest that local people are more adapted to subarctic climate than others, and females are more sensitive to air dry-bulb temperature changes. (Yang, et al. Citation2017).
In terms of thermal comfort indicators, Nikolopoulou investigated the relationship between human parameters and outdoor thermal comfort and found that the purely physiological approach cannot fully characterize outdoor thermal comfort. Dynamic human parameter and psychological adaptation are essential for the evaluation of outdoor thermal comfort (Nikolopoulou, Baker, and Steemers Citation2001). Pickup used OUT-SET* index (Outdoor Standard Effective Temperature) to study outdoor thermal comfort. It was found that the OUT-SET* index contains solar and infrared radiation, and the OUT-MRT (Outdoor Mean Radiant Temperature) model can be applied in the research of outdoor thermal comfort (Pickup and de Dear Citation2000). Johansson et al. compared 26 indicators and methods for studying outdoor thermal comfort. They found that the descriptions of subjective judgment and thermal perception are not completely consistent, and the outdoor thermal comfort index research needs to be systemized (Johansson, et al. Citation2014). Pantavou et al. used the UTCI (Universal Thermal Climate Index) to study the outdoor thermal sensation of the Mediterranean climate. The results show that UTCI can well predict heat stress classes (Pantavou, et al. Citation2013). Hwang, Mayer, Johansson, and Lin applied PET (Physiological Equivalent Temperature) index to study outdoor thermal comfort. The research shows that the PET index can reflect the true level of outdoor thermal comfort, and is an important indicator for evaluating outdoor thermal environment (Hwang, Lin, and Matzarakis Citation2011; Mayer, et al. Citation2008; Johansson and Emmanuel Citation2006; Lin and Matzarakis Citation2008).
In terms of the relationship between social factors and outdoor thermal comfort, taking Dhaka as an example, Sharmin made a correlation study between human parameters (gender, age, activity) and outdoor thermal sensation, the results show that forecasting model that takes into account personal conditions is more accurate (Sharmin and Steemers Citation2020). Rupp made a thermal sensitivity of occupants in different building typologies, the results show that age and gender are found to be factors that can influence the thermal sensitivity of building occupants (Rupp et al. Citation2019). Rupp made a review study of thermal comfort, the results show that personal (age, weight, gender, thermal history) variables could affect thermal comfort (Rupp, Vasquez, and Lamberts Citation2015).
Through questionnaires and field tests, the scholars have conducted studies of the outdoor thermal comfort of different climate zones and different parameter indicators, with fruitful achievements. However, there are three limitations to the existing researches: (1) In terms of climate zones, most of them are focused on tropical and subtropical regions. (2) There is not much research on the relationship between social factors and outdoor thermal comfort. (3) Scholars pay less attention to outdoor thermal environment of basin cities (Xi’an) in cold climate regions of western China. In this paper, questionnaire surveys, and field tests at meteorological stations are employed to investigate the outdoor thermal environment in Xi’an. The thermal comfort range and thermal neutral temperature are calculated to explore the quantitative relationship between PET and thermal sensation vote in hope of finding out the quantitative relationship between the social identity factors of residents and thermal comfort. A comparative analysis is also made of thermal comfort in different climate zones.
2. Methods
2.1. The site
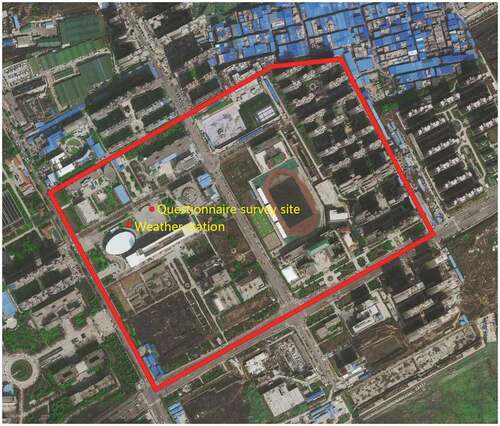
The city of Xi’an (34°18ʹN, 108°56ʹE) is located in the cold area of China, with an annual average temperature of 13.7°C. The calculated outdoor temperature is −3.4°C in winter and 30.6°C in summer (Design code for heating ventilation and air conditioning of civil buildings, GB 50,736–2012). Xi’an has a warm temperate semi-humid continental monsoon climate according to Koppen–Geiger climate classification, with four distinct seasons: cold, warm, dry, and wet. The research area is the Qujiang Campus of Xi’an Jiaotong University, covering an area of 456,000 m2, as shown in . The area has a variety of microclimates, including squares, buildings, small green spaces, roadways, and paths, which can promote interactive physical adaptation (Lai, et al. Citation2014). The area is mainly used by students, teachers, and neighboring residents.
Figure 1. The city of Xi’an
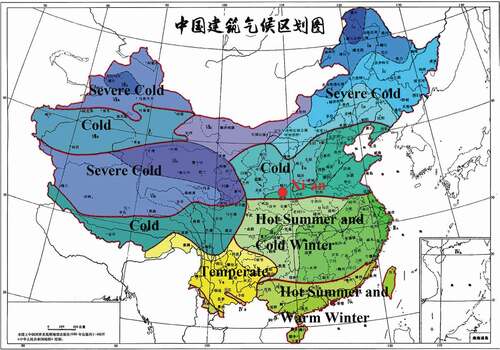
Figure 2. The research area
2.2. Questionnaire survey
2.2.1. Questionnaire design
The questionnaire consists of three parts – interviewee information, outdoor thermal comfort survey, and meteorological data. The interviewee information includes gender, age, height, weight, education, health, level of activity, and clothing. The outdoor thermal comfort survey includes thermal sensation vote (TSV), thermal comfort vote (TCV), and preference vote. The TSV uses a 7-point scale (−3, “cold”; −2, “cool”; −1, “slightly cool”; 0, “neutral”; 1, “slightly warm”; 2, “warm”; 3, “hot”). The TCV uses a 7-point scale (−3, “very uncomfortable”; −2, “uncomfortable”; −1, “slightly uncomfortable”; 0, “neutral”; 1, “slightly comfortable”; 2, “comfortable”; 3, “very comfortable”). The preference vote uses a 3-point scale (“cooler”, “no change”, and “warmer”). shows the questionnaire, in which the air temperature (Ta), relative humidity (RH), wind speed (Va), and solar radiation (G) are measured by the weather station of Xi’an Jiaotong University. The research period is from April to May in 2019, a season of spring.
Table 1. The questionnaire
2.2.2. Research subjects
The survey interviewees are users of the Qujiang campus of Xi’an Jiaotong University, including students, teachers, and neighboring residents. The questionnaire is conducted electronically to facilitate data statistics, and the time is limited to 3 minutes. The questions are mainly in the form of multiple choices so that it is convenient for the interviewees and thus improves the efficiency of the questionnaire. A total of 258 questionnaires are distributed, and the basic information of the interviewees is shown in .
Table 2. Basic information of the interviewees
2.2.3. Meteorological parameters
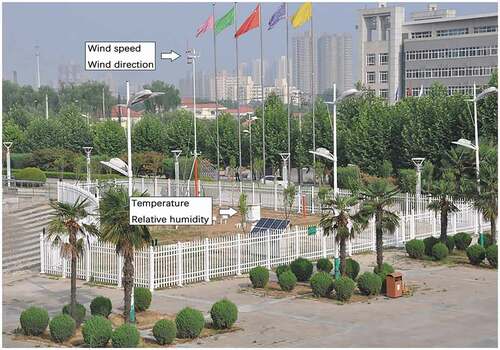
The outdoor meteorological parameters are based on the weather station data of the Geothermal and Environmental Research Laboratory, located on the Qujiang campus (research area) of Xi’an Jiaotong University. The parameters include air temperature (Ta), relative humidity (RH), wind speed (Va), and solar radiation (G), all of which are recorded hourly. The height of air temperature, relative humidity, and solar radiation recorders is about 1.5 m, and the height of wind speed recorder is about 10 m. All the equipments satisfy the requirements of ISO 7726 standards (Standard I. ISO Citation7726Ergonomics of the thermal environment, 1998). provides the basic information of all meteorological test equipments, and shows the actual picture of the weather station.
Table 3. Information on meteorological station sensors
Figure 3. The weather station (Huang et al. Citation2015)
The height of the wind speed recorder is about 10 m, which is corrected to the wind speed at 1.5 m by EquationEquation (1)(1)
(1) in the ASHRAE handbook (ASHRAE Citation1997). Therefore, it can maintain a consistent height with temperature, humidity, and solar radiation recorders, and reflects the meteorological situation at the height of pedestrians.
Va1 – wind speed at 10 m, m/s;
Va2 – wind speed at 1.5 m, m/s;
z1 – 10 m;
z2 – 1.5 m;
α – wind speed correction factor
2.2.4. Physiological equivalent temperature
Physiological equivalent temperature (PET) is a thermal index derived from the Munich Energy Balance Model for Individuals (MEMI). It is defined as the temperature at which the human skin and body temperature reach the thermal state of a typical indoor or outdoor environment (Höppe Citation1984). Under typical indoor environmental conditions, there is no radiation (Ta = Tmrt), Va = 0.1 m/s, the atmospheric pressure is 1200 Pa, the air temperature is 20°C, the relative humidity is 50% [16]. In this paper, PET is calculated by using the Rayman software [1, 16]. Tmrt is an important parameter for calculating PET, and it can be obtained according to EquationEquation (2)(2)
(2) . The calculation process complies with the requirements of ISO 7726 standards (Standard I. ISO Citation7726Ergonomics of the thermal environment, 1998).
where D is globe diameter (0.15 m) and εis emissivity (0.95 for a black globe).
3. Results and discussion
3.1. Microclimatic parameter
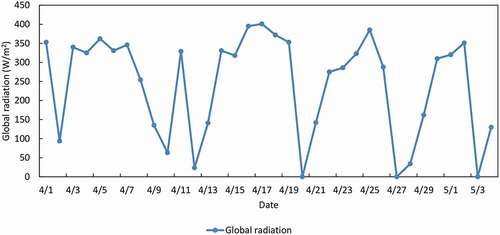
According to the on-site test of meteorological parameters, the research period is spring. shows the distribution of the average temperatures, the highest being 24.3°C on April 18 and the lowest being 10.9°C on April 28. The relative humidity fluctuates from 39.5% to 88.4%, the maximum being 88.4% on April 28 and the minimum being 39.5% on April 5. shows the distribution of average wind speed. The range of wind speed is 0.4 m/s~1.2 m/s, the maximum being 1.2 m/s on April 19 and the minimum beings 0.4 m/s on April 2. is a diagram of solar radiation in Xi’an. It can be seen that its maximum value is 401 W/m2 on April 17, and the average value is 243 W/m2.
Figure 4. Distribution of air temperature and relative humidity
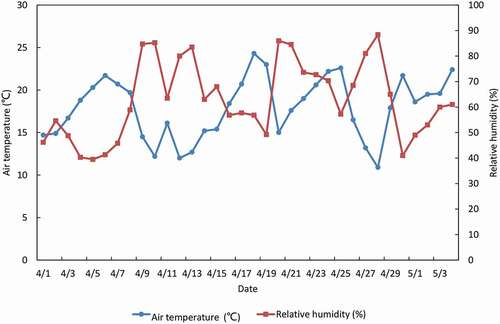
Figure 5. Distribution of wind speed
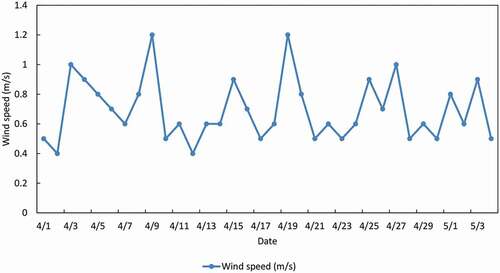
Figure 6. Diagram of global radiation
3.2. Thermal comfort during the survey
3.2.1. Thermal sensation vote (TSV) and thermal comfort vote (TCV)
For outdoor thermal environment research, 258 valid questionnaires are collected. show the TSV and TCV. As can be seen from , most volunteers’ thermal sensation in spring was “neutral” (33.7%), “slightly warm” (22.1%), “warm” (12.4%), and “hot” (19.4%), whose votes were 87.6% in total. And the thermal sensation votes were “slightly cool” (7%), “cool” (4.7%), and “cold” (0.8%). This suggests that the interviewees generally felt warm during the survey period.
Figure 7. TSV
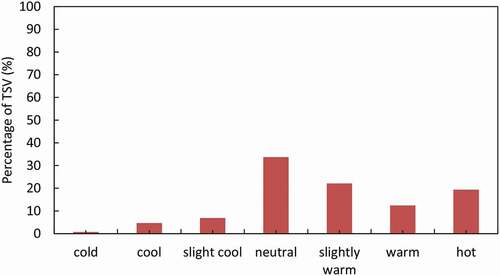
Figure 8. TCV
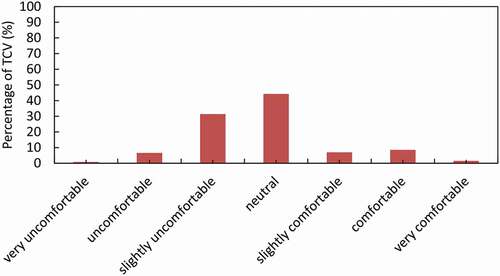
shows the distribution of thermal comfort votes (TCV). In spring, the votes for TCV<0 were 38.8%, while some volunteers felt “very uncomfortable” (0.8%), “uncomfortable” (6.6%), and “slightly uncomfortable” (31.4%). The votes for TCV = 0 is 44.2% and the votes for TCV>0 is 17.1%, while some volunteers felt “very comfortable” (1.6%), “comfortable” (8.5%), and “slightly comfortable” (7%). This suggests that the interviewees overall feel somewhat uncomfortable, which is due to the high temperature.
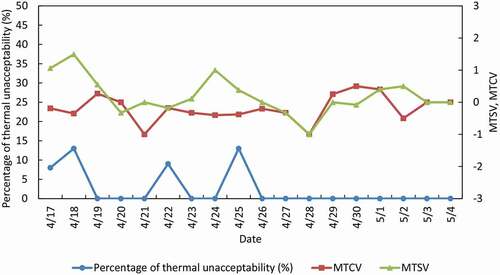
In order to further analyze the outdoor thermal environment in Xi’an, shows the relationship of the percentage of thermal unacceptability votes (TCV≤-2), mean thermal sensation vote (MTSV), and mean thermal comfort vote (MTCV). The percentage of thermal unacceptability votes is 0~13%, and the highest appears on April 18 and April 25. MTCV and thermal unacceptability votes show opposite trends, indicating that thermal comfort indexes can show residents’ acceptance of and satisfaction with urban outdoor environment. The maximum value of MTSV (1.49) appears on April 18, and its corresponding index is “warm”. The minimum value of MTSV (−1) appears on April 28, and its corresponding indicator is “slightly cool”. The maximum value of MTSV caused MTCV to be “slightly uncomfortable”, and the minimum value of MTSV caused MTCV to be “slightly uncomfortable”.
Figure 9. MTSV and MTCV
3.2.2. Thermal acceptable range
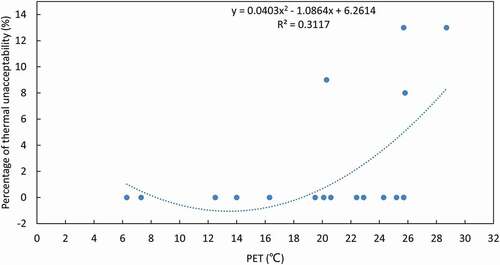
Thermal acceptability is an important index to evaluate outdoor thermal environment in Xi’an. Previous studies have shown that 90% is the dividing line of outdoor thermal environment acceptance (Chen, et al. Citation2018; Cohen, Potchter, and Matzarakis Citation2013). Therefore, this paper defines thermal acceptability as 90% and thermal unacceptability as 10%. gives the percentage of unacceptability corresponding to each 1°C PET and the quadratic polynomial as well as its equation. It is found that the acceptable PET temperature range of spring in Xi’an is 6.3–28.5°C.
Figure 10. Percentage of unacceptability and PET
3.2.3. Neutral PET of spring
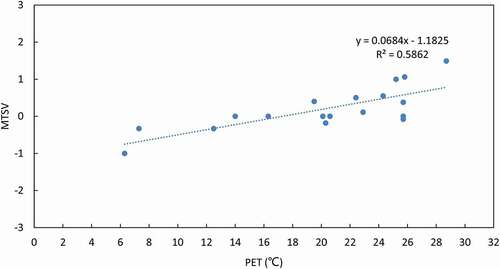
The research team uses SPSS to establish the relationship between MTSV and PET, and tests it with R2 to calculate the neutral PET of spring, as shown in EquationEquation (3)(3)
(3) . is a scatter plot of PET and MTSV in Xi’an in spring. According to the regression equation, the neutral temperature in spring is 17.38°C. Xi’an has a mild climate in spring, and the local residents can adapt to the temperature and humidity. From , the quantitative relationship between MTSV and PET can be seen. The MTSV increases with PET in spring.
Figure 11. Relational graph of MTSV and PET in spring
3.3. TSV and meteorological data
3.3.1. Subjective perception
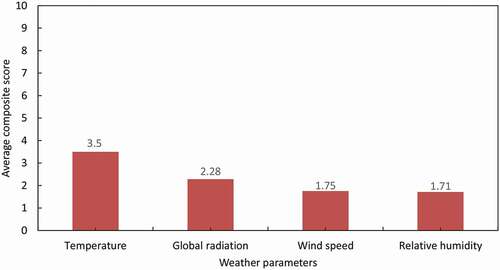
The research team conducted a statistical analysis () of the importance votes of weather parameters (temperature, relative humidity, wind speed, and solar radiation). The evaluation index adopted is the “average composite score”, which is Σ frequency multiplied by weight divided by the number of people answering the question. The higher the score is, the more important the meteorological index will be. The weights are determined by where the indexes are arranged. The calculation rule of this formula is that when there are n options, the weight of the first option is n, and then it decreases in order. For example, when there are four indexes to be sorted, the first one has a weight of 4, the second has a weight of 3, the third has a weight of 2, and the fourth has a weight of 1. The equation is:
Figure 12. Percentage of importance votes in spring
ABCD are meteorological indexes.
As can be seen from the table, the residents consider air temperature to be the most important factor, followed by solar radiation. The scores of wind speed and relative humidity are quite close, being 1.75 and 1.71, respectively. Therefore, in spring, wind speed and humidity have almost the same effect on residents’ feelings, which is due to the quiet wind weather and the year-round dry climate in Xi’an.
3.3.2. Correlation analysis of TSV and meteorological data
To determine the relationship between TSV and meteorological factors, Pearson’s correlation analysis is used to test the correlation between TSV and temperature, relative humidity, wind speed, and solar radiation (). R represents Pearson’s correlation, P represents the Significance (bilateral), and ** means the correlation is significant at the 0.01 level (bilateral). As shown in , TSV is strongly correlated with air temperature and solar radiation, with the correlation coefficients being 0.77 and 0.735, respectively. It is negatively correlated with relative humidity, with a correlation coefficient of −0.542. TSV has little correlation with wind speed, and the correlation coefficient is 0.01.
Table 4. Correlation analysis
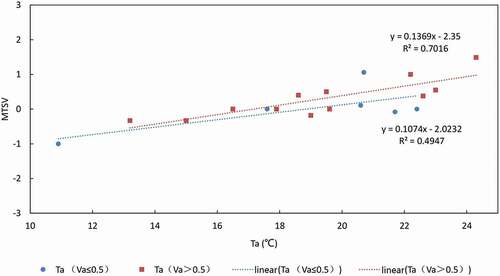
In order to explore its relationship with air temperature and wind speed, MTSV is divided into two categories according to the wind speed (≤0.5 m/s and >0.5 m/s) so that we can find the relationship between air temperature and MTSV (). As can be seen, in both wind speed categories, MTSV and air temperature show a positive linear relationship. When air temperature is the same, the MTSV value corresponding to the Va>0.5 prediction line is higher than that corresponding to the Va≤0.5 m/s prediction line. It indicates that a proper wind speed (0.5~1.2 m/s) in spring makes residents feel a higher air temperature. Xi’an is a basin city with 28% calm wind in summer and 41% calm wind in winter (Design code for heating ventilation and air conditioning of civil buildings, GB 50736-Citation2012). The wind speed in this city is low. When the solar radiation is large in summer, the wind blowing on people is hot, and the wind speed is generally low (≤1.5 m/s). Therefore, when the hot wind is blowing on people, people will feel hotter.
Figure 13. MTSV in different wind conditions
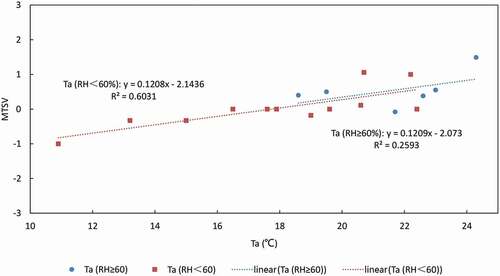
To investigate its relationship with air temperature and relative humidity, MTSV is divided into two categories according to the humidity (RH≥60% and RH < 60%) so that we can find the relationship between air temperature and MTSV (). As can be seen, in both relative humidity categories, MTSV and air temperature show a positive linear relation. When the air temperature is the same, the MTSV value corresponding to the RH≥60% prediction line is higher than corresponding to the Va≤0.5 m/s prediction line. It indicates that a higher relative humidity in spring makes residents feel a higher air temperature. At the same air temperature, the sultriness increases with the relative humidity.
Figure 14. MTSV in different relative humidity conditions
3.4. Residents` social characteristics and microclimatic parameter
3.4.1. Age group and outdoor thermal comfort
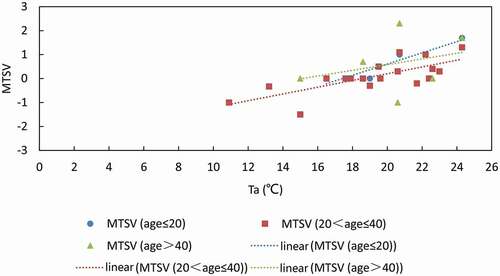
shows the quantitative relationship between the age of interviewees (age≤20, 20 < age ≤ 40, age >40) and MTSV. It can be seen that the MTSV for age≤20 is the highest and the slope of its prediction line is the largest, which indicates that young people have the highest thermal sensitivity. The MTSV for 20 < age ≤ 40 is the lowest, which indicates that the middle-aged have the lowest thermal sensitivity. The MTSV for age >40 is in the middle and its slope is basically consistent with that of the middle-aged, which indicates that its thermal sensitivity is higher than that of the middle-aged. From the length of residence time, it can be concluded that young people live in Xi’an for the shortest time (less than 5 years), and the middle-aged and the elderly live for a longer time (more than 10 years). Therefore, the middle-aged and the elderly have better thermal adaptability and their MTSV is lower than that of young people.
Figure 15. MTSV in different age groups
3.4.2. Gender and outdoor thermal comfort
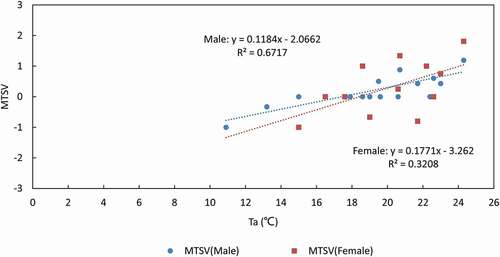
shows the quantitative relationship between gender (male, female) and MTSV. It can be seen that the slope of the female prediction line (0.1771) is higher than that of the male prediction line (0.1184) by 0.0587, which indicates that the temperature sensitivity of female is higher than that of male. According to the distribution status of the test points, the temperature voting range of men is about 10~25°C, and the temperature voting range of women is about 15~25°C, which indicates that men have a better adaptation to cold weather. When the temperature is the same (20°C), the MTSV of men is basically 0 and the MTSV of women is −1~1, which shows that women’s needs for thermal comfort are more personalized.
Figure 16. MTSV in different genders
3.5. Thermal adaptation
3.5.1. Mean clothing insulation and outdoor thermal comfort
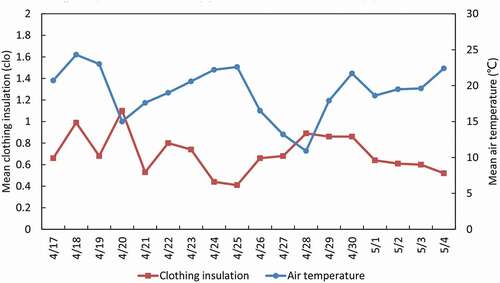
Weather parameters such as air temperature are changing every day, so people will regulate clothing to adapt to the local thermal environment. shows the relationship between the daily average clothing insulation and the average air temperature. As can be seen, they show the opposite changing trends. When the air temperature rises, the clothing insulation decreases, and when the air temperature falls, the clothing insulation increases. This is the behavior regulation of the residents. However, when the temperature is above 20°C, the average clothing insulation remains to be 0.6 clo, which indicates that when the temperature reaches a certain value, the clothing insulation of residents tends to be stable.
Figure 17. Air temperature and clothing insulation
3.5.2. Thermal preference
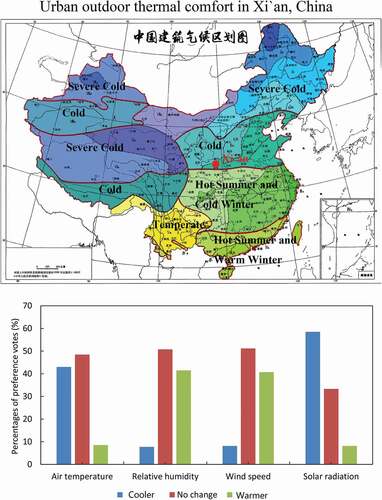
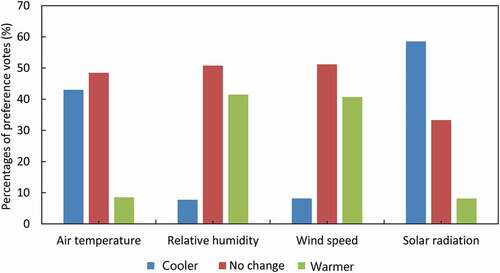
In order to explore the relationship between residents and the thermal environment, we have studied the thermal expectations of residents. shows their thermal expectations for air temperature, relative humidity, wind speed, and solar radiation. It can be seen that 43% of them would like a reduced temperature, and 59% expect the solar radiation to decrease. It indicates that almost half of residents think the temperature is rather high and wish it to drop. Meanwhile, 41% of residents expect the wind speed to increase, and 40.7% want the humidity to increase, which also confirms their desire for a reduced temperature.
Figure 18. Thermal preference
4. Discussion
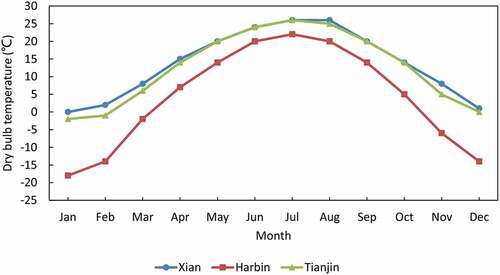
To investigate the outdoor thermal comfort of Xi’an, we conduct a comparative study of Xi’an (34.3°N, 108.93°E), Tianjin (39.08°N, 117.07°E), and Harbin (45.75°N, 126.77°E). The data of outdoor thermal comfort of Tianjin and Harbin are based on the research results of Lai (Lai, et al. Citation2014) and Chen (Chen, et al. Citation2018), respectively. We use Climate Consultant 6.0 to retrieve CSWD data and map the dry bulb temperature of the three cities (). The CSWD data is the Chinese standard weather data developed by Tsinghua University. It comes from the typical annual meteorological data of 270 surface weather stations in China from 1971 to 2003, which is widely used by Energy Plus and other softwares. Xi’an and Tianjin are located in the cold regions of China, while Harbin is in the severe cold region. The latitude difference between Xi’an and Tianjin, and Xi’an and Harbin is 4.78°and 11.45°, respectively. It can be seen from the figure that the annual temperature of Xi’an is similar to that of Tianjin and quite different from that of Harbin. In April, for example, the temperature difference between Xi’an (15°C) and Tianjin (14°C) is 1°C, while the difference between Xi’an and Harbin (7°C) is 8°C. Therefore, the thermal comfort is different between severely cold zone and cold zone of China.
Figure 19. Dry bulb temperature in Xian, Tianjin and Harbin
A comparison is made of the thermal acceptable range of Xi’an and Harbin (). It can be seen that the thermal acceptability range of Xi’an is 16.41°C and 1.01°C higher than that of Tianjin and Harbin. The minimum thermal comfort acceptance temperature of Xi’an is 2.69°C, which is 8.31°C lower than that of Tianjin (11°C) and 0.19°C higher than that of Harbin (2.5°C). The maximum thermal comfort acceptance temperature of Xi’an is 32.1°C, 8.1°C higher than that of Tianjin (24°C) and 1.2°C higher than that of Harbin (30.9°C). The minimum thermal comfort temperature analysis shows that the residents in Harbin have long been in the cold environment and thus have the best cold adaptability, followed by residents in Xi’an and Tianjin. From the maximum thermal comfort acceptance temperature analysis, it can be seen that residents living in Xi’an have better thermal adaptability, followed by residents in Tianjin and Harbin.
Table 5. Thermal acceptable range and neutral PET (PET, °C)
We have compared the neutral PET of Xi’an, Tianjin, and Harbin in different seasons (). It can be seen that the neutral PET (17.40°C) in Xi’an is 1.85°C higher than that of Tianjin (15.55°C) and 3.98°C lower than that of Harbin (21.38°C), which indicates that the thermal acceptability of residents in Xi’an and Tianjin is better than that of residents in Harbin. The neutral PET temperature of Harbin is higher due to its cold weather.
There are three reasons for the survey result: (1) Climate zone factor. Xi’an and Tianjin are both located in the Chinese cold climate area, and Harbin is located in Chinese severely cold climate area. Therefore, the neutral PET of Xi’an and Tianjin are almost similar. There is a significant difference in the neutral PET between Xi’an and Harbin. When I was doing the survey in Harbin, it was very obvious that Harbin was lower than −20°C in winter and the winter is about 6 months, therefore, people cherished and longed for warmer weather. (2) Latitude factor. The latitude of Xi’an is 34.30° N, the latitude of Tianjin is 39.08° N, and the latitude of Harbin is 45.75° N. There are large differences in latitude between Xi’an and Harbin (11.45°); therefore, the neutral PET of Xi’an is 4°C lower than that of Harbin, which has a significant difference. There is less latitude difference between Tianjin and Xi’an (4.78°C), so the neutral PET between Xi’an and Tianjin is only 1.83°C. (3) Sample size factor. The sample size of this survey is 258. In the current outdoor thermal environment questionnaire survey of different spatial forms in Xi’an, we will increase the sample size to 4000, and then we will use the 4000 questionnaires to calculate the neutral PET and compare with the neutral PET calculated in 258 questionnaires.
5. Conclusion
This paper studies the outdoor thermal comfort in the city of Xi’an. The research team conducted a questionnaire survey and field test of weather stations on the Qujiang campus of Xi’an Jiaotong University. By analyzing the data, we can draw the following conclusions:
In the spring, “neutral” is the most commonly perceived thermal sensation (44.19%), followed by slightly uncomfortable (31.4%). Air temperature is the most important meteorological parameter affecting TSV, followed by solar radiation. The thermal acceptable range in Xi’an is 2.69~32.10°C, and the neutral temperature is 17.40°C.
The residents have thermal adaptability, and their thermal resistance of clothing shows an inverse relationship with the air temperature. When the air temperature is higher than 20°C, the average thermal resistance of clothing is 0.6 clo. In terms of the thermal expectations for spring, residents expect the temperature and solar radiation to decrease, and wind speed and relative humidity to increase.
The social factors of residents in Xi’an are related to outdoor thermal comfort. Young people (age≤20) have the highest heat sensitivity, while the middle-aged (20< age≤40) have the lowest. In terms of gender, women’s heat sensitivity is higher than that of men, and their adaptation to cold is lower than that of men.
Outdoor thermal comfort has significant regional characteristics. The thermal acceptable range and Neutral PET in Xi’an, Tianjin, and Harbin are different from each other. The Neutral PET in Xi’an (17.40°C) is 1.85°C higher than that in Tianjin (15.55°C) and 3.98°C lower than that in Harbin (21.38°C). Therefore, residents have the ability to adapt to the thermal environment in different climate zones.
Author contributions
Meng Zhen analyzed the data and wrote the paper. Wei Feng and Wei Ding conducted the questionnaire survey. Dian Zhou offered guidance toward the completion of the paper. Qi Dong and Ping Chen helped analyze the data.
Acknowledgments
The authors are thankful to Dr Xin Chen for her guidance. Thanks are also extended to the Geothermal and Environmental Research Laboratory, Xi’an Jiaotong University for providing the weather data. The paper was supported by the National Natural Science Foundation of China (Grant No. 51808440), Basic natural science research plan of shaanxi province – general project (youth) (Grant No. 2019JQ-595), China Postdoctoral Science Foundation (Grant No. 2019M651289), the Fundamental Research Funds for Central Universities (Grant No. HIT. NSRIF. 2020036), China Postdoctoral Science Foundation (grant number: 2018M633514), Shandong Provincial Natural Science Foundation, China (grant number: ZR2018PEE022), Scientific Research Support of New Teacher of Xi’an Jiaotong University (grant number: JZ1K004).
Disclosure statement
The authors declare no conflict of interest.
Additional information
Funding
References
- Ahmed, K. S. 2003. “Comfort in Urban Spaces: Defining the Boundaries of Outdoor Thermal Comfort for the Tropical Urban environments[J].” Energy and Buildings 35 (1): 103–110. doi:https://doi.org/10.1016/S0378-7788(02)00085-3.
- Ali-Toudert, F., and H. Mayer. 2006. “Numerical Study on the Effects of Aspect Ratio and Orientation of an Urban Street Canyon on Outdoor Thermal Comfort in Hot and Dry climate[J].” Building and Environment 41 (2): 94–108. doi:https://doi.org/10.1016/j.buildenv.2005.01.013.
- ASHRAE. 1997. ASHRAE Handbook (SI), Fundamental, 1997. Atlanta: American Society of Heating, Refrigerating and Air-conditioning Engineers.
- Chen, X., P. Xue, L. Liu, L. Gao, and J. Liu. 2018. “Outdoor Thermal Comfort and Adaptation in Severe Cold Area: A Longitudinal Survey in Harbin, China[J]”. Building and Environment 143: 548–560. doi:https://doi.org/10.1016/j.buildenv.2018.07.041.
- Cohen, P., O. Potchter, and A. Matzarakis. 2013. “Human Thermal Perception of Coastal Mediterranean Outdoor Urban environments[J].” Applied Geography 37: 1–10. doi:https://doi.org/10.1016/j.apgeog.2012.11.001.
- “Design Code for Heating Ventilation and Air Conditioning of Civil buildings[S].” GB 50736-2012.
- Höppe, P. 1984. Die Energiebilanz des Menschen[D]. München: University of München.
- Huang, S., B. Xiao, R. Fu, and L. He. 2015. “Three Years of Tracking Temperature Variations from Rooftop down to a Deep Hole.” AGU Fall Meeting, December 14–18, San Francisco, USA.
- Hwang, R. L., T. P. Lin, and A. Matzarakis. 2011. “Seasonal Effects of Urban Street Shading on Long-term Outdoor Thermal comfort[J].” Building and Environment 46 (4): 863–870. doi:https://doi.org/10.1016/j.buildenv.2010.10.017.
- Johansson, E. 2006. “Influence of Urban Geometry on Outdoor Thermal Comfort in a Hot Dry Climate: A Study in Fez, Morocco[J].” Building and Environment 41 (10): 1326–1338. doi:https://doi.org/10.1016/j.buildenv.2005.05.022.
- Johansson, E., and R. Emmanuel. 2006. “The Influence of Urban Design on Outdoor Thermal Comfort in the Hot, Humid City of Colombo, Sri Lanka[J].” International Journal of Biometeorology 51 (2): 119–133. doi:https://doi.org/10.1007/s00484-006-0047-6.
- Johansson, E., S. Thorsson, R. Emmanuel, and E. L. Kruger. 2014. “Instruments and Methods in Outdoor Thermal Comfort studies – The Need for standardization[J]”. Urban Climate 10: 346–366. doi:https://doi.org/10.1016/j.uclim.2013.12.002.
- Lai, D., D. Guo, Y. Hou, C. Lin, and Q. Chen. 2014. “Studies of Outdoor Thermal Comfort in Northern China[J]”. Building and Environment 77: 110–118. doi:https://doi.org/10.1016/j.buildenv.2014.03.026.
- Lin, T. P., and A. Matzarakis. 2008. “Tourism Climate and Thermal Comfort in Sun Moon Lake, Taiwan[J].” International Journal of Biometeorology 52 (4): 281–290. doi:https://doi.org/10.1007/s00484-007-0122-7.
- Lin, T. P., A. Matzarakis, and R. L. Hwang. 2010. “Shading Effect on Long-term Outdoor Thermal comfort[J].” Building and Environment 45 (1): 213–221. doi:https://doi.org/10.1016/j.buildenv.2009.06.002.
- Mayer, H., J. Holst, P. Dostal, F. Imbery, and D. Schindler. 2008. “Human Thermal Comfort in Summer within an Urban Street Canyon in Central Europe[J].” Meteorologische Zeitschrift 17 (3): 241–250. doi:https://doi.org/10.1127/0941-2948/2008/0285.
- Nikolopoulou, M., N. Baker, and K. Steemers. 2001. “Thermal Comfort in Outdoor Urban Spaces: Understanding the Human parameter[J].” Solar Energy 70 (3): 227–235. doi:https://doi.org/10.1016/S0038-092X(00)00093-1.
- Pantavou, K., G. Theoharatos, M. Santamouris, and D N Asimakopoulos. 2013. “Outdoor Thermal Sensation of Pedestrians in a Mediterranean Climate and a Comparison with UTCI[J]”. Building and Environment 66: 82–95. doi:https://doi.org/10.1016/j.buildenv.2013.02.014.
- Pickup, J., and R. de Dear. 2000. “An Outdoor Thermal Comfort Index (Out_set*)–part I–the Model and Its assumptions[C]//Biometeorology and Urban Climatology at the Turn of the Millenium.” Selected Papers from the Conference ICB-ICUC 99: 279–283.
- Ruiz, M. A., and E. N. Correa. 2015. “Adaptive Model for Outdoor Thermal Comfort Assessment in an Oasis City of Arid climate[J].” Building and Environment 85: 40–51. doi:https://doi.org/10.1016/j.buildenv.2014.11.018.
- Rupp, R. F., J. Kim, E. Ghisi, and R. de Dear. 2019. “Thermal Sensitivity of Occupants in Different Building Typologies: The Griffiths Constant Is a Variable[J].” Energy and Buildings 200: 11–20. doi:https://doi.org/10.1016/j.enbuild.2019.07.048.
- Rupp, R. F., N. Vasquez, and R. Lamberts. 2015. “A Review of Human Thermal Comfort in the Built environment[J].” Energy and Buildings 105: 178–205. doi:https://doi.org/10.1016/j.enbuild.2015.07.047.
- Sharmin, T., and K. Steemers. 2020. “Effects of Microclimate and Human Parameters on Outdoor Thermal Sensation in the High-density Tropical Context of Dhaka[J].” International Journal of Biometeorology 64 (2): 187–203. doi:https://doi.org/10.1007/s00484-018-1607-2.
- Standard, I. 1998. ISO 7726 Ergonomics of the Thermal environment—Instruments for Measuring Physical quantities[J]. Geneva, Switzerland: International Organization for Standardization.
- Yang, B., T. Olofsson, G. Nair, and A. Kabanshi. 2017. “Outdoor Thermal Comfort under Subarctic Climate of North Sweden–A Pilot Study in Umeå[J]”. Sustainable Cities and Society 28: 387–397. doi:https://doi.org/10.1016/j.scs.2016.10.011.
- Yang, W., N. H. Wong, and S. K. Jusuf. 2013. “Thermal Comfort in Outdoor Urban Spaces in Singapore[J].” Building and Environment 59: 426–435. doi:https://doi.org/10.1016/j.buildenv.2012.09.008.
- Zhou, Z., H. Chen, Q. Deng, and A. Mochida. 2013. “A Field Study of Thermal Comfort in Outdoor and Semi-outdoor Environments in a Humid Subtropical Climate city[J].” Journal of Asian Architecture and Building Engineering 12 (1): 73–79. doi:https://doi.org/10.3130/jaabe.12.73.