
ABSTRACT
In the context of China’s fast urbanization, the background of urban landmarks is constantly changing, which provides useful examples for the study of visual preference evaluation of urban landmarks. With the Shanghai Oriental Pearl Radio & TV Tower as research object, the pictures of 24 years were used as the research material, and the height ratio, building density, distance, and volume of the surrounding buildings were set as the physical characteristics to be studied. Photo stimulation experiments were conducted with participants of different demographic characteristics, the results of which were analyzed accordingly. The analytical results indicate that the height ratio, building density, distance, volume of Oriental Pearl Radio & TV Tower’s surrounding buildings are the main factors that influence people’s visual preference evaluation; people of different demographic characteristics (gender, age, growth experience) pay different attention to the height ratio, building density, distance, volume, and render different emotional and aesthetic responses to the fast change of this urban landmark and its surroundings. This research provides a valuable reference to urban landmark design and the development strategy of urban planning.
1. Introduction
1.1. Research background
Urban landmarks are not merely a regional visual focus which helps people recognize and judge the surroundings, but also an important carrier of urban space history, culture, aesthetics and emotional attachment. Meanwhile, they are also a key component of urban spatial form. The urban landmarks of a city are to a large degree the embodiment of public impression on the city.
The Oriental Pearl Radio & TV Tower (OPT, hereinafter referred to as “the Tower”) is one of the important urban landmarks of Shanghai. As one of the most representative buildings of Shanghai urban modernization, it is indeed the symbol of modern Shanghai to many Chinese people since its completion (Citation1995).
Urban landmarks are remarkably influential to urban spatial form. Karimimimoshaver and Winkemann (Citation2018) claimed that the influence of high-rise buildings on urban skyline can be assessed from the following three dimensions: aesthetic dimension, visibility dimension, and meaning dimension. Yusoff, Noor, and Ghazali (Citation2014) maintained that skyscrapers, as important components of the skyline of Kuala Lumpur, capital of Malaysia, mainly influenced people’s first impression on the city.
Visual preference evaluation of urban landmarks is another important aspect of urban building evaluation. Samavatekbatan, Gholami, and Karimimoshaver (Citation2016) studied the aesthetic issues of urban high-rise buildings with computer software. Their study revealed that height was the most influential factor for the visual aesthetic evaluation of high-rise buildings. Browne (Citation2006) observed that aesthetic value was one of the key functions of landmark buildings.
The change of the surroundings around a particular building influences visual preference evaluation as well. Zarghamia et al. (Citation2019) studied the tension created by the height, width, and height–width ratio of high-rise buildings and exerted upon the observers at different distances. Yabuki, Miyashita, and Fukuda (Citation2011) studied the integration of buildings of different heights and surrounding landscapes by using the AR method. Collins, Sitte, and Collins (Citation2006) maintained that the height of surrounding buildings around the square would influence viewers’ feeling. Lin, Homma, and Iki (Citation2018) discovered that building height and vegetation types around the lake exerted some impact on people’s visual preference evaluation upon the lake.
The main standard to evaluate the characteristics of visual environment is visual aesthetics which refers to the degree people’s aesthetic experiences of visual landscapes can reach. To be specific, visual aesthetics is closely related not only with some objective factors such as landscapes and buildings but also with the demographic characteristics of the evaluators (Wang and Zhao Citation2017). According to the previous researches, cultural background (Yu Citation1995), education background (Molnarova et al. Citation2012), gender (Lindemann-Matthies et al. Citation2010; Strumse Citation1996), age (Van den Berg and Koole Citation2006), professional knowledge (Strumse Citation1996; Vouligny, Domon, and Ruiz Citation2009), familiarity with the environment (Howley, Donoghue, and Hynes Citation2012), and living environment (Yu Citation1995; Zube, Pitt, and Evans Citation1983) are all influential to people’s visual preference evaluation.
In terms of research methods, most studies on visual preference evaluation in the field of architecture and related fields were based on subject feeling (Arriaza et al. Citation2004; Kaltenborn and Bjerke Citation2002; Kaplan and Kaplan Citation1989; Uuemaa et al. Citation2009). By contrast, only quite few studies adopted objective research method (Tveit Citation2009).
Some evaluation methods which combine subjective feelings and objective data have already been used to evaluate visual preference on buildings as well as in other relevant fields. Stamps Iii (Citation1990) observed that there existed a highly positive correlation between the information people obtain from static colored photos and that from actual views. Iverson (Citation1985) put forward the concept “visual quality” and described visual effect from a quantitative viewpoint. Magill (Citation1992) and Geneletti (Citation2008) attempted to define visual preference with a series of indexes and landscapes. Other researchers explored how the change of landscapes’ physical characteristics influenced landscape aesthetics and tried to establish a correlation between physical characteristics and landscape aesthetics (Buhyoff et al. Citation1994; Real, Arce, and Sabucedo Citation2000).
1.2. Research questions
In the context of China’s urban fast development for nearly 30 years, the surroundings of many urban landmarks have been changing constantly (Z. Wang Citation2018). This research tried to explore people’s visual preference on urban landmarks as well as their surroundings during different periods through photo incentive method. The Tower and its surroundings in different periods were shown through a series of pictures to the participants. Through photo incentive, aesthetic evaluation, picture analysis, and statistical analysis, the visual preference laws of urban landmarks and the corresponding surroundings were thence obtained.
This research collected participants’ visual preference data of these pictures (of different periods) and demographic characteristics through questionnaire survey. By analyzing the data collected the following two questions were to be investigated: Is there any difference between different groups in their visual preference for urban landmarks in the context of fast-changing surroundings around urban landmarks? Is there any difference between people of different demographic characteristics in their preference on the physical characteristics of urban landmarks as well as the surrounding buildings?
2. Research methods
2.1. Research materials
The research materials of this research are mainly a series of pictures of the Tower and its surrounding building groups. The original photo was taken in Chen Yi Square, where a full view of Lujiazui financial district complex centered around the Tower across Huangpu River can be clearly obtained. Meanwhile, Chen Yi Square is also one of the most important scenic spots for all the tourists to Shanghai. Therefore, the location of photo shooting for this research is highly representative.
Figure 1. The location and the viewpoint
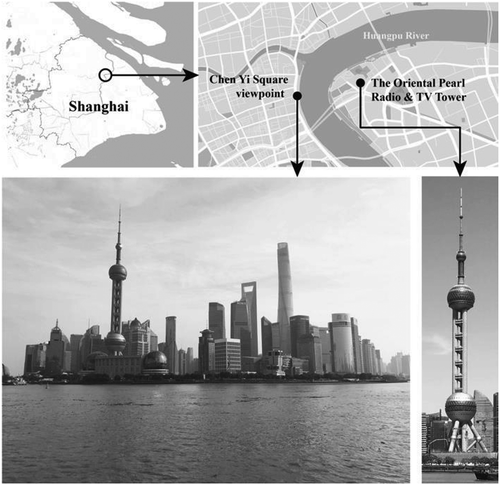
The photo was shot at the chosen location as introduced above. According to “Report on nutrition and chronic diseases of Chinese residents” released by the State Council in 2015, the average height of Shanghai residents (both male and female) is 168 cm. Accordingly, on November 22th, 2018, the photo was taken with iPhone 7 Plus at the height of 165 cm above the ground (as shown in ).
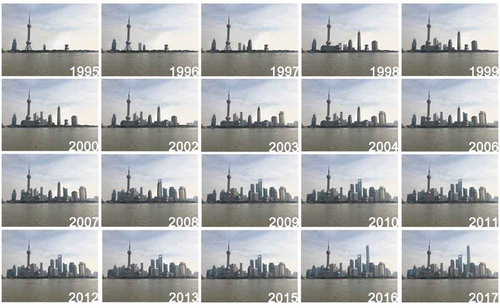
The above-mentioned photo was put into computer for processing. To be specific, the surrounding buildings around the Tower were removed one by one according to their respective completion time with Photoshop CS5. Similar methods are also widely used in studies of visual preference evaluation (Larsen and Harlan Citation2006; Tsoutsos et al. Citation2009; White and Gatersleben Citation2011; Samavatekbatan, Gholami, and Karimimoshaver Citation2016; Lin, Homma, and Iki Citation2018). In total, 23 pictures were produced. These pictures reconstructed the state of the Tower and its surrounding buildings from its completion in 1995 to November 2018 year by year. Four pictures (the pictures of 2001, 2005, 2014 and 2018) were deleted later in that no change occurred compared with the previous year. Therefore, with one of the first photos taken, there are 20 pictures shown in .
Figure 2. The pictures of different years
2.2. Physical characteristics of the pictures
In this research, the physical characteristics of the pictures of the Tower and its surrounding building group were divided into four types: height ratio (a), building density (d), distance between the Tower and its surrounding high-rise buildings (l), and volume of the surrounding buildings (v).
2.3. Calculation of the physical characteristics
The 20 pictures were put in AutoCAD2014 for grid analysis. Firstly, the height of the Tower was set as H. Then, the top three tall buildings around the Tower were marked out and the height ratio of the three buildings and the Tower could be calculated by the following formula: a = h/H. Secondly, the number of cells between the top three tallest buildings and the Tower was counted, so that the distance between and the mean value (l) could be calculated. Thirdly, the number of cells that the buildings occupy (c1) and that of the sky (c2) was counted, respectively. So the building density could be calculated by the following formula: d = c1/c2. Finally, the number of cells that every building takes up was counted, so the volume of the top three largest buildings in the pictures and the mean value (v) were calculated. In the case that a cell is not fully stuffed, it should be counted as 0.5 cell. The grid analysis and physical characteristics’ extraction are shown in . The calculation results of the 20 pictures are shown in .
Figure 3. The diagram of the grid analysis and physical characteristics’ extraction
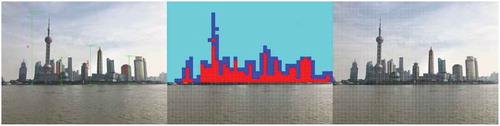
Table 1. The physical characteristics of the surrounding buildings around the Tower
2.4. Survey of participants’ preference
After being processed with computer software, the 20 pictures were shown to the participants of this research. For the convenience of the participants to score the pictures, the pictures were printed on five pieces of full-color photo paper (A4 size, four pictures on each piece) and then bound in a volume in random order so that the participants would not know the year that each picture represented. Then, these pictures were shown to random Chinese participants in Chen Yi Square of Shanghai (the location of photo shooting).
To begin with, participants need to complete their demographic characteristics according to the questions on the questionnaire. The demographic characteristics involved in this research included gender, age, educational background, and rural growth experience. Then, participants were asked to score each of the 20 pictures of the Tower (ranging from 0 to 5; 0 denoting the least preference and 5 denoting the most preference). They could revise their scores at their own will before the questionnaire was finished. The first survey was conducted on 29 November 2018 which included 160 participants altogether. To ensure the reliability of survey data, a second survey was conducted on 20 December 2018, with 170 participants in total. All the scores given by the participants were recorded and compared. The result indicated that the average preference scores of the two surveys were close to each other (single-factor analysis of variance F = 0.458, p = 0.230). Accordingly, the two rounds of questionnaire survey could be further analyzed as a whole. The scores corresponding to the variables of each demographic characteristic are shown in . Of the 330 questionnaires, 278 were valid and the rate of validity was 84.2%. The demographic characteristics of the participants, which were in line with the statistical results of Shanghai Statistical Yearbook (Citation2018), are shown in .
Table 2. Demographic characteristics of participants
Table 3. Analysis of participants’ gender and pictures’ physical characteristics
Table 4. Analysis of participants’ age and pictures’ physical characteristics
Table 5. Analysis of participants’ growth experience and pictures’ physical characteristics
Then, the data collected were analyzed with SPSS 22.0. Through correlation analysis, the influence of different demographic characteristics on people’s visual preference evaluation was studied. On this basis, the data were further analyzed with multiple linear regression models. These analytical methods are also widely used in similar studies (Wang and Zhao Citation2017; Zhao, Zhang, and Cai Citation2020).
3. Results
3.1. Overall evaluation of the pictures
At first, the intergroup reliability of preference scores obtained was examined. The SPSS calculation results showed that the reliability was 0.782, indicating a high internal reliability. It also demonstrated that the questionnaire survey was highly reliable and the data obtained could be analyzed.
The average score of each picture (s) was calculated, with the maximum score being 4.23 and the minimum being 2.22. The average preference score of all the pictures was 3.41. The highest average score was given to the picture of 2007 while the lowest went to the picture of 1998.
3.2. Demographic characteristics and visual preference evaluation
Single-factor analysis of variance was conducted to study the relationship between demographic characteristics and visual preference evaluation. The results indicate that gender difference (F = 11.204, p = 0.02), age difference (F = 2.692, p = 0.01), experience in rural areas (F = 6.230, p = 0.03) all contribute to participants’ scoring process, which finally leads to the difference in the average scores of each picture. However, participants with education difference (F = 2.021, p = 0.64) does not show any difference in their average scores of each picture.
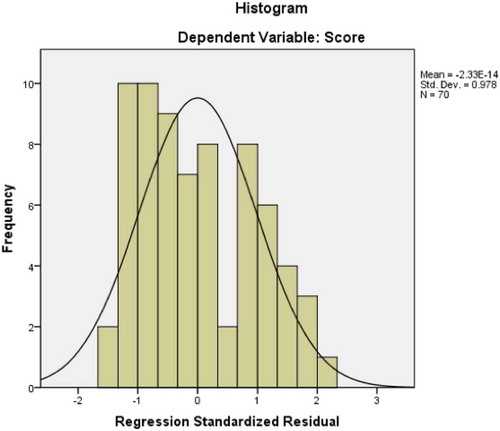
In addition, whether demographic characteristics interact with each other (collinearity) was also studied. Based on the results of multiple linear regression analysis, collinear analysis was conducted to independent variables. As is shown in , the standardized residual of the models follows a normal distribution pattern. Meanwhile, for meaningful independent variables (age, gender, and experience), their tolerance and VIF value are as follows: age tolerance 0.97, VIF = 1.031; gender tolerance 0.453, VIF = 2.206; experience tolerance 0.451, VIF = 2.218. Arriaza et al. (Citation2004), John (Citation2008), Menard (Citation2002) claimed that when VIF was over 10 or tolerance smaller than 0.2, collinearity existed in the model. In this research, all the VIF of independent variables are smaller than 10 and all tolerances are over 0.2; the residual is distributed in a normal pattern. Therefore, it can be concluded that there is no collinearity in the model (as shown in ).
Figure 4. Collinearity judgment
3.3. Participants’ gender and pictures’ physical characteristics
Participants of different genders were asked to score each picture, respectively. The average score of each picture is set as a dependent variable and the physical characteristics of the 20 pictures as independent variables. The stepwise multiple linear regression models indicate that significant predictors for males and females are different. For male participants, height ratio (a) is the reliable predictor of visual preference evaluation; for female participants, height ratio (a) and building density (d) are reliable predictors of visual preference evaluation (as shown in ).
3.4. Participants’ age and pictures’ physical characteristics
Participants of different age groups were asked to score each picture, respectively. The average score of each picture is set as a dependent variable and the physical characteristics of the 20 pictures as independent variables. The stepwise multiple linear regression models indicate that significant predictors for different age groups are different. For participants under 17 and between 18 and 35 years old, distance (l) is the reliable predictor of visual preference evaluation; for participants between 36 and 59 years old, height ratio (a) is the reliable predictor of visual preference evaluation; for those over 60 years old, height ratio (a) and building density (d) are reliable predictors of visual preference evaluation (as shown in ).
3.5. Participants’ growth experience and pictures’ physical characteristics
Participants with and without any experiences in rural areas were asked to score each picture, respectively. The average score of each picture is set as a dependent variable and the physical characteristics of the 20 pictures as independent variables. The stepwise multiple linear regression models indicate that significant predictors for participants with different growth experiences are different. For participants with rural growth experiences, height ratio (a) and building density (d) are reliable predictors of visual preference evaluation; for those without rural growth experiences, distance (l) is the sole reliable predictor (as shown in ).
4. Discussions
Howley, Donoghue, and Hynes (Citation2012) maintained that people of different ages had different visual preference evaluations. A similar conclusion can be drawn from this research. There exists a positive correlation between age and visual preference scores. To be specific, the older the participants are, the higher scores they would give to the Tower and its surrounding buildings (as shown in ). This may be justified by the fact that the older groups witnessed the standstill and backwardness of China’s cityscape before the reform and opening-up, and they also experienced the fast development of urbanization in China. Their life experience let them more accustomed to the fast change of China’s cityscape and more readily contented with China’s urbanization process. Noticeably, the average score of visual preference given by the younger group is significantly lower than those given by the middle-aged and old groups. However, Zube, Pitt, and Evans (Citation1983) argued that age was negatively correlated with visual preference evaluation of waterbody. Riechers, Barkmann, and Tscharntke (Citation2018) claimed that age was negatively correlated with the attitude to urbanization. They observed that the older groups preferred living in rural areas. These researches drew contrary conclusions from this research.
Yu (Citation1995) put forward that people with different educational backgrounds showed different visual preferences for landscapes. R. Wang and Zhao (Citation2017) claimed that people with higher education preferred well-vegetated landscapes. However, this research discovered that educational background did not influence people’s visual preference evaluation. One reasonable explanation for this is that Chinese participants have already been accustomed to the fast urbanization of China. Therefore, educational background fails to function when the participants evaluate the urban landmarks and the surrounding building groups.
Abello and Bernáldez (Citation1986) observed that gender difference would lead to the variation of visual preference evaluation. As is discovered in this research, females’ score averagely higher than males do (as shown in ). This may be justified by the fact that the subjects of these pictures are urban landmarks and surrounding building groups. Generally speaking, females may prefer bustling cities. As China’s urbanization advances, it is natural that females should render a higher evaluation on urban landmarks and surrounding building groups than males do. However, this conclusion is opposite to that of Yao et al. (Citation2012).
Keane (Citation1990) held that life experience did not influence people’s visual aesthetic evaluation of landscape. However, as is revealed in this research, people with life experience in rural areas are generally more appreciative of the Tower and its surrounding building groups. This is mainly because of the relatively large urban-rural gap in China. In most rural areas in China, high-rise buildings are quite rare. In this case, people living there or who once lived there would find dense high-rise buildings a more enjoyable sight. In contrast, participants who grow up in cities and have no growth experience in rural areas display a much weaker preference to dense high-rise buildings.
Groups of different gender usually render different visual preference to urban landmarks and surrounding buildings. It can be seen in this research that male groups would primarily give their priority to the building height in the pictures when they evaluate the Tower and its surrounding building groups; as the height increases, the score they give rises accordingly. The reason for this may lie in that the male groups may be more interested in scientific and technological capabilities in terms of building height. On the other hand, female groups are more concerned about height and density when they evaluate the Tower and its surrounding buildings. Besides, height and density are basically positively correlated with the average score of pictures. This can be justified by the fact that the height and density of high-rise buildings in some sense mirror the prosperity of a city, and for Chinese female groups, the prosperity in the city also indicates the safety and prosperity of life.
Groups of different ages also display different visual preference to urban landmarks and surrounding buildings. For the two groups of 0–17 and 18–35 years old, when they evaluate the Tower and its surrounding building groups, their main concern is the distance between the two. For the group of 36–59 years old, their main concern goes to height when evaluating the Tower and surrounding buildings. People of over 60 years old are more concerned about height and density. Similar to the group of 36–59 years old, they are generally contented with the current situation of Chinese cities. From the above analysis, it can be seen that the young generation is more rational than the middle-aged and old groups. They are more integrated into information era and more open-minded to other big cities in the world in that they are comparatively better educated; meanwhile, they have no direct personal experience of the standstill and backward cityscape in the past, thus failing to develop a full view of China’s fast urbanization. Consequently, they do not show strong preference to the current cityscape, the fruit of China’s fast urbanization. Contrarily, the middle-aged and old groups attach more importance to urban development and prosperity.
Groups with or without growth experience in rural areas display different visual preference evaluations of urban landmarks and surrounding building groups. For people with growth experience in rural areas, their concern is mainly directed to building height and density when they evaluate the Tower and its surrounding buildings. To be specific, the denser and the higher the buildings are, the higher the average scores of pictures would be. Compared with those who grow up in cities, especially big cities, they have relatively scarce opportunity to see high-rise buildings before. When they are exposed to these high-rise buildings around the Tower, it is natural that they display more surprise and enjoyment. However, people without any living experience in rural areas are more concerned about the distance between the surrounding high-rise buildings and the Tower because they are already quite familiar with the high-rise buildings. In this case, they can analyze the coordination between the Tower and its surrounding buildings in the pictures more rationally. This coordination is highly relevant to the distance, which justifies their main concern clearly.
In addition, as has been found in this research, groups of different demographic characteristics show no concern about the volume of the Tower and surrounding buildings (v).
5. Conclusion
A building or an overall planning cannot win the public support unless it meets the needs of most groups (Gobster et al. Citation2007). For urban architects, one of their fundamental tasks is to acquaint the needs of urban residents and then design accordingly. To meet the need of the urban population is crucial for the success of a project. This research is of help for architects to understand how different groups of urban residents evaluate China’s fast urbanization and know the main concern of different groups of people when they conduct visual preference evaluation over urban landmarks and surrounding buildings. To be specific, from this research, the architects can know which physical characteristics (or features) attract the main concern of certain groups. The experiment conducted and analytical results obtained can provide valuable reference and instructions to architects and planners and indicate the changing trend of visual preference evaluation over urban landmarks and surrounding building groups in the future.
Acknowledgments
We want to express our heartfelt thanks to the dozens of questionnaire survey working staff and hundreds of anonymous participants.
Disclosure statement
No potential conflict of interest was reported by the authors.
Additional information
Funding
Notes on contributors
Mengmeng Zhao
Mengmeng Zhao is a Ph.D. Candidate at School of Design, Shanghai Jiao Tong University. Her research interests are Architectural Design and Theory.
Jian Zhang
Jian Zhang is a Tenure Track Professor/ Researcher (Double hired) at Shanghai Jiao Tong University and China Institute for Urban Governance. He is a Ph.D., graduated from the Nagoya Institute of Technology. His research interests are Architectural Design and Theory.
Jun Cai
Jun Cai is a Professor at School of Design, Shanghai Jiao Tong University. She is a Ph.D., graduated from the Nagoya Institute of Technology. Her research interests are Architectural History and Theory.
References
- Abello, R. P., and F. G. Bernáldez. 1986. “Landscape Preference and Personality.” Landscape and Urban Planning 13: 19–28. doi:https://doi.org/10.1016/0169-2046(86)90004-6.
- Arriaza, M., J. F. Cañas-Ortega, J. A. Cañas-Madueño, and P. Ruiz-Aviles. 2004. “Assessing the Visual Quality of Rural Landscapes.” Landscape and Urban Planning 69 (1): 115–125. doi:https://doi.org/10.1016/j.landurbplan.2003.10.029.
- Browne, L. A. 2006. “Regenerate: Reusing a Landmark Building to Economically Bolster Urban Revitalization.” Doctoral dissertation, University of Cincinnati.
- Buhyoff, G. J., P. A. Miller, J. W. Roach, D. Zhou, and L. G. Fuller. 1994. “An AI Methodology for Landscape Visual Assessments.” AI Applications 8(1): 1–13.doi:10.1016/0167-8655(94)90050-7
- Collins, G. R., C. Sitte, and C. C. Collins. 2006. Camillo Sitte: The Birth of Modern City Planning. New York: Dover Publications.
- Geneletti, D. 2008. “Impact Assessment of Proposed Ski Areas: A GIS Approach Integrating Biological, Physical and Landscape Indicators.” Environmental Impact Assessment Review 28 (2–3): 116–130. doi:https://doi.org/10.1016/j.eiar.2007.05.011.
- Gobster, P. H., J. I. Nassauer, T. C. Daniel, and G. Fry. 2007. “The Shared Landscape: What Does Aesthetics Have to Do with Ecology?” Landscape Ecology 22 (7): 959–972. doi:https://doi.org/10.1007/s10980-007-9110-x.
- Howley, P., C. O. Donoghue, and S. Hynes. 2012. “Exploring Public Preferences for Traditional Farming Landscapes.” Landscape and Urban Planning 104 (1): 66–74. doi:https://doi.org/10.1016/j.landurbplan.2011.09.006.
- Iverson, W. D. 1985. “And That’s about the Size of It: Visual Magnitude as a Measurement of the Physical Landscape.” Landscape Journal 4 (1): 14–22. doi:https://doi.org/10.3368/lj.4.1.14.
- John, R. S. 2008. “Linear Statistical Models: An Applied Approach.” Technometrics 29 (2): 237–238. doi:https://doi.org/10.2307/1269779.
- Kaltenborn, B. P., and T. Bjerke. 2002. “Associations between Environmental Value Orientations and Landscape Preferences.” Landscape and Urban Planning 59 (1): 1–11. doi:https://doi.org/10.1016/S0169-2046(01)00243-2.
- Kaplan, R., and S. Kaplan. 1989. The Experience of Nature: A Psychological Perspective. Cambridge: Cambridge University Press.
- Karimimimoshaver, M., and P. Winkemann. 2018. “A Framework for Assessing Tall Buildings’ Impact on the City Skyline: Aesthetic, Visibility, and Meaning Dimensions.” Environmental Impact Assessment Review 73: 164–176. doi:https://doi.org/10.1016/j.eiar.2018.08.007.
- Keane, T. D. 1990. “The Role of Familiarity in Landscape Aesthetics: A Study of Tallgrass Prairie Landscapes.” Doctoral dissertation.
- Larsen, L., and S. L. Harlan. 2006. “Desert Dreamscapes: Residential Landscape Preference and Behavior.” Landscape and Urban Planning 78 (1): 85–100. doi:https://doi.org/10.1016/j.landurbplan.2005.06.002.
- Lin, L., R. Homma, and K. Iki. 2018. “Preferences for a Lake Landscape: Effects of Building Height and Lake Width.” Environmental Impact Assessment Review 70: 22–33. doi:https://doi.org/10.1016/j.eiar.2018.03.001.
- Lindemann-Matthies, P., R. Briegel, B. Schüpbach, and X. Junge. 2010. “Aesthetic Preference for a Swiss Alpine Landscape: The Impact of Different Agricultural Land-use with Different Biodiversity.” Landscape and Urban Planning 98 (2): 99–109. doi:https://doi.org/10.1016/j.landurbplan.2010.07.015.
- Magill, A. W. 1992. Assessing Public Concern for Landscape Quality: A Potential Model to Identify Visual Thresholds. Vol. 203. Darby, PA: DIANE Publishing.
- Menard, S. 2002. Applied Logistic Regression Analysis. Vol. 106, (2nd ed.). Thousand Oaks, CA: Sage Publications.
- Molnarova, K., P. Sklenicka, J. Stiborek, K. Svobodova, M. Salek, and E. Brabec. 2012. “Visual Preferences for Wind Turbines: Location, Numbers and Respondent Characteristics.” Applied Energy 92: 269–278. doi:https://doi.org/10.1016/j.apenergy.2011.11.001.
- Real, E., C. Arce, and J. M. Sabucedo. 2000. “Classification of Landscapes Using Quantitative and Categorical Data, and Prediction of Their Scenic Beauty in North-western Spain.” Journal of Environmental Psychology 20 (4): 355–373. doi:https://doi.org/10.1006/jevp.2000.0184.
- Riechers, M., J. Barkmann, and T. Tscharntke. 2018. “Diverging Perceptions by Social Groups on Cultural Ecosystem Services Provided by Urban Green.” Landscape and Urban Planning 175 (175): 161–168. doi:https://doi.org/10.1016/j.landurbplan.2018.03.017.
- Samavatekbatan, A., S. Gholami, and M. Karimimoshaver. 2016. “Assessing the Visual Impact of Physical Characteristics of Tall Buildings: Height, Top, Color.” Environmental Impact Assessment Review 57: 53–62. doi:https://doi.org/10.1016/j.eiar.2015.11.008.
- Shanghai Municipal Statistics Bureau Survey Office of The National Bureau of Statistics Shanghai. 2018. Shanghai Statistical Yearbook. Beijing: China Statistics Press.
- Stamps Iii, A. E. 1990. “Use of Photographs to Simulate Environments: A Meta-analysis.” Perceptual and Motor Skills 71 (3): 907–913. doi:https://doi.org/10.2466/pms.1990.71.3.907.
- Strumse, E. 1996. “Demographic Differences in the Visual Preferences for Agrarian Landscapes in Western Norway.” Journal of Environmental Psychology 16 (1): 17–31. doi:https://doi.org/10.1006/jevp.1996.0002.
- Tsoutsos, T., A. Tsouchlaraki, M. Tsiropoulos, and M. Serpetsidakis. 2009. “Visual Impact Evaluation of a Wind Park in a Greek Island.” Applied Energy 86 (4): 546–553. doi:https://doi.org/10.1016/j.apenergy.2008.08.013.
- Tveit, M. S. 2009. “Indicators of Visual Scale as Predictors of Landscape Preference; a Comparison between Groups.” Journal of Environmental Management 90 (9): 2882–2888. doi:https://doi.org/10.1016/j.jenvman.2007.12.021.
- Uuemaa, E., M. Antrop, J. Roosaare, R. Marja, and Ü. Mander. 2009. “Landscape Metrics and Indices: An Overview of Their Use in Landscape Research.” Living Reviews in Landscape Research 3 (1): 1–28. doi:https://doi.org/10.12942/lrlr-2009-1.
- Van den Berg, A. E., and S. L. Koole. 2006. “New Wilderness in the Netherlands: An Investigation of Visual Preferences for Nature Development Landscapes.” Landscape and Urban Planning 78 (4): 362–372. doi:https://doi.org/10.1016/j.landurbplan.2005.11.006.
- Vouligny, É., G. Domon, and J. Ruiz. 2009. “An Assessment of Ordinary Landscapes by an Expert and by Its Residents: Landscape Values in Areas of Intensive Agricultural Use.” Land Use Policy 26 (4): 890–900. doi:https://doi.org/10.1016/j.landusepol.2008.10.016.
- Wang, R., and J. Zhao. 2017. “Demographic Groups’ Differences in Visual Preference for Vegetated Landscapes in Urban Green Space.” Sustainable Cities and Society 28: 350–357. doi:https://doi.org/10.1016/j.scs.2016.10.010.
- Wang, Z. 2018. “Evolving Landscape-urbanization Relationships in Contemporary China.” Landscape & Urban Planning 171: 30–41. doi:https://doi.org/10.1016/j.landurbplan.2017.11.010.
- White, E. V., and B. Gatersleben. 2011. “Greenery on Residential Buildings: Does It Affect Preferences and Perceptions of Beauty?” Journal of Environmental Psychology 31 (1): 89–98. doi:https://doi.org/10.1016/j.jenvp.2010.11.002.
- Yabuki, N., K. Miyashita, and T. Fukuda. 2011. “An Invisible Height Evaluation System for Building Height Regulation to Preserve Good Landscapes Using Augmented Reality.” Automation in Construction 20 (3): 228–235. doi:https://doi.org/10.1016/j.autcon.2010.08.003.
- Yao, Y., X. Zhu, Y. Xu, H. Yang, X. Wu, Y. Li, and Y. Zhang. 2012. “Assessing the Visual Quality of Green Landscaping in Rural Residential Areas: The Case of Changzhou, China.” Environmental Monitoring and Assessment 184 (2): 951–967. doi:https://doi.org/10.1007/s10661-011-2012-z.
- Yu, K. 1995. “Cultural Variations in Landscape Preference: Comparisons among Chinese Sub-groups and Western Design Experts.” Landscape and Urban Planning 32 (2): 107–126. doi:https://doi.org/10.1016/0169-2046(94)00188-9.
- Yusoff, N. A. H., A. M. Noor, and R. Ghazali. 2014. “City Skyline Conservation: Sustaining the Premier Image of Kuala Lumpur.” Procedia Environmental Sciences 20: 583–592. doi:https://doi.org/10.1016/j.proenv.2014.03.071.
- Zarghamia, E., M. Karimimoshaverb, A. Ghanbarana, and P. SaadatiVaghara. 2019. “Assessing the Oppressive Impact of the Form of Tall Buildings on Citizens: Height, Width, and Height-to-width Ratio.” Environmental Impact Assessment Review 79: 106287. doi:https://doi.org/10.1016/j.eiar.2019.106287.
- Zhao, M., J. Zhang, and J. Cai. 2020. “Influences of New High-rise Buildings on Visual Preference Evaluation of Original Urban Landmarks: A case Study in Shanghai, China.” Journal of Asian Architecture and Building Engineering 19 (3): 273–284. doi:https://doi.org/10.1080/13467581.2020.1729769.
- Zube, E. H., D. G. Pitt, and G. W. Evans. 1983. “A Lifespan Developmental Study of Landscape Assessment.” Journal of Environmental Psychology 3 (2): 115–128. doi:https://doi.org/10.1016/S0272-4944(05)80151-3.