
 ?Mathematical formulae have been encoded as MathML and are displayed in this HTML version using MathJax in order to improve their display. Uncheck the box to turn MathJax off. This feature requires Javascript. Click on a formula to zoom.
ABSTRACT
This paper proposes a gamified approach to collect and visualize human perception of daylighting in large-scale indoor environments using immersive virtual environments (IVEs). The developed system was tested by 20 participants, where their daylighting preferences for the virtual environment were collected at two daytimes through snapshotting and evaluating their points of interest in terms of brightness, as well as their evaluation of the system and daylight quality. Afterward, participants’ feedback was visualized into a perceptive lighting map (PLM) and compared to an image-based quantitative metric. The results of this experimental study found a tendency among participants to report more feedback in areas with large daylight portals rather than other areas with similar light intensity. Additionally, results from both subjective and simulation-based metrics showed consistency in defining daylight intensity, as well as explained the occurrence of contradicting user evaluations of some identical areas in IVE as a result of high contrast in brightness. The findings showed the adequacy of the proposed system as a visual source of user-centered feedback to daylighting in the early stages of design, as well as a supplement tool for building performance simulations (BPS).
1. Introduction
For architectural daylighting design, computer simulations can have three major benefits: Visualization, building performance simulation (BPS), and daylight optimization. BPS provides a quantitative approach to evaluate the quantity and distribution of daylight in a given space while considering design components such as building form, openings, and material physical properties (de Wilde Citation2018).
Unlike BPS, measuring user perception and preferences is mainly qualitative as it is based on feelings and sensations (Rockcastle and Andersen Citation2015), which is challenging to be validated as a mere source of design decision-making. For buildings in operation, user perception of daylighting can be measured using survey studies or performance indicators for certain tasks (reading, for example). Nonetheless, it is more challenging to collect such feedback in unbuilt spaces through virtual media, due to the absence of real-life experiences (Tahrani et al. Citation2005).
Immersive Virtual Environments (IVEs) have gained huge momentum as a valid medium to investigate the human perception of unbuilt spaces, including daylight perception (Chamilothori, Wienold, and Andersen Citation2018). Enormous studies have applied IVEs to investigate subjective qualities of daylighting within a user-friendly immersive interface (Chamilothori, Wienold, and Andersen Citation2016, Citation2018; Natephra et al. Citation2017; Rockcastle, Chamilothori, and Andersen Citation2017). However, limitations can be found in many of these studies in terms of environment scale, feedback methodology, and the extent of user–environment interaction, as analyzed in more detail in section 2.3. Many of these limitations can be solved using Gamification, which involves the enrichment of serious tasks with game design principles to motivate and increase the overall user experience (Korn et al. Citation2019).
This paper proposes a methodology for a gamified approach to measure daylight perception for large-scale indoor environments in IVEs. The proposed system utilizes Unreal Game Engine and HTC Vive Pro to visualize daylight effects for an architectural space. Twenty participants were asked to walk freely inside a VR model of a museum, control daytime, and report their bright/dark scene preferences. Also, their responses to a questionnaire on both system usability and daylighting qualities were collected. Finally, based on the participants’ preferences, a heat map of bright and dark areas was generated and compared to a simulation-based map of mean and Standard Deviation (SD) values of brightness, where the consistency among both resources was examined.
The expected outcomes of this study contribute to the improvement of IVEs effectiveness as a tool to assess the human perception of daylighting in large-scale spaces before being built, as well as giving a better understanding to user preferences and limitations related to light design in virtual environments, and whether these preferences agree with the widely used daylight empirical measurement indicators.
2. Related work
2.1. Evaluating lighting perception in immersive virtual environments
Numerous studies have addressed IVEs as an evaluative tool for daylighting, including visual comfort, glare perception, and interest in the scene. Chamilothori et al. (Citation2018) validated if immersive virtual reality is adequate to measure the human perception of daylit spaces in five aspects: perceived pleasantness, interest, excitement, complexity, and satisfaction. The experiment compared users’ perception of a real daylit room and its virtual replica through a Head Mounted Display (HMD). The study showed promising results of VR where no significant differences in perception were found between the real and the virtual environment. In a similar experiment, Rockcastle, Chamilothori, and Andersen (Citation2017) employed VR and HMD, along with head-tracking from a fixed view, to collect visual interest ratings of 8 different spaces in different sky conditions, and compared it to results predicted by an image-based algorithm where the study showed consistency between both results. In another study by Rockcastle and Andersen (Citation2015), they compared subjective ratings for 9 virtual architectural spaces in different sky conditions to local and global contrast metrics, whereas one of the interesting findings was that ratings of (excitement and stimulation) were consistent with quantitative contrast measurements more than that of (contrast) itself, of which those quantitative measurements were developed for.
While the discussed studies investigate daylight perception in IVE from an evaluative approach, other researches extend their utilization of IVE by offering interactive systems where users can customize lighting settings, which reflects an important insight on user preferences and behaviors. For example, Natephra et al. (Citation2017) used Unreal engine (UE) to design an interactive lighting design system in VR, offering a simulation for both daylight and artificial light. A wide variety of interactive options were offered, including moving and rotating fixtures, and changing lighting conditions. Another study by Heydarian et al. (Citation2017) Investigated user lighting preferences in IVE while offering the choice to open or close window shutters as well as customizing artificial lighting intensity while performing a reading task. The study found that participants not only preferred to have maximum possible daylighting but perform better in that condition.
2.2. Gamification as an engaging design tool
Gamification became one of the most utilized approaches for encouraging individuals to actively participate in various types of activities (Hassan and Hamari Citation2019). In the last few years, it has become a trending buzzword in many fields as a medium of improving user engagement and enhancing user activity, social interaction, and productivity (Hamari, Koivisto, and Sarsa Citation2014). Several researchers have addressed the definition of gamification. For instance, Nick Pelling coined the term gamification as a fast and enjoyable transfer of electronic transactions through the game (Pelling Citation2011). Deterding (Citation2019) defines gamification as a process to translate the engaging aspects of games into other non-gaming aspects in order to generate positive user experience and motivate desired attitudes. Similarly, Karl Kapp identifies gamification as a means for game-oriented thinking, encouraging participatory learning and problem-solving (Aşkın Citation2019). Gamification is mainly oriented around applying game mechanics (Raymer Citation2011) into non-gaming contexts, one major example is the use of points, badges, and leaderboards (PBL) (Chou Citation2019). In this context, gamification can be seen as an approach to invoke the same psychological experiences that actual games bring, to improve users’ focus, motivation and enjoyment in the action they do (Huotari and Hamari Citation2012).
Gamification has been employed in many fields, including education (Dicheva et al. Citation2015; Nah et al. Citation2014), product design, marketing (Hofacker et al. Citation2016), and co-design (Dodero et al. Citation2014). In architectural design, many studies have utilized gamification to enhance participatory design and occupants’ feedback on the design process. For example, Haworth et al. (Citation2020) developed an approach to replace the traditional designer-as-user concept by a gamified crowdsourced design methodology, where it showed evidence as an interesting approach to collaborative environment design. In another study by Schnabel, Lo, and Aydin (Citation2014), a gamified design platform was introduced, focusing on urban mass housing projects. The platform aimed to engage architects, landlords, developers, and residents to generate participatory design solutions in a gamified online platform. This enabled the development of novel design outcomes that consider the needs of different parties in the design process. In a similar context, Aşkın (Citation2019) integrated gamification in interior design education, where a post-experiment survey showed that it increased the students’ motivation and provided multiple alternatives through the design process.
2.3. Motivation and research gap
As discussed in Section 2.1, a number of studies have employed IVEs as a medium for perceptual evaluation of daylighting conditions (Rockcastle and Andersen Citation2015; Chamilothori, Wienold, and Andersen Citation2018; Rockcastle, Chamilothori, and Andersen Citation2017; Heydarian et al. Citation2017), benefiting from the immersive nature of such approach. However, in terms of gamification (as defined in section 2.2), it is evident that there is a gap between applying gamification principles (which involves high interactivity) and utilizing IVEs for daylight evaluation, despite the benefits gamification can add to users’ experience and thus to their feedback reliability. One of the major factors of this gap is the wide reliance on validated light simulation tools (e.g. Radiance) due to its photometric accuracy in representing lighting environment. On the other hand, these tools show notable limitations in rendering speed (Jones and Reinhart Citation2017) and user interface customization, which are two crucial factors for effective interaction between the user and the virtual environment.
A number of limitations within the current literature employing IVE can be argued as follows: Firstly, lack of diversity in terms of case study scales and types. In many of the studies, the model used for evaluation is often a small room with a simple floor plan and minimal furnishing and surface textures (Chamilothori, Wienold, and Andersen Citation2018; Heydarian et al. Citation2017). Also, while studies tend to focus on office spaces, other user-oriented types of spaces such as libraries and museums are very little represented, despite the major role daylight plays within their design process (Kaya and Afacan Citation2018; Othman and Mazli Citation2012).
Secondly, it is noted that only a limited number of experiments allow users to walk into the virtual environment (Natephra et al. Citation2017; Heydarian et al. Citation2017), where others rely on head movement and looking around as a mere approach of exploration. Finally, while some systems let users interact with the environment (pick objects, switch on lights), the environments tend to be static (inability to change daytime/sun position) and have no built-in tools to export user feedback into analyzable data (images, maps) rather than relying on verbal questionnaires. These limitations can be overcome by delivering gamified content inside IVE, which offers users a wide variety of choices while having tools to express personal preferences.
This paper aims to bridge those gaps by proposing an interactive gamified system where users can move around freely, control daytime and artificial lighting, and snapshot what they see. The system offers a novel approach for collecting user daylighting preferences in virtual spaces and provides a comparative analysis between such feedback and quantitative lighting metrics of the same space. Through this approach, user daylight preferences can be collected during the early stages of the design phase, enabling architects to effectively make more user-centered decisions when it comes to daylighting.
3. Methodology
This study aims to present a novel approach of implementing IVE for measuring subjective characteristics of daylighting in indoor environments through a gamified system, where users are offered more flexibility and choices while giving their daylight preferences in real-time in IVE; then, their preferences are compared to quantitative metrics to check consistency between user perception and such measurements. To validate the proposed system, a case study on a large-scale art museum was conducted, where 20 participants were recruited to collect their daylighting preferences as well as their evaluation of the system usability and daylight qualities of the museum.
3.1. Case study
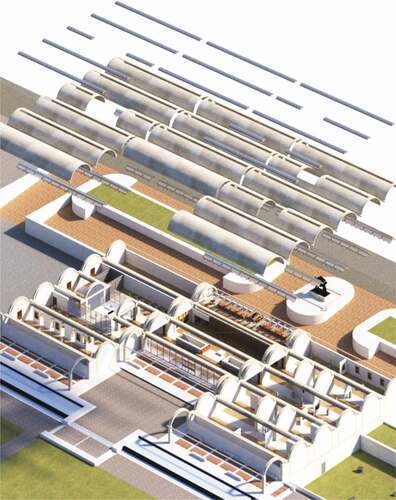
A virtual model based on the Kimbell Art Museum in Fort Worth Texas (by Louis Kahn) was designed and modeled as the case study of the proposed system (). This building was chosen as the case study for its unconventional daylight utilization (Kacel and Lau Citation2013) and secondly, being a public building expands the pool of its potential users to virtually anyone, unlike the limited usability of office environments. Thirdly, it extends over a large area and contains multiple spaces with variable daylight effects throughout the day, and each space has enough complexity to enrich the immersive experience and make users more curious to explore.
Figure 1. Axonometric of the designed model, showing roof structure and spaces
While various studies have investigated the luminous environment in Kimbell Art Museum both quantitatively and subjectively (Kacel and Lau Citation2013; Pierce Citation1998; Varzgani Citation2015; Roginska-Niesluchowska Citation2016), there is a lack of studies employing interactive systems and real-time rendering for a user-based daylighting evaluation of the museum, which is covered in this paper.
3.2. Experiment setting
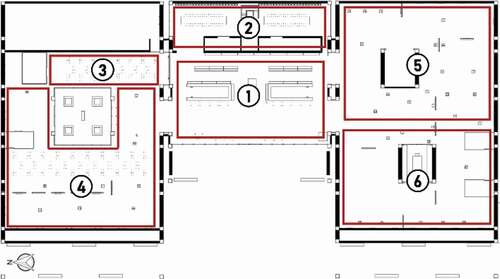
The designed virtual model comprised 6 cycloid vaults with a total width of 56 m and a total length of 96 m over three bays. The floor plan covered an area of 3380 m2 and consisted of 6 main areas (main lobby, three galleries, cafeteria, and library) ().
Figure 2. Floor plan of the virtual model showing main areas as follows; 1) Lobby 2) Library 3) Café 4) North gallery 5) South gallery A 6) South gallery B
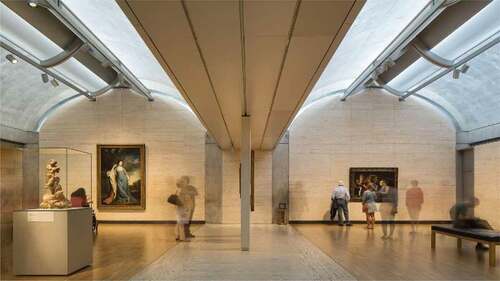
For daylighting, each vault had a longitudinal roof opening along its center equipped with reflectors to maximize light gain on the ceiling (). Also, walls and arched walls contained narrow light slits. The model had one main courtyard in the north gallery, and two small courtyards in the south galleries.
Figure 3. Daylighting strategy in Kimbell museum through light reflector devices (CitationLouis I. Kahn Building | Kimbell Art Museum)
The experiments were conducted in a dedicated office space at Osaka University in Suita, Japan. This space had three windows facing North-east and North-west, shutters were fully retracted during experiments in order not to distract participants’ perception with ambient sunlight from the outside. The experiments took place from March to May 2019 between 12:00 pm and 6:00 pm.
A Desktop PC equipped with NVidia Quadro RTX 6000 graphics card and 64 GB of RAM was used to operate the system. The designed model location and lighting were based on the original site in Fort Worth, Texas. The date was set to 23 June with a clear sky and the default time was 9 am. However, the system enabled participants to change time freely up to 6 pm.
3.3. Model setup
The workflow for creating the proposed IVE system was as follows: First, detailed plans and elevations of the building were modeled in AutoCAD. Then, the blueprints were imported into 3ds Max as splines, where all the meshes and surfaces were created to realize the full digital model of the museum (). Daylight-related geometries such as reflectors were modeled separately to guarantee accurate daylight simulation. Furthermore, furniture and art pieces (sculptures, paintings) were created and positioned in 3ds Max.
Figure 4. A diagram showing the experiment workflow and outputs
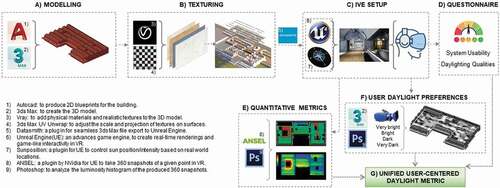
Using Vray, physical materials were added to all the surfaces to resemble the appearance of the real museum, where reflection and refraction values were set up accordingly. Textures were scanned and stitched using a library of photos for the interior of the museum, whereas their scales were adjusted using 3ds Max UV mapping tools ()).
3.4. Daylighting setup
After finishing the full-textured model in 3ds Max and V-ray, it was imported into Unreal Engine (UE) 4.22 using the Datasmith Plugin. Through this approach, the model materials and textures were preserved. Materials with refractive and/or reflective values were recreated from scratch in the UE material editor to ensure accurate light simulation.
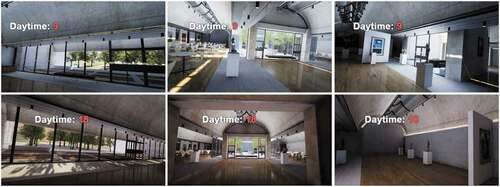
For the daylighting setup, a single directional light source was used to simulate the sun, which was linked to a sun position plugin to automatically control intensity, tone, and position of the directional light and sky sphere according to real location data ()). Coordinates were set to 32.755501 and −97.330803 (Fort Worth, Texas) and the date was set to 23 June and Time zone to −6. Sky lighting was simulated through a Preetham sky model (Preetham, Shirley, and Smits Citation1999) with a sunny sky condition. Daylight simulation was built separately at two day times (9 and 18) at the highest lighting quality, and each timing was stored as a separate game level ().
Figure 5. Daylighting conditions in different areas of the virtual museum at the two designated day times
3.5. Verification of scene luminance in game engine
As the consistency between the simulation effect and the photometric characteristics of the actual view needs to be validated, a comparison was set at one scene of the virtual museum, between illuminance values produced by UE4 simulation and those calculated by a validated light simulation tool. Velux Daylight Visualizer V 3.0 was selected for quantitative daylight simulation, where luminance values were calculated for the investigated scene. This tool was selected in particular due to its sophisticated interface (compared to the command-line-based Radiance (Ward and Shakespeare Citation1998)) and its thoroughly validated results (Labayrade, Jensen, and Jensen Citation2009; Iversen et al. Citation2013). The 3D model was imported from 3DS Max, and surface properties and daylighting settings in UE4 were replicated in Daylight Visualizer. Then, a luminance simulation was run at a fixed scene in the north gallery of the museum, where luminance values at 9 points were collected. The simulation ran at 9 am and 6 pm time settings. In UE4, the luminance values at the given points were extracted using the built-in HDR Histogram viewer, which can render the scene in false color that represents luminance levels simulated by UE4 lighting (). shows a comparison between the luminance values calculated by Velux daylight visualizer and corresponding values in UE4 simulation at the two scene times (9:00 am and 6:00 pm). Across the nine investigated points, it was noticed that UE4 calculations overestimated that of Daylight Visualizer at some points (e.g. point H), while underestimated the calculations at other (e.g. point A). Thus, to unify the positive and negative discrepancies between the two tools, the error percentage of UE4 compared to Daylight Visualizer was calculated as an absolute value, based on the formula:
Figure 6. Luminance distribution of an identical scene in Daylight Visualizer (left) and UE4 (right) at 9 am
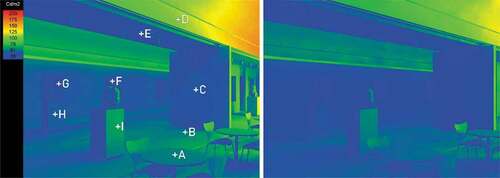
Table 1. Illuminance results in Velux Daylight Visualizer and UE4, showing error percentage of each measurement
The maximal error percentage of UE4 rendering was 19.9% and 25.0%, respectively, for 9 am and 6 pm. The average errors were 7.1% and 7.0% for all measurements at 9 am and 6 pm respectively.
3.6. Interactive IVE setup
Various controls were developed and programmed using Blueprints, which is a visual scripting tool for UE. Through this approach, participants had the option to (move freely in the virtual space, jump, show/hide daytime label text, switch on/off artificial lighting, change daytime, snapshot what he/she sees). An HTC Vive Pro HMD with 2880 × 1600 pixels combined screen resolution and 90 Hz refresh rate, Vive motion controllers, and two tracking stations were connected to the system.
Participants’ daylighting preferences were collected at two daytimes (9 am and 6 pm) through walking around different areas within the museum and snapshotting the spots they felt brighter/darker than average ()).
These snapshots were stored in the system and converted to identical cameras in 3ds Max to generate a collective overlook of user-based daylight heat map comparable with various quantitative daylight ()). Also, a post-experience questionnaire was provided to collect participants’ evaluation of the usability of the system as well as simulated daylight properties ()).
Through this approach, the output of this study aims to introduce a methodology to tackle both subjective and quantitative daylight measurements side by side as one unified metric ()) to evaluate (and later optimize) daylight performance of indoor environments in early stages of design, considering both human-related factors and energy/sustainability recommendations.
4. Experimental procedures
A pilot study was conducted to validate the IVE system performance and collect preliminary feedback for future improvements. For this pilot study, only three participants were recruited. However, they offered extensive feedback which helped us bypass the limitations of the system and improve the overall performance. For example, the time needed for the transition between daytimes was minimized. World scale settings were recalibrated to be more accurate. Finally, lighting simulation was rebuilt separately for each daytime for better variation in position, intensity, and tone of simulated sunlight.
4.1. Participants
For the main experiment, 20 participants (12 males, and 8 females) were recruited in this study. The participants were 60% Masters students and 40% Bachelors students at Osaka University and were aged from 18 to 24 years (80%) and from 25 to 39 years (20%). While the participants were majorly architecture students, they had limited knowledge of daylight metrics and evaluation, which was important to ensure unbiased feedback towards the system. VR experience among participants seemed to be limited, where 40% have never tried an HMD and 45% tried it only once.
4.2. Experiment protocol
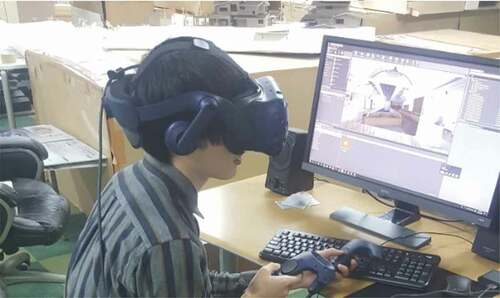
Firstly, participants were introduced to a computer-based introduction form and read a brief about the research topic and the experimental procedures. Then, they proceeded to an introduction about the Kimbell Art Museum, including a video walkthrough in different parts of the building. Finally, an explanation of the tasks they should fulfill during the experiment was provided. Secondly, participants were asked to put on the HMD and try a sample scene to get familiar with the IVE system and controls ().
Figure 7. A participant trying the sample scene at different daytimes
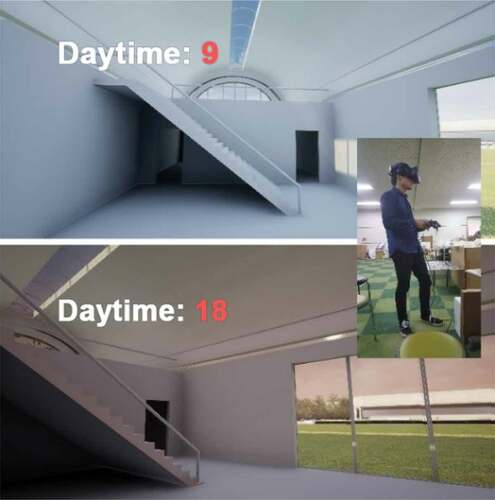
After participants felt familiar with the HMD and controllers, the full virtual museum was loaded at the default position at the lobby at 9 am. Participants were asked to use the snapshot button to report the spots (scenes) where they feel one of the following cases existed regarding daylighting: very dark, dark, bright, or very bright scene. Participants were free to take as many snapshots as they wanted and freely manage to switch between 9 am and 6 pm (). Each time a participant took a snapshot, he/she was asked to verbally report their evaluation of what they snapshotted.
Figure 8. A participant taking a snapshot for a bright scene
Once participants finished their tasks, they were asked to take off the HMD and then were introduced to a 5-point scale questionnaire with the following verbal anchors on the extremes: strongly disagree matches 1 point and strongly agree matches 5 points. For scale interpretation, responses ranging from 1 to 3 points were addressed as negative (disagreed), while 4 to 5 points were considered positive (agreed). The questionnaire collected users' preferences during the experiment, as well as evaluation of the system usability (quality and immersion, interaction, comfort) and daylight properties (uniformity, intensity, functionality, aesthetics) ().
Table 2. The post-experience questionnaire aspects and questions
4.3. Perception-oriented luminance maps
To properly visualize the daylight preferences collected into an output that is comparable to other relevant quantitative daylight metrics, more analysis was needed. Therefore, we introduced a methodology to generate perceptive lighting map (PLM), which is a perception-oriented luminance map projected over the floor plan of the IVE based on the density of reported evaluation points. Through this approach, coordinate-based data can be produced and visualized in the same manner that other quantitative metrics are simulated.
) pinpoints the generation of the perceptive lighting maps within the methodology of the study. Firstly, the snapshots taken by participants were manually exported to 3ds Max as target cameras, where each camera accurately replicated its original snapshot while offering both position and sightline data. Then, categorized by evaluation (very dark, dark, bright, very bright), each camera collection was exported as a layer to Photoshop and positioned to its corresponding XY coordinates on the floor plan. Finally, a gradient red-blue overlay was applied to reflect the density of evaluations at any given point on the floor plan.
4.4. Comparing perceptive lighting maps against daylight metrics
This section presents a case study of comparing perception-based daylight evaluation to relevant simulation-based metrics, in order to have an insight on the consistency of simulation-based daylight performance indicators with actual user needs, and thus achieve performative daylight solutions through a more user-centered approach. There are various types of quantitative daylight metrics, some of which are limited to fixed date and time (illuminance and luminance), while others are annual (Spatial Daylight Autonomy (sDA) ((Chair) Heschong et al. Citation2012), Useful Daylight Illuminance (UDI) (Nabil and Mardaljevic Citation2005)).
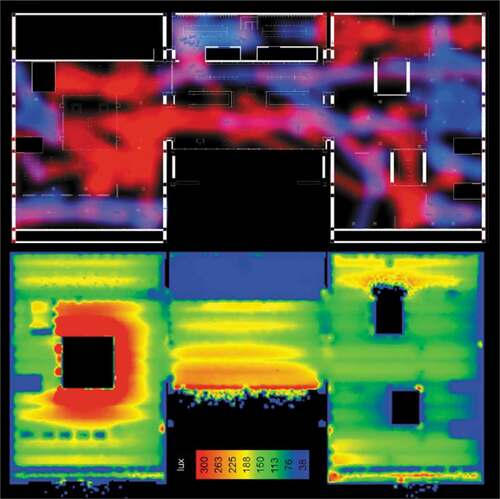
() shows an Illuminance map (in Lux) for the virtual model, side by side to the generated PLM. The illuminance map was simulated in VELUX Daylight Visualizer with the same location and time settings as in the developed system. While the two maps agree on some data results, for example, the highest light illuminance around the main courtyard, such comparison can still be questionable. On one hand, as seen in other quantitative lighting metrics, the illuminance map measures the quantity of luminous flux falling on a 2D surface, in other words, light intensity falling on horizontal surfaces (e.g. floors, desks). On the other hand, perceptual-based measurements like PLMs are based on the user’s impression of the ambient environment in 3D space, not to a specific surface. A similar limitation also applies to consolidated annual metrics such as sDA and UDI. Moreover, the methodology of generating the perceptual maps is based on point-in-time measurements; thus, it cannot directly be compared to over-the-year metrics.
Figure 9. PLM (upper) and Illuminance map (lower) for the virtual model on June 23, 9 am
In the context of visual comfort and occupant perception of daylighting. Luminance-based metrics, vertical illuminance, and cylindrical illuminance have shown better results than horizontal illuminance in predicting discomfort glare and occupant light preferences (Marty et al. Citation2003; Van Den Wymelenberg and Inanici Citation2014; Torres and Verso Citation2015). While the reported snapshots did not cover every corner of the virtual environment, the generated PLMs could qualitatively predict perceptual daylight intensity at any point of the investigated model. Thus, a similar simulation-based light map, extending over the whole floor plan was needed for a robust spatiotemporal comparison between perceptual and actual luminances in the virtual model.
4.4.1. Image-based brightness
In order to realize an accurate comparative analysis between PLM outputs and daylight quantitative measurements, a metric that indicates average daylight brightness in 3D space, similar to PLM, should be used. Therefore, we developed a novel image-based metric of daylighting in a virtual environment based on luminosity histogram analysis. In photography, a luminosity histogram is a graphical representation of pixel brightness within a digital image expressed by the tonal range of each pixel in units from 0 (darkest) to 255 (brightest) based on RGB (red, green, blue) channel brightness scale units (Nikon Citation2019). In the same context, luminosity can be hereby considered a lighting metric that qualitatively represents the brightness of a given scene. In such a case, the brightness mean value of an image would express its average relative luminance based on the average tonal value for all pixels in the image. Similarly, the standard deviation of brightness values expresses the discrepancies between pixel brightnesses and the mean value. Thus, a low standard deviation can suggest a low contrast in the image exposure (i.e. lighting) and vice versa. Research work by Inanici et al. has investigated luminance-based design metrics based on HDR images as a tool for predicting human visual comfort of lighting (Kumaragurubaran and Inanici Citation2013; Van Den Wymelenberg, Inanici, and Johnson Citation2010).
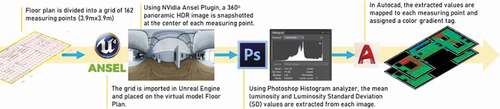
() shows the workflow of mapping scene brightness data for the virtual model. Firstly, the floor plan of the virtual model was divided into 162 square grids as measuring points, each of 3.9 × 3.9 m dimensions. Then, the grid is overlaid on the virtual model in Unreal Engine, and using Nvidia Ansel Plug-in (NVIDIA Ansel Citation2017), a High Dynamic Range (HDR) 360° Panoramic image is snapshotted at the center of each measuring point at 9 am. The generated HDR images’ luminances were calibrated and tone mapped using the Ward method (Larson, Rushmeier, and Piatko Citation1997) in Hdrscope software (Kumaragurubaran and Inanici Citation2013). In Photoshop Histogram analyzer, the brightness data of each image could be extracted. In this case, two values were of importance to this study, the first is “mean brightness”, which expresses the average brightness of all the pixels in the image (intensity), and the second is “brightness Standard Deviation (SD)”, which indicates the extent of extreme brightness values (very dark, very bright) within the image (brightness contrast). With these two values recorded for each given measuring point, they were mapped on the model floor plan as text values and color gradients ranging from blue (lowest) to green (highest).
Figure 10. Workflow of developing mean and SD brightness maps for the virtual model
5. Results and analysis
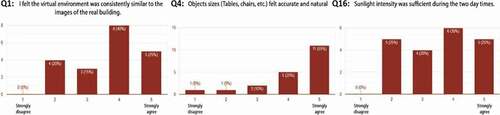
As discussed in section 4.2, after participants finished their VR experience, they were given a post-experiment questionnaire to assess various aspects of the virtual system usability and perceived realism level. In response to Q1 (), the majority of participants agreed on the consistency between the virtual environment and the real museum, where 40% agreed (4-points) and 25% strongly agreed (5-points) to the statement (Q1). For Q2 regarding the overall realistic feel of the virtual environment, 83.4% of participants responded positively (4 to 5 scale points). The system also got a positive impression of scale perception, whereas 55% strongly agreed that they felt the scale of the surrounding objects to be natural, while 25% agreed (4 points) (Q4).
Figure 11. Participants’ ratings for system realism and simulated daylighting
Regarding system controls, 83.3% of participants found the controllers to be responsive (Q8), while 50% found the system easy to get familiar within a short time (Q5). However, the locomotion technique used was reported by some users as “too fast” or has a “sliding effect”. In the questionnaire, 35% of participants did not feel the sense of movement was realistic (Q9) (1 to 3 scale points).
Regarding simulated daylighting evaluation, 55% of participants showed fair to strong agreement (4 to 5 scale points) that the intensity of simulated sunlight was generally sufficient in the two reviewed day times (9 am and 6 pm) (Q16) and adequate to lit walls and floors (70%) (Q21). Also, the majority of participants positively evaluated the variability of simulated sunlight in terms of intensity (Q18), tone (Q19), and generated shadows (Q20) at different times (75%, 79.2%, and 54.1%, respectively). However, for exhibited items (paintings and sculptures), 41.7% of participants preferred if artificial lighting lit them along with daylighting.
5.1. Daylight perception in IVE
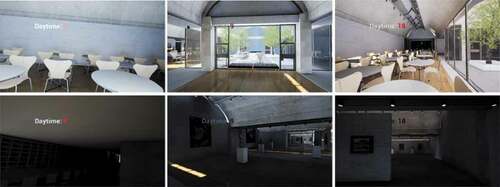
Participants were asked to report their daylighting preferences in IVE by snapshotting the scene which they perceive as very dark, dark, bright, or very bright within the six areas of the virtual museum during two daytimes in virtual reality (). Participants were also able to compare the brightness of a given scene in VR at 9 am and 6 pm immediately by standing at the same scene and change time settings using the motion controllers.
() shows the distribution of reported scenes at two daytimes spread among the main 6 areas of the museum (defined in ), ranked from very dark to very bright. Participants produced 326 snapshots, with a nearly equal distribution between bright (53%) and dark rankings. Participants reported dark scenes at 9 am at a nearly equal rate to the bright ones (42%). Another finding is that while the north gallery, where the main courtyard can be found, had most of the reported bright scenes during 9 am, the south gallery A had a higher number of bright snapshots at 6 pm; however, the fact that its courtyard is much smaller.
Figure 12. Participants’ snapshots distribution at 9 am and 6 pm
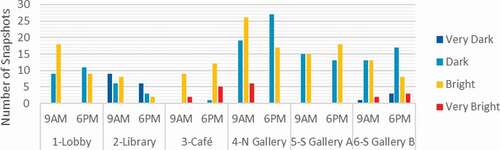
Figure 13. Sample of scenes perceived by participants as “very bright” (upper row) and “very dark” (lower row) at the two day time settings
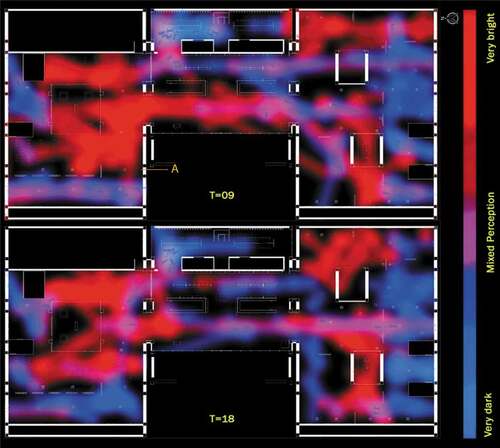
Based on the methodology discussed in Section 4.3, shows user daylight evaluation maps at 9 am and 6 pm. The results showed that areas surrounding the main courtyard (north gallery and cafeteria) obviously had the highest density of perceived bright scenes at both daytimes. However, in some areas such as south gallery A and parts of the cafeteria, participants tended to report more bright scenes at 6 pm than 9 am. Another finding was the “mixed perception” spots (violet color), where participant’s perceptions conflicted for the same area, some evaluated as bright while others evaluated as dark. This effect could be found along the exhibition wing in the north gallery A at 9 am, while found in the lobby area at 6 pm. However, map analysis did not show a significant tendency of this effect to occur more at one daytime than the other.
Figure 14. Heat maps showing the density of users’ evaluated snapshots (T is daytime)
5.1.1. Case study: comparing PLM to scene brightness values
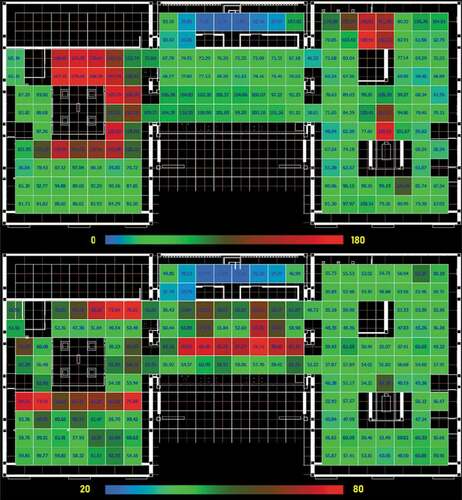
Through the methodology discussed in section 4.4.1, a quantitative daylight metric in the virtual environment, based on the average brightness of a scene 3D space, could be generated and thus compared to the produced PLMs (). In this section, a case study of comparing PLM data at a given daytime to a quantitative lighting metric of the virtual environment is illustrated, where both are based on evaluation of average brightness of a given scene in 3D space. This comparison aims to validate the accuracy of participants’ feedback in perceiving daylight intensity in IVE, and whether their results can agree with other daylight metrics at the same settings. To do so, the position of each of the 217 snapshots in PLM (9 am) was matched to the deduced brightness mean value at the same location on the floor plan.
Figure 15. Average scene brightness values (upper) and SD values (lower) of the virtual model at 9 am
SPSS statistical software was used to conduct a scatter plot graph (), as well as a Pearson correlation analysis between user snapshot ranking at a given point and its corresponding mean brightness values. The correlation coefficient (r) was 0.424, with a statically significant correlation level (P < 0.001) (). This analysis proves a moderate positive correlation (Akoglu Citation2018) between brightness mean values and participants’ perception in IVE, and thus the consistency between results based on PLMs and this quantitative metric.
Figure 16. Scatter plot of perception-based ranking and mean brightness values for a given spot at 9 am
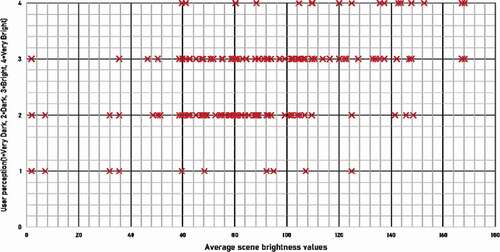
Table 3. Pearson correlation analysis between scene brightness values and user snapshot rankings
5.1.2. Mixed perception: contradictions in daylight perception in IVE
In this study, the generated PLM visualized daylight intensity in a virtual environment based on the collective perception of participants. However, one finding of such a map indicates that in some areas, there is an overlap between perceptions as dark and bright for the same scene, which we refer to in this study as “Mixed Perception” phenomenon. shows 10 scenes of “mixed perception”, where at least two participants snapshotted the same scene but perceived it differently. These spots appeared to be randomly distributed among the six areas of the virtual model, as well as occurred at both day times.
Figure 17. Scenes where “mixed perception” occurs and their respective snapshots at 9 am
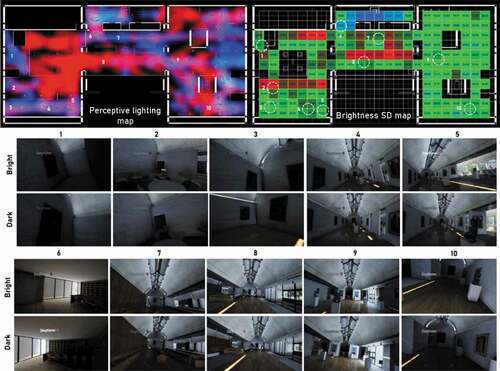
shows the corresponding brightness mean and SD values for each of the 10 scenes. It was found that 9 out of 10 scenes had a higher SD than average. As SD value expresses contrast levels in the captured scene, it may suggest that the more non-uniform lighting in the scene the more participants’ perception is confused. However, many factors can contribute to such a phenomenon, including participant personality, which is not within the scope of this study, and thus it will be investigated thoroughly in a future study.
Table 4. Areas of “mixed perception” and their respective SD and mean brightness values
6. Discussion
This study introduces an interactive system to collect user feedback and preferences on daylighting in virtual environments and generates Perceptive Lighting Maps (PLMs) that indicate subjective performance in a comparable approach to quantitative, simulation-based daylight metrics. The case study of comparing PLM data to brightness maps shows the benefits this system can offer to architects and lighting designers in improving their design alternative to be more human-oriented and detect potential conflicts between simulation results and future-user perception of the same space at early stages of design.
As regards to workflow speed, the use of game engines as light simulation tools showed noticeable advantages over traditional photometric rendering tools (e.g. Radiance, V-Ray). In this study, the used game engine was fully compatible with the meshes and materials produced in the 3d modeling software, and thus needed no additional time for refining or tweaking the model. Furthermore, the process of setting up the VR controls was simple as it is already embedded in the game engine and only needs minimal customization by the user. Moreover, the built-in daylighting plugin enabled a simple definition of sky conditions and spatiotemporal settings of the model. For daylighting rendering, one of the major advantages of game engines is the ability to render the whole model in real time. Thus, after the initial lighting setup, users can freely explore any part of the model without the need to wait for new renders to be generated. These observations show that even with the added benefits of building the gamified model in VR, the time needed to achieve this result is noticeably less than that in traditional software tools (e.g. 3Ds Max), specifically when many scenes/lighting conditions within the model need to be evaluated.
In this experiment, our proposed VR system had a generally positive evaluation by users in terms of realism, scale perception, and daylight quality, which is consistent with findings of similar studies utilizing IVE for daylight subjective evaluations (Chamilothori, Wienold, and Andersen Citation2018; Chamilothori, Wienold, and Andersen Citation2016). These advantages show the potential adequacy of IVE as an alternative to real environments to measure daylight perception, as well as the potential of game engines as an accurate light simulation tool.
A majority of participants reported motion sickness while in IVE. While this is a known limitation of VR (Langbehn, Lubos, and Steinicke Citation2018), around third of the participants did not feel the locomotion technique was realistic enough, which constructs the finding that the “slide” motion effect used in the system was disorienting to the physical state of participants and thus motivated motion sickness.
Unlike previous studies, where user perception evaluation is limited to a fixed scene, our proposed system gave participants the freedom of movement and choice to express their individual experience within IVE and only highlight what they find worth noticing. The produced snapshot maps focused on visualizing user evaluation of daylighting. However, it can be a useful resource to investigate users’ “wandering” behavior inside the virtual space and thus predicting points of interest and high-occupancy areas at an early design stage. The generated PLMs showed that users tended to have higher presence and interest in areas with large daylight portals (as in courtyards) and thus gave more feedback there rather than in other areas with smaller window sizes, even if they have the same brightness. Another finding was that participants gave contradicting evaluations as dark and bright for a number of spots, which is inapplicable in quantitative measurements. The mixed perception phenomenon was visualized as violet spots in PLMs. Using brightness SD map, where it was found that areas of mixed perception often had a higher SD compared to scene with a clear detection of bright or dark zones. In other words, scenes with higher contrast between bright and dark areas affected user perception of concluding whether the scene is dark or bright.
As a lighting metric, PLMs showed consistency with results drawn from quantitative mean brightness values in terms of identifying daylight intensity in different areas. Knowing the underlying information that PLMs offer, this finding shows not only their potential as a supplement to quantitative metrics but also their advantages as a rich indicator of daylight performance of which accuracy is improved as the number of snapshot feedback increases.
7. Limitations and future work
This paper introduces a framework to collect and visualize user daylight preference in virtual environments. Despite the overall positive review of the system and its ability to successfully produce results consistent with quantitative metrics, a number of limitations can be found. As future work, we intend to improve the proposed system by adding more gamified tasks and user performance indicators (i.e. reading tests). In addition, we aim to increase the sample size which will help to furtherly validate the findings of this study. Another limitation to the system is the high record of motion sickness reported by users, which makes it difficult to sustain user immersion for long times. We aim to overcome this limitation by developing less motion sickness-inducing locomotion techniques (e.g. teleport (Langbehn, Lubos, and Steinicke Citation2018)).
While the system’s case study in this experiment was based on a real building (Kimbell Art Museum), the results deduced from the system were not compared with an on-site daylight analysis. Therefore, we aim to assign another case study of a real building that is easily accessible, to compare the resultant perception-based evaluations in both the virtual and real environments. Another potential limitation is that the experiment was limited to one spatial setting and one date and sky condition (clear sky). As a future work, perceptions under an overcast sky conditions would be furtherly investigated for the same building model. While mean and SD brightness values are considered valid indicators of the environment’s brightness and contrast in different areas, in a future study, we aim to validate the introduced methodology through comparing PLM outputs to established quantitative metrics, including vertical and cylindrical illuminances.
8. Conclusions
In this study, we proposed a novel interactive approach to collect and visualize perceptual user daylighting preferences in a museum virtual environment at two daytimes. Twenty participants submitted 326 evaluated points of interest through snapshotting in IVE, as well as their evaluation of the system and simulated daylight quality. The results showed a positive impression from participants towards the system and the freedom it offered. Additionally, it was found that areas around large sunlight portals had a significantly higher number of reported snapshots. The developed perceptive lighting maps offered a visual insight into users’ behavior and showed various areas in the virtual model that had contradicting evaluations by users (mixed perception). Through comparing such maps to image-based brightness analysis, a potential correlation was found between areas of high brightness SD values and mixed perception effect. The comparison also showed consistency between both maps in identifying daylight intensity.
The system used in this study offers designers a visualized user-centered feedback that is comparable to quantitative daylight simulation outputs, enabling them to review their designs in the light of actual user needs and perception of the space regarding lighting at an early stage of conceptualization. Additionally, the proposed system can be furtherly developed to investigate more user attributes, including occupation rates and façade setting preferences.
Disclosure statement
No potential conflict of interest was reported by the authors.
References
- Akoglu, H. 2018 September. “User’s Guide to Correlation Coefficients.” Turkish Journal of Emergency Medicine 18 (3): 91–93. doi:https://doi.org/10.1016/j.tjem.2018.08.001.
- Aşkın, G. D. 2019. “Gamification of Design Process in Interior Architecture Education: Who? With Whom? Where? How?” SHS Web of Conferences 66: 01040. doi:https://doi.org/10.1051/shsconf/20196601040.
- (Chair) Heschong, L. et al. 2012. “Approved Method: IES Spatial Daylight Autonomy (SDA) and Annual Sunlight Exposure (ASE).” IES - Illuminating Engineering Society, 978-0-87995-272–3. [ Online]. http://www.ies.org/store/product/approved-method-ies-spatial-daylight-autonomy-sda-and-annual-sunlight-exposure-ase-1287.cfm
- Chamilothori, K., J. Wienold, and M. Andersen. 2016. “Daylight Patterns as a Means to Influence the Spatial Ambience: A Preliminary Study.” Proceedings of the 3rd International Congress on Ambiances, Volos, Greece.
- Chamilothori, K., J. Wienold, and M. Andersen. 2018 January. “Adequacy of Immersive Virtual Reality for the Perception of Daylit Spaces: Comparison of Real and Virtual Environments.” LEUKOS: 1–24. doi:https://doi.org/10.1080/15502724.2017.1404918.
- Chou, Y. 2019. Actionable Gamification: Beyond Points, Badges, and Leaderboards. Birmingham: Packt Publishing .
- de Wilde, P. 2018. Building Performance Analysis. 1 ed. New York, USA: Wiley-Blackwell.
- Deterding, S. 2019 April. “Gamification in Management: Between Choice Architecture and Humanistic Design.” Journal of Management Inquiry 28 (2): 131–136. doi:https://doi.org/10.1177/1056492618790912.
- Dicheva, D., C. Dichev, G. Agre, and G. Angelova. 2015. “Gamification in Education: A Systematic Mapping Study.” Journal of Educational Technology & Society 18 (3): 75–88.
- Dodero, G., R. Gennari, A. Melonio, and S. Torello. 2014. “Towards Tangible Gamified Co-design at School: Two Studies in Primary Schools.” In Proceedings of the first ACM SIGCHI Annual Symposium on Computer-human Interaction in Play, 77–86. Toronto, Ontario, Canada.
- Hamari, J., J. Koivisto, and H. Sarsa. 2014 January. “Does Gamification Work? – A Literature Review of Empirical Studies on Gamification.” In 2014 47th Hawaii International Conference on System Sciences, 3025–3034. Waikoloa, HI. doi:https://doi.org/10.1109/HICSS.2014.377.
- Hassan, L., and J. Hamari. 2019. “Gamification of E-Participation: A Literature Review.” Presented at the Hawaii International Conference on System Sciences, Maui HI, USA. doi:https://doi.org/10.24251/HICSS.2019.372.
- Haworth, M. B., M. Usman, D. Schaumann, N. Chakraborty, G. Berseth, P. Faloutsos, M. Kapadia, et al. 2020. “Gamification of Crowd-Driven Environment Design.” IEEE Computer Graphics and Applications: 1–2. doi:https://doi.org/10.1109/MCG.2020.2965069.
- Heydarian, A., E. Pantazis, A. Wang, D. Gerber, and B. Becerik-Gerber. 2017 September. “Towards User Centered Building Design: Identifying End-user Lighting Preferences via Immersive Virtual Environments.” Automation in Construction 81: 56–66. doi:https://doi.org/10.1016/j.autcon.2017.05.003.
- Hofacker, C. F., K. De Ruyter, N. H. Lurie, P. Manchanda, and J. Donaldson. 2016. “Gamification and Mobile Marketing Effectiveness.” Journal of Interactive Marketing 34: 25–36. doi:https://doi.org/10.1016/j.intmar.2016.03.001.
- Huotari, K., and J. Hamari. 2012. “Defining Gamification: A Service Marketing Perspective.” In Proceeding of the 16th international academic MindTrek conference, 17–22. Tampere, Finland.
- Iversen, A., N. Roy, M. Hvass, M. Jørgensen, J. Christoffersen, W. Osterhaus, and K. Johnsen. 2013. SBI 2013:26 – Daylight Calculations in Practice: An Investigation of the Ability of Nine Daylight Simulation Programs to Calculate the Daylight Factor in Five Typical Rooms. Copenhagen, Denmark: Statens Byggeforskningsinstitut. https://books.google.co.jp/books?id=S2eqoAEACAAJ
- Jones, N. L., and C. F. Reinhart. 2017. “Speedup Potential of Climate-based Daylight Modelling on GPUs.” In Building Simulation Conference, 1438–1447. San Francisco.
- Kacel, S., and B. Lau. 2013. “Investigation of the Luminous Environment in Louis I. Kahn’s Kimbell Art Museum.” In Proceedings of the Passive and Low Energy Architecture Conference, 7. Munich, Germany.
- Kaya, S. M., and Y. Afacan. 2018 December. “Effects of Daylight Design Features on Visitors’ Satisfaction of Museums.” Indoor and Built Environment 27 (10): 1341–1356. doi:https://doi.org/10.1177/1420326X17704028.
- Korn, O., L. Buchweitz, A. Rees, G. Bieber, C. Werner, and K. Hauer. 2019. “Using Augmented Reality and Gamification to Empower Rehabilitation Activities and Elderly Persons. A Study Applying Design Thinking.” In Advances in Artificial Intelligence, Software and Systems Engineering, edited by T. Z. Ahram, 219–229. Vol. 787. Cham: Springer International Publishing.
- Kumaragurubaran, V., and M. Inanici. 2013. “Hdrscope: High Dynamic Range Image Processing Toolkit for Lighting Simulations and Analysis.” Proceedings of the 13th Conference of International Building Performance Simulation Association, Chambéry, France, August 26–28.
- Labayrade, R., H. W. Jensen, and C. Jensen. 2009. “Validation of Velux Daylight Visualizer 2 against CIE 171: 2006 Test Cases.” In Proceedings of 11th International IBPSA Conference, International Building Performance Simulation Association, 1506–1513. Glasgow, Scotland.
- Langbehn, E., P. Lubos, and F. Steinicke. 2018. “Evaluation of Locomotion Techniques for Room-Scale VR: Joystick, Teleportation, and Redirected Walking.” Proceedings of the ACM Virtual Reality International Conference, Tokyo, Japan. doi:https://doi.org/10.1145/3234253.3234291.
- Larson, G. W., H. Rushmeier, and C. Piatko. 1997 October. “A Visibility Matching Tone Reproduction Operator for High Dynamic Range Scenes.” IEEE Transactions on Visualization and Computer Graphics 3 (4): 291–306. doi:https://doi.org/10.1109/2945.646233.
- “Louis I. Kahn Building | Kimbell Art Museum.” Accessed 19 May 2020. https://www.kimbellart.org/art-architecture/architecture/kahn-building
- Marty, C., M. Fontoynont, J. Christoffersen, M.-C. Dubois, J. Wienold, W. Osterhaus, E. Carco, and R. F. Carco. 2003. “User Assessment of Visual Comfort: Review of Existing Methods.” ECCO-build Project.
- Nabil, A., and J. Mardaljevic. 2005 March. “Useful Daylight Illuminance: A New Paradigm for Assessing Daylight in Buildings.” Lighting Research & Technology 379 (1): 41–57. doi:https://doi.org/10.1191/1365782805li128oa.
- Nah, F. F.-H., Q. Zeng, V. R. Telaprolu, A. P. Ayyappa, and B. Eschenbrenner. 2014. “Gamification of Education: A Review of Literature.” In International Conference on HCI in Business, 401–409. Heraklion, Crete, Greece.
- Natephra, W., A. Motamedi, T. Fukuda, and N. Yabuki. 2017 October. “Integrating Building Information Modeling and Virtual Reality Development Engines for Building Indoor Lighting Design.” Visualization in Engineering 5 (1): 19. doi:https://doi.org/10.1186/s40327-017-0058-x.
- Nikon. 2019. “Learning How to Use Your Camera’s Histogram from Nikon.” Nikon USA. Retrieved August 2, 2020, https://www.nikonusa.com/en/learn-and-explore/a/tips-and-techniques/learning-how-to-use-your-cameras-histogram.html
- “NVIDIA Ansel.” 2017 February. 14. NVIDIA Developer. Accessed 5 September 2019. https://developer.nvidia.com/Ansel
- Othman, A. R., and M. A. M. Mazli. 2012 December. “Influences of Daylighting Towards Readers’ Satisfaction at Raja Tun Uda Public Library, Shah Alam.” Procedia - Social and Behavioral Sciences 68: 244–257. doi:https://doi.org/10.1016/j.sbspro.2012.12.224.
- Pelling, N. 2011. “The (Short) Prehistory of ‘Gamification.’” Funding Startups (& Other Impossibilities). Accessed 26 June 2014. https://nanodome.wordpress.com/2011/08/09/the-short-prehistory-of-gamification/
- Pierce, G. 1998. “Natural Lighting at the Kimbell Museum.” In Proceedings of the 86th ACSA Annual Meeting and Technology Conference, 5. Washington, USA.
- Preetham, A. J., P. Shirley, and B. Smits. 1999. “A Practical Analytic Model for Daylight.” In Proceedings of the 26th annual conference on Computer graphics and interactive techniques, 91–100. Los Angeles, CA, USA.
- Raymer, R. 2011. “Gamification: Using Game Mechanics to Enhance eLearning.” ELearn 2011 (9): 3. doi:https://doi.org/10.1145/2025356.2031772.
- Rockcastle, S., K. Chamilothori, and M. Andersen. 2017. “An Experiment in Virtual Reality to Measure Daylight-Driven Interest in Rendered Architectural Scenes.” Proceedings of Building Simulation 2017, San Francisco, California, USA, August 7–9, 2017.
- Rockcastle, S., and M. Andersen. 2015. “Human Perceptions of Daylight Composition in Architecture: A Preliminary Study to Compare Quantitative Contrast Measures with Subjective User Assessments in HDR Renderings.” Proceedings of BS2015: 14th Conference of International Building Performance Simulation Association, Hyderabad, India, December 7–9, 2015.
- Roginska-Niesluchowska, D. M. 2016. “The Creative and Symbolic Functions of Daylight in the Art Museum Buildings of the 21st Century.” 2016 3rd International Multidisciplinary Scientific Conference on Social Sciences and Arts, Vienna, Austria.
- Schnabel, M. A., S. Lo, and S. Aydin. 2014. “Gamification and Rule Based Design Strategies in Architecture Education.” Presented at the DesignED Asia Conference, Hong Kong. doi:https://doi.org/10.13140/2.1.5150.3689.
- Tahrani, S., J. Jallouli, G. Moreau, and P. Woloszyn. 2005. “Towards a Virtual Reality Tool for Lighting.” Proceedings of the 11th International CAAD Futures Conference, Vienna University of Technology, Vienna, Austria, June 20–22, 2005.
- Torres, S., and V. R. M. L. Verso. 2015 November. “Comparative Analysis of Simplified Daylight Glare Methods and Proposal of a New Method Based on the Cylindrical Illuminance.” Energy Procedia 78: 699–704. doi:https://doi.org/10.1016/j.egypro.2015.11.074.
- Van Den Wymelenberg, K., and M. Inanici. 2014 July. “A Critical Investigation of Common Lighting Design Metrics for Predicting Human Visual Comfort in Offices with Daylight.” LEUKOS 10 (3): 145–164. doi:https://doi.org/10.1080/15502724.2014.881720.
- Van Den Wymelenberg, K., M. Inanici, and P. Johnson. 2010. “The Effect of Luminance Distribution Patterns on Occupant Preference in a Daylit Office Environment.” Leukos 7 (2): 103–122. doi:https://doi.org/10.1582/LEUKOS.2010.07.02003.
- Varzgani, A. M. 2015. Importance of Daylight in Art Galleries. London: AA School of Architecture.
- Ward, G., and R. Shakespeare. 1998. Rendering with Radiance: The Art and Science of Lighting Visualization. Charleston, SC, USA: Booksurge llc.