
ABSTRACT
The buildings’ indoor condition called “indoor environmental quality (IEQ)” has become a major goal, all IEQ elements must be maintained within a certain range for the comfort and health of the occupants. To achieve this goal, the previous studies focused on building occupants’ responses based on their activities and the changes in IEQ. Few studies, however, have comprehensively analyzed the above and reflected it in building design and operation. The study of this concept can be expressed as “human-building interaction management.” This approach is a paradigm for the healthy, sustainable, and simultaneous management of people, IEQ, and buildings. This study conducted an in-depth literature review on the above-mentioned studies. In addition, it ultimately proposed an intelligent planning unit (IPU), a new approach that can be used as a tool to apply the above human-building interaction concept to the practical design concept focusing on the planning phase. The IPU theory is designed to meet the customer expectations for the various objectives of a complex built environment. Eventually, it is expected that the proposed IPU concept will promote the spread of good health and environment-friendly buildings.
1. Introduction
As people spend more time inside buildings nowadays, comprehensive “indoor environmental quality (IEQ)” conditions have become the main target of many studies. A built environment protects the occupants from rain, snow, and wind, and provides the occupants with comfortable and satisfying thermal conditions, and human-bio-effluents-combined air (Godish Citation2016). This environment includes the elements of air temperature, relative humidity, air movement, ventilation, lighting, noise, etc. All these environmental elements should be maintained within specific ranges for the occupants’ comfort and health. There have been studies that analyzed the relationship between the IEQ conditions and the building occupants. The building occupants always interact with the building and its environment. For example, the building occupants exposed to a certain air temperature show specific responses until they experience “thermal comfort.” These responses can be psychological, physiological, physical, or others (Djongyang, Tchinda, and Njomo Citation2010).
The assessment of the IEQ condition is different even if the people are in the same building with the same environment. Some parameters are used to calculate the building occupants’ responses based on their activities and the IEQ condition changes, such as the predicted mean vote (PMV), predicted percentage of dissatisfied (PPD), and indoor air quality (IAQ) satisfaction by air temperature, relative humidity, or carbon dioxide (CO2) concentration (Wanner et al. Citation1993; Fanger Citation1972; Hong, Kim, and Koo Citation2012). These parameters suggest the same calculated value in the same environment, but if individually analyzed, it may be found that they do not have the same value. The individual difference must be considered, for which reason diverse experiments were conducted and previous relevant studies were reviewed.
Traditional assessments of the values of buildings and real estate were carried out through economic or environmental assessments (Kim, Hong, and Koo Citation2012; Hong et al. Citation2015; Koo, Hong, and Park Citation2016; Koo et al. Citation2016; Jeong et al. Citation2018; Kim et al. Citation2015a, Citation2015b; Koo et al. Citation2017; Jeong et al. Citation2017; Ji et al. Citation2016; Hong et al. Citation2016; Park et al. Citation2016; Kim et al. Citation2016b, Citation2016a; Hong et al. Citation2013). Due to the environmental issues, however, reducing a building’s energy consumption and providing an improved IEQ are the two major issues that building professionals the world over are dealing with (Aglan, Citation2003; Hamilton M, Rackes A, Gurian PL, Waring MS Citation2016; Park and Yoon Citation2011; Varjo et al. Citation2015; Cheong et al. Citation2003; Ravindu et al. Citation2015; Lan et al. Citation2011; Xue, Mak, and Ai Citation2016; Jaggs and Palmer Citation2000; Zhang, Wargocki, and Lian Citation2016; Kajtár and Herczeg Citation2012; Chen and Hsiao Citation2015; Cheng et al. Citation1995; Budd and Warhaft Citation1966; Sun and Zhu Citation2013; Mehler et al. Citation2009; Haapalainen et al. Citation2010; Carayon Citation1993; Fisk and Rosenfeld Citation1997; Worrell et al. Citation2003). First, according to International Energy Outlook 2016, the energy consumed by the building sector in the year 2016 accounted for about 20% of the total delivered energy consumed worldwide (Government Publications Office Citation2016). Second, with regard to improving the energy performance of buildings, there is a growing interest in IEQ because people have been spending more than 90% of their time inside buildings. In particular, thermal comfort, IAQ, and visual comfort are closely related to the building occupants, and each has a significant effect on the building occupants’ health. It is not easy to reduce a building’s energy consumption and provide a better IEQ at the same time. This is because the total building energy consumption tend to increase when efforts are made to maintain an acceptable IEQ level for the building occupants. Although improving the physical characteristics of a building can reduce the building’s energy consumption and improve the IEQ, these two variables vary greatly depending on the behaviors of the building occupants. The behaviors of the building occupants can be attributed to people’s responses to IEQ conditions (Wanner et al. Citation1993; Fanger Citation1972; Hong, Kim, and Koo Citation2012). For example, if the occupants’ psychological response is hot, the behavior triggers the building’s air conditioning system to lower the indoor temperature.
Therefore, the previous studies focusing on people’s responses based on their activities and the changes in the IEQ employed approaches that can be broadly categorized into three types: (i) approach considering the building occupants’ psychological responses; (ii) approach considering the building occupants’ physiological responses; and (iii) approach considering the building occupants’ task performance. For more details, an in-depth literature review was conducted on previous studies that could support this in section 2. Studies dealing with this concept do so in the interest of shedding light on “human-building interaction management” (refer to ).
Figure 1. Graphical abstract of human-building interaction management
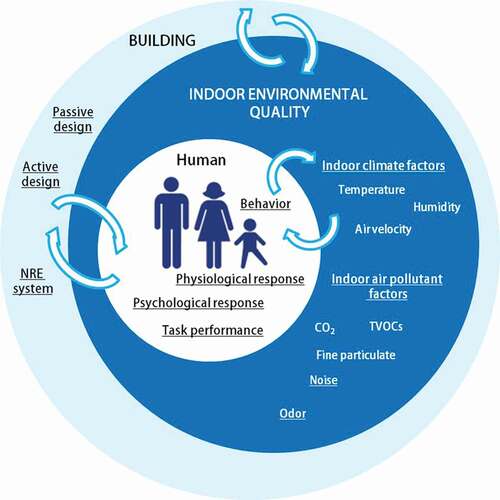
This begins with the recognition of the human-IEQ-building interaction from a real-time perspective and from the perspective of the whole life cycle. This approach is a paradigm for the healthy, sustainable, and simultaneous management of people, IEQ, and buildings. This study conducted an in-depth literature review on the above-mentioned studies (section 2). In addition, it ultimately proposed an intelligent planning unit (IPU), a new approach that can be used as a tool to apply the above human-building interaction concept to the practical design concept focusing on the planning phase (section 3).
2. Building occupants’ responses based on their activities and the changes in the IEQ conditions
To determine the relationship between IEQ and the building occupants, three different approaches relating to human responses were employed for the analysis of the IEQ conditions. Studies aiming to determine the human responses by IEQ condition change had been conducted. Human responses are divided into two types: psychological response and physiological response. In addition, the activities of the building occupants under certain IEQ conditions were verified as the last approach relating to the human response. Therefore, the psychological and physiological responses as well as the building occupants’ activities were generally reviewed.
2.1. Approach considering the building occupants’ psychological responses
The psychological response, a human response, is hard to define precisely. This is because psychological responses can be observed differently for each individual when the physical environment changes. Also, the psychological response of the same person may be different depending on the surrounding environment at the time. Many types of research analyzing psychological responses require a time-consuming process. Diverse indices of psychological responses could be found, however, throughout literature reviews. The studies considering the psychological response are divided into four categories according to their goal (refer to ): (i) those dealing with the indoor air pollutant factors; (ii) those dealing with the indoor climate factors; (iii) those dealing with both indoor factors; and (iv) the activities of the building occupants under a certain IEQ condition.
Table 1. Building occupants’ psychological responses and activities, and IEQ conditions
2.1.1. Building occupants’ psychological responses to indoor air pollutant factors
The building occupants’ IAQ satisfaction was analyzed with the indoor air pollutant factors, mainly the CO2 concentration (Aglan Citation2003; Hamilton et al. Citation2016; Park and Yoon Citation2011; Daisey, Angell, and Apte Citation2003; Kim et al. Citation2016c; Vehviläinen et al. Citation2016). The CO2 concentration is deeply related to ventilation and humans because CO2 is emitted mainly through the subjects’ metabolic processes and equipment use. Aglan (Citation2003) developed and assessed a CO2 concentration prediction model that would improve the building’s IAQ. An appropriate ventilation rate was suggested according to the maximum CO2 concentration by time. Hamilton et al. (Hamilton et al. Citation2016) used ventilation and filtration as analysis elements and analyzed these with their benefit of better IAQ on 112 stakeholders through questionnaire surveys. Majority of the stakeholders expressed dissent with regard to the ventilation and filtration effects and the benefits of better IAQ. They refused to pay for improving the IAQ, showing indifference towards the importance of ventilation. Hedge (Citation1996) announced that because many IAQ hazards cannot be directly measured, the building occupants’ psychological responses play a huge role in avoiding such hazards. The itchiness of the skin and the urge to cough, two sensory processes that influence the perception of the IAQ, cannot be neglected.
Wolkoff and Nielsen (Citation2001) used volatile organic compounds (VOCs) to evaluate the perceived air quality and argued that the classic VOCs defined by the World Health Organization (WHO) are not enough for evaluation purposes, and that a broader analytical window of VOCs should be used. Hummelgaard et al. (Citation2007) recorded the subject building occupants’ responses and the IEQ characteristics in their study to compare five mechanically ventilated and four naturally ventilated office buildings. The results showed that even though the CO2 concentration was fluctuating and was sometimes higher in the naturally ventilated office buildings, the psychological satisfaction of the naturally ventilated office buildings’ occupants was higher than that of the mechanically ventilated office buildings’ occupants. This result signifies the existence of another possible determinant of the building occupants’ IAQ satisfaction.
2.1.2. Building occupants’ psychological responses to indoor climate factors
The building occupants’ thermal comfort was analyzed with the indoor climate factors, mainly based on Fanger’s model (Fanger Citation1972; Varjo et al. Citation2015; Cheong et al. Citation2003; Ravindu et al. Citation2015; Tham Citation2004; Wagner et al. Citation2007; Auliciems and Szokolay Citation1997; Luo et al. Citation2016; Verheyen et al. Citation2011). Fanger’s model uses four indoor climate factors (operative temperature, relative humidity, air velocity, and global temperature) and two personal factors (clothing insulation and metabolic rate) (Auliciems and Szokolay Citation1997; Luo et al. Citation2016) to calculate the PMV and the PPD, which indicate the level of thermal comfort of the building occupants. International standard organizations refer to this PMV-PPD model as the standard (Luo et al. Citation2016; Verheyen et al. Citation2011).
Both ISO 7730 and ASHRAE 55 define the operative temperature range for thermal comfort based on the indoor climate factors that derive the desired level of thermal comfort. In ASHRAE 55, the recommended operative temperature range (the thermal condition considered acceptable by more than 80% of the building occupants) is 18.6–30.2°C for secondary activities (Zhang Citation2015). This recommended range was derived based on the thermal comfort indices (PMV and PPD), as knowledge generalized by Fanger. The PMV-PPD indices, however, were developed through a questionnaire survey on the thermal responses of people who had been acclimatized to the IEQ. This could be accounted for by introducing an expectation index (Fanger and Toftum Citation2002). Various international standards for thermal comfort are suggested, such as ISO 7730 (ISO, EN. Citation7730: 2005), EN 15251 (Olesen Citation2012), ASHRAE 55 (STANDARD, ASHRAE Citation2010), and GB/T 50785 (Luo et al. Citation2016). ASHRAE 55 is utilized as a standard that can measure the thermal sensation of the building occupants by using the PMV-PPD model of thermal comfort based on Fanger’s model in the natural ventilation environmental space. After the selection of the human comfort range for the first time in 1941, ASHRAE revised the comfort range seven times up to ASHRAE 2010. The thermal comfort standard of ASHRAE 55 is divided into PPD 10 and 20%. Accordingly, the presented PMV is ±0.5 and ±0.85 (Luo et al. Citation2016; Zhang Citation2015; De Vecchi et al. Citation2015).
ISO 7730 is utilized as a standard to measure the thermal environment felt by the building occupants in the same way as in ASHRAE. ISO7730 is divided into three categories to estimate the thermal comfort of the building occupants. The PMV standards are presented from a minimum of ±0.2 in category I to a maximum of ±0.7 in category III. Therefore, the comfort operative temperature range from the tolerance standard is presented as 17–31°C (International Organization for Standardization Citation2005).
European-standard EN 15251 presents standards for the thermal environment in a naturally ventilated space. EN 15251 is divided into four categories. Category I has the strictest thermal comfort standards, and accordingly, the operative temperature range is 20.5–31.2°C (Zhang Citation2015; Olesen Citation2012).
Chinese standard GB/T 50785 was released by the Ministry of Housing and Urban-Rural Development in May 2012. GB/T 50785 consists of three categories on the thermal comfort of building occupants. Category I presents standards on the building occupants’ 90% satisfaction level. Category II provides standards on the building occupants’ 75% satisfaction level. Finally, category III provides standards that are unacceptable by the building occupants (Zhang Citation2015; Li et al. Citation2014).
The questionnaire survey is the most traditional and formal way to determine the level of thermal comfort of building occupants under extensive indoor climate and personal factors. Cheong et al. (ISO, EN. Citation7730: 2005) conducted a questionnaire survey on 189 subjects, measuring their thermal comfort level in an air-conditioned lecture room. According to the questionnaire survey results, the experiment subjects appraised the PMV as −0.93 and the PPD as 20.6%, meaning one out of five subjects felt unpleasant and slightly cool under the relevant environment. The study recommended that the indoor air temperature be raised to about 26°C for the occupants’ thermal comfort. Ning et al. (Citation2016) employed a similar approach, analyzing climate change with the indoor climate factors and the thermal comfort level of the building occupants in China. Similar to other studies, it conducted a questionnaire survey on the thermal comfort level of the experiment subjects from autumn to spring. The PMV and the mean thermal sensation vote (TSV) were compared, and it was found that the calculated PMV was lower than the actual thermal comfort of the experiment subjects. This result signified the existence of other possible determinants of the thermal comfort level of building occupants.
2.1.3. Building occupants’ psychological responses to both indoor factors
Both psychological responses of IAQ satisfaction and thermal comfort of building occupants were analyzed with the IEQ conditions (Lan et al. Citation2011; Xue, Mak, and Ai Citation2016; Jaggs and Palmer Citation2000; Reynolds et al. Citation2001; Ivanov Citation2016; Tanabe et al. Citation2013; Buratti and Ricciardi Citation2009; Kotopouleas and Nikolopoulou Citation2016; Maula et al. Citation2016; Sicurella and Colamesta Citation2015). The indoor air pollutant factors, indoor climate factors, and other possible factors, such as the acoustics and lighting, were considered. There have been some studies that analyzed diverse psychological responses to the IEQ conditions. Xue, Mak, and Ai (Citation2016) used a questionnaire survey to determine the overall environmental satisfaction of about 480 residents of high-rise residential buildings with the IEQ conditions in their respective buildings. Reynolds et al. (Citation2001) concentrated on various other IEQ parameters – indoor pollutant factors (CO2 concentration, acetaldehyde, VOCs, and formaldehyde), indoor climate factors (operative temperature and relative humidity), lighting, and noise – in six large office buildings. The noticeable results were that the IEQ parameters were correlated with one another and all the parameters were related to the building occupants’ psychological responses. Ivanov (Citation2016) surveyed untrained and unprepared occupants of a small lecture room and analyzed both the IAQ and the thermal comfort, but he obtained uncertain results due to the low questionnaire response rate. There have been few studies that simply combined the building occupants’ psychological responses to the indoor air pollutants and indoor climate factors. Heinzerling et al. (Citation2013) conducted a literature review on the weighting and classification of IEQ and found that it is difficult to integrate the results of their review due to the absence of specific relevant standards or criteria. Moschandreas and Sofuoglu (Citation2004) calculated the indoor environmental index of both indoor discomfort and indoor air pollution using the rank correlation coefficient, but they considered only the building occupants’ psychological responses to the building temperature and humidity, and numerically compared the indoor air pollutant factors to the demarcation of each pollutant variable.
2.1.4. Building occupants’ psychological responses to their own activities
Finally, the building occupants’ psychological responses differed by building occupant activity even under the same IEQ condition (Auliciems and Szokolay Citation1997; Luo et al. Citation2016; Yun et al. Citation2014; Zomorodian, Tahsildoost, and Hafezi Citation2016). Few studies have dealt with this complicated subject in an in-depth way. Luo et al. (Citation2016) found different TSVs on the same IEQ condition. The only difference was that the building occupants with better TSV results were informed that they could control the indoor air temperature when such temperature in fact did not really change at all. The experiment result that the building occupants’ psychological responses changed without a change in the actual IEQ condition and with only the possibility of the building occupants’ control of such condition is crucial. The building occupants’ belief that they can change the IEQ condition to a suitable one can affect their psychological responses.
2.2. Approach considering the building occupants’ physiological responses
If there are psychological responses of occupants, there should be occupants’ physiological responses based on their activities and IEQ condition too. The physical status (e.g., physical health) can be analyzed based on the physiological responses. Recent technological advances enabled the measurement of the real-time monitoring data on physiological responses. As the physiological responses to the IEQ condition can indicate the maintenance of homeostasis against external stimuli, in this study, such responses were used as the occupant health index (Zhang, Wargocki, and Lian Citation2016; Kajtár and Herczeg Citation2012; Chen and Hsiao Citation2015; Cheng et al. Citation1995; Budd and Warhaft Citation1966; Sun and Zhu Citation2013). The previous studies that used building occupants’ physiological responses were also divided into three categories: (i) those that dealt with building occupants’ physiological responses to the indoor air pollutant factors; (ii) those that dealt with building occupants’ physiological responses to the indoor climate factors; and (iii) those that dealt with building occupants’ physiological responses to their own activities (refer to ). It was hard to find studies that dealt with both indoor factors combined.
Table 2. Building occupants’ physiological responses and activities, and IEQ condition
2.2.1. Building occupants’ physiological responses to the indoor air pollutant factors
The building occupants’ physiological responses to the indoor air pollutant factors were analyzed. As mentioned earlier, the CO2 concentration was mainly used as an indoor air pollutant factor. Diverse physiological responses like the blood pressure, heart rate, and respiratory rate were used for the analysis, along with the indoor CO2 concentration change. Zhang, Wargocki, and Lian (Citation2016) found end-tidal CO2 increase by a high CO2 concentration in a climate chamber. Kajtár and Herczeg (Citation2012) found that the diastolic blood pressure and heart rate was increased by a high (near 300 ppm) CO2 concentration.
Chen and Hsiao (Citation2015) found that the increase in CO2 concentration led to respiratory change and increased the respiration rate and body temperature. Apte, Fisk, and Daisey (Citation2000) announced that the increase in CO2 concentration also increased their study subjects’ respiration and metabolism. Vehviläinen et al. (Citation2016) measured and analyzed the autonomic nervous system functions, salivary stress hormones, skin temperature, and other CO2-related respiratory results vis-à-vis the indoor CO2 concentration. A high CO2 concentration resulted in a higher CO2 concentration in the tissues as well as increased heart rate variation and peripheral blood circulation. Zhang, Wargocki, and Lian (Citation2017) analyzed both the CO2 concentration and bio-effluents with physiological responses such as the heart rate, blood pressure, end-tidal CO2, and oxygen saturation of the blood. The CO2 concentration ranged from 1000 to 3000 ppm, and the study results showed that the heart rate decrement by time decreased. Also, the diastolic blood pressure and salivary α-amylase increased significantly. In addition, increased particulate matter (PM2.5) increased the blood pressure and inflammation (Brook et al. Citation2010). Linn et al. (Citation1999) measured the systolic and diastolic blood pressures of 30 subjects with severe chronic obstructive lung disease. Both blood pressures were found not related to the PM levels, but other studies obtained opposite results. Zanobetti et al. (Citation2004) confirmed diastolic and systolic blood pressures and heart rate increments by PM2.5 level increment. Choi et al. (Citation2007) also found that the systolic and diastolic blood pressures increased with high PM10 levels. Caruana-Montaldo, Gleeson, and Zwillich (Citation2000) likewise found that an increased indoor CO2 concentration could lead to respiration rate, body temperature, and metabolism increase.
2.2.2. Building occupants’ physiological responses to the indoor climate factors
The building occupants’ physiological responses to the indoor climate factors were also analyzed. Cheng et al. (Citation1995) investigated if the mean skin temperature and core temperature had a linear relationship with each other, causing shivering in a cold environment, and found affirmative results. Budd and Warhaft (Citation1966), Sun and Zhu (Citation2013), and Mäkinen et al. (Citation2006) analyzed the changes in the blood pressure with thermal change and found that operative temperature increase leads to blood pressure decrease. Toftum, Jørgensen, and Fanger (Citation1998) observed the increase in skin humidity due to the increase of the operative temperature and suggested the new skin humidity model for sedentary, thermal-neutral persons. Tham and Willem (Citation2010) conducted an experiment with 96 young adults to analyze the room air temperature and the subjects’ mental alertness through their physiological responses, and found an increase in α amylase at the moderately cold temperature of 20°C, inducing nervous system activation. Wyndham et al. (Citation1964) investigated the gender difference in the physiological response of sweat over skin under thermal change, and the study results showed that the female subjects produced less sweat than the male subjects did. Höppe et al. (Citation2000) researched on the relationship between clothing and the human response of skin humidity, and concluded that increased temperature leads to the increment of skin humidity. Frank et al. (Citation1999) observed that the body core and skin surface temperatures are critically affected by core cooling; that is, both temperatures decrease with core cooling. Collins et al. (Citation1985) also analyzed the mean deep body temperature and systolic and diastolic blood pressures when the study subjects were exposed to 6°C air, and the study results showed a body temperature decrease and a blood pressure increase.
2.2.3. Building occupants’ physiological responses to their own activities
Unlike the building occupants’ psychological responses, there is a term for the building occupants’ activities that affect their own physiological responses. Office work or the stress accompanying work causes work stress on the part of the building occupants. Work stress was analyzed with the physiological responses in other previous studies, as activities of the building occupants. The types of stress of the building occupants are diverse, but in an office building, job stress, work stress, office work, and cognitive tasks can be defined (Mehler et al. Citation2009; Haapalainen et al. Citation2010; Carayon Citation1993). Under the same IEQ conditions, the physiological response can change due to stress that affects the autonomic nervous system, and the excitement of the sympathetic nervous system causes various cardiovascular responses, which are related to physiological responses (Callister, Suwarno, and Seals Citation1992; Heidbreder et al. Citation1982). Ettema and Zielhuis (Citation1971) and Fredericks et al. (Citation2005) studied the heart rate and the blood pressure (which is related to cardiovascular responses) under a mental workload. The experiments revealed that the mental workload increases the heart rate and blood pressure. Lenneman, Shelley, and Backs (Citation2005) and Thackray and Pearson (Citation1968) also reported that in their study, the subjects’ heart rate was increased by the subjects’ stresses. Mehler et al. (Citation2009) discovered an increased heart rate and increased skin conductivity by office workload. Phillips et al. (Citation2006) and Zeier, Brauchli, and Joller-Jemelka (Citation1996) used salivary secretory immunoglobulin A (sIgA), an indicator of the status of the immune system, as the main physiological response under high stress conditions. As a result, the highly negative stress decreased the sIgA, meaning there was a diminution of the immune system’s performance. Vrijkotte, Van Doornen, and De Geus (Citation2000) announced the risk of developing cardiovascular disease from work stress, and monitored the ambulatory blood pressure, heart rate, and heart rate variability to analyze the results of a diverse combination of high and low work stress. The study results showed that work stress is mediated by systolic blood pressure increase.
2.3. Approach considering the building occupants’ task performance
As in this approach, the psychological and physiological responses of the building occupants to the IEQ condition and their own activities are analyzed, the IEQ condition and the occupants’ task performance should also be analyzed. In this study, the activities of office occupants were measured by task performance. The change in the task performance with IEQ condition change was analyzed. The indoor air pollutant and indoor climate factors are the two IEQ conditions that were studied (refer to ).
Table 3. Building occupants’ task performance to IEQ condition
2.3.1. Building occupants’ task performance to the indoor air pollutant factors
According to the previous relevant studies, the indoor air pollutant factors are related to human health, especially to infection, allergies, and other complex symptoms, like those falling under the so-called “sick building syndrome,” and chemical and microbiological indoor air pollution lead to loss of productivity (Fisk and Rosenfeld Citation1997; Worrell et al. Citation2003).
As mentioned earlier, the CO2 concentration is related to the ventilation rate and is one of the common research subjects on the indoor air pollutant factors. The previous relevant studies verified that the CO2 concentration is closely related to the building occupants’ task performance (Bako-Biro et al. Citation2002; Fromme et al. Citation2007; Lagercrantz and Sundell Citation2000; Lee et al. Citation2012; Higgins et al. Citation2005; Mendell et al. Citation2016; Myhrvold, Olsen, and Lauridsen Citation1996; Nordström, Norbäck, and Akselsson Citation1994; Persily Citation2015; Satish et al. Citation2012; Seppänen and Fisk Citation2004; Wargocki et al. Citation2002; Wargocki and Wyon Citation2007; Wargocki, Wyon, and Fanger Citation2000; Wargocki et al. Citation1999). Myhrvold, Olsen, and Lauridsen (Citation1996) analyzed the occupants’ cognitive abilities and the average CO2 concentration in 22 classrooms. In the experiment, a concentration test and a self-questionnaire survey were used to determine the status of the subjects, and the reaction time with the PC for 30 minutes was measured. The results showed that the concentration of the pupils decreased with a higher CO2 concentration. Bakó-Biró et al. (Citation2012) analyzed ventilation and the building occupants’ task performance. Two hundred subjects in two classrooms participated in the test, and their cognitive performance was measured with nine tests administered by computer software. With outdoor air ventilation, the subjects’ cognitive ability or short-term memory statistically increased. Shendell et al. (Citation2003) analyzed the attendance of different pupils by the indoor and outdoor CO2 concentrations in 22 schools, and the results showed that when the CO2 concentration exceeded 1000 ppm, the average pupil attendance was reduced by 0.5–0.9%. Other air pollutant factors also affect the building occupants’ task performance and cognitive abilities. Gatto et al. (Citation2014) analyzed the ozone, PM2.5, and NO2 concentrations and the building occupants’ cognitive abilities. Their experiment with almost 1,500 adults showed that increasing exposure to PM2.5 led to lower verbal learning. Clements-Croome et al. (Citation2008) did not aim at specific air pollutant factors but physically measured the CO2 concentration and VOCs; instead, they investigated the ventilation rate in the classrooms vis-à-vis the pupils’ cognitive performance.
2.3.2. Building occupants’ task performance to the indoor climate factors
There is yet no definite, clear mechanism of how the indoor climate factors affect the activities of the building occupants as well as their task performance (Willem Citation2006). Researchers have found, however, that the cognitive processing of IEQ changes causes various combinations of human physical, psychological, and physiological responses (Chamberlain and Jordan Citation2012; Kim and Paulos Citation2010), but the result arrived at by other studies is clear: the indoor climate factors of indoor temperature and relative humidity affect the task performance of the building occupants (Akimoto et al. Citation2010; Azarbayjani, Brentrup, and Cox Citation2014; Hunn and Bochat Citation2015; Mak and Lui Citation2012; Niemelä et al. Citation2002; Roelofsen Citation2002; Schellen et al. Citation2010; Wiik Citation2011). In addition, the indoor temperature has been known to greatly affect human thermal comfort and productivity (Wyon Citation2004). In a cold indoor environment, a negative effect on the building occupants’ task performance was observed (Lan et al. Citation2011; Hummelgaard et al. Citation2007; Bakó-Biró et al. Citation2012; Kosonen and Tan Citation2004; Pilcher, Nadler, and Busch Citation2002; Fang et al. Citation2004). Fang et al. (Citation2004) analyzed the indoor temperature and relative humidity vis-à-vis the building occupants’ task performance; the study subjects showed the best problem-solving abilities in a slightly cool temperature. In other studies, at a 22°C indoor temperature, the building occupants showed the best productivity. As the operative temperature increased, the productivity decreased (Seppanen, Fisk, and Lei Citation2006a). Zhang et al. (Citation2010) used their own thermal comfort model and task-ambient condition system and checked the thermal comfort, perceived air quality, and task performance of the building occupants through 90 tests. The building occupants performed better in Sudoku and math with the task-ambient condition system compared to the neutral condition. Math was performed better in cool conditions while Sudoku was performed better in warm conditions. Seppanen, Fisk, and Lei (Citation2006b) analyzed office-type tasks like text processing, simple calculations, telephone customer service, and similar other works vis-à-vis the room temperature. The task performance decreased when the room temperature was 30°C. Cui et al. (Citation2013) found that the slightly cool to neutral temperatures of 22–26°C were optimal for learning performance.
3. IPU for the artificial intelligent based built environment considering the impact of the indoor air pollutants and indoor climate factors
The building is one of the main agents controlling the indoor environment. To control the IEQ condition, modern office buildings use diverse equipment and systems. From air-conditioning to ventilation, a building consumes a considerable amount of energy to maintain the best IEQ condition, which means that energy consumption can be used as an index of the building status. In this study, both the indoor air pollutant and indoor climate factors were analyzed along with building energy consumption. IPU, a new approach that can be used as a tool to apply the above human-building interaction concept to the practical design concept focusing on the planning phase, was proposed (Hastak and Koo Citation2016a). The theory of an IPU is designed to (1) enable the complex built environment system to be more intelligent; (2) standardize the complex physical entities and processes at a modular scale; (3) accumulate the knowledge at different levels of complexity for IPU refinement and control; and (4) provide the decision-makers with timely and accurate information for better decision-making (Hastak and Koo Citation2016b). The presented IPU case scenarios illustrate the IPU strategy, design, replication, combination, interaction, and refinement aspects with different levels of complexity in the built environment.
3.1. IPU considering the indoor air pollutant factors and energy consumption
As mentioned earlier, IAQ is affected by indoor air pollutants like the CO2 concentration. Other indoor air pollutants include VOCs and fine particulate, which are notable pollutants (refer to ). The indoor air pollutant factors are related to the ventilation performance. To maintain an acceptable condition for almost 90% of the building occupants, the CO2 concentration should be maintained at around 1000 ppm (Mui and Wong Citation2007). Fine particulate (including PM10 and PM2.5) and VOCs can also be used as substitutional indicators of the required ventilation for an acceptable IAQ (Rea Citation2000; Chung and Burnett Citation1996; Mui and Wong Citation2006; Ayr et al. Citation2003; Wong and Mui Citation2009). The main building energy that was used in this study for analysis with the indoor air pollutant factors was thermal energy consumption. Takeda et al. (Takeda et al. Citation2004) compared and developed a ventilation system with a phase change material utilizing thermal energy storage, and concluded that the cooling load could also be reduced by the ventilation system.
Table 4. IPU for the built environment and IEQ condition
A previous research concluded that the CO2 concentration as well as the thermal energy consumption, which is mainly related to the CO2 concentration, affects the ventilation in air-conditioned offices (Mui and Wong Citation2007). When the indoor CO2 concentration increased from 1,000 to 1,200 ppm, 30% thermal energy reduction was estimated for the air-conditioned office buildings, but the occupant acceptability decreased. Rijal et al. (Rijal et al. Citation2007) used field surveys to predict the thermal comfort and energy use with the opened window. The results showed that the number of opened windows determines the levels of indoor air pollutant factors. Also, a decrease in CO2 concentration led to a 50% increase in additional thermal energy (Mui, Wong, and Law Citation2007). Hien et al. (Citation2005) simulated both the single- and double-glazed façade and concluded that to minimize the building energy consumption, the double-glazed façade with natural ventilation was the best option for use. Simonson (Citation2005) simply simulated the energy consumption in a cold area when the windows are closed and found almost 30% energy savings compared to the energy consumed by typical houses.
3.2. IPU considering the indoor climate factors and energy consumption
As mentioned earlier, the thermal comfort can be calculated as PMV by indoor climate factors like the indoor temperature and humidity (refer to ). Maintaining the indoor climate factors is fundamental to air-conditioned office buildings. The specific indoor climate factors that increase the building occupants’ thermal comfort are different in many literature reviews, and they also affect the building energy consumption. For thermal comfort, Brager and De Dear (Citation1998) reported that the distinction between the thermal-comfort responses in air-conditioned vs. naturally ventilated buildings most likely results from a combination of the past thermal history of the buildings and the differences in the levels of perceived control. They reported that even though air-conditioned offices were exposed to the “recommended acceptable state,” thermal discomfort was reported (De Dear and Brager Citation1998). For energy consumption, Imanari, Omori, and Bogaki (Citation1999) compared the thermal comfort, energy consumption, and cost of the ceiling panel system and the conventional air-conditioning system. Through questionnaire surveys, a simulation was conducted, and a 10% energy consumption reduction was found. Yang, Yan, and Lam (Citation2014) reviewed the thermal comfort and building energy consumption and concluded that a higher or wider indoor temperature range leads to a lower cooling load and energy consumption, but further research for the social norm should be considered. Similarly, just by increasing the indoor air temperature set point by 1°C, nearly 4% annual thermal energy savings can be achieved (Lam, Hui, and Chan Citation1997). If the thermal comfort is considered, to achieve the thermal comfort of the building occupants, nearly 40% of the overall building thermal energy is used by the heat gains through the building envelope (Chow and Wong Citation1998).
3.3. IPU for the artificial intelligent based built environment
The level and scale of the IPU are configured as shown in . As the IPU’s scale becomes smaller, the IPU’s number increases. The IPUs of the corresponding scale from nanoparticles to component, space, and global scale are accumulated to form the next-scale IPU.
Figure 2. Scale and number of IPUs
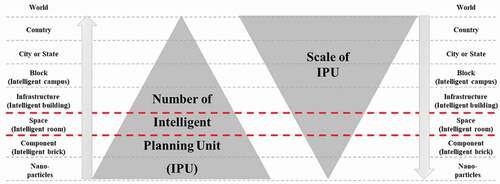
By monitoring, diagnosing, and retrofitting buildings from the perspective of the full building life cycle, the previous studies aimed to achieve the construction of green buildings. There were clear differences, however, between the predicted and actual building performances in terms of energy and IEQ. The main reason for such difference is the “human factor”: how the building occupants psychologically and physiologically respond to and operate the building. Each scale of IPU can consider the “human factor” based on the real-time data acquired from three crucial factors: human health, IEQ, and building energy. These can be referred to as requirement-key performance indicators, and the IPU can be finally designed considering the cost, environment, and energy as the target key performance indicators.
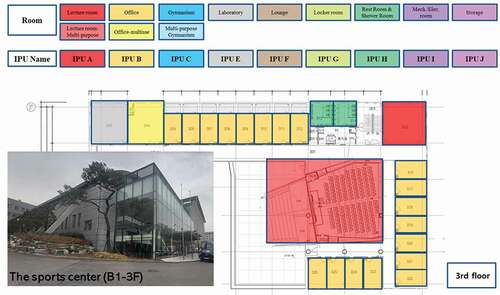
The IPU can be used as a general tool to apply the above human-building interaction concept to the practical building design. Based on the issues covered in section 2 and section 3, the factors affecting building occupants can be applied to the requirement-key performance indicators in the IPU process. The requirement-key performance indicators can be established according to each project such as indoor air pollutant, indoor climate and occupants’ activities. To show a design example through the IPU, a four-story building was selected as the target facility, and the detailed description is as follows. In the process of constructing a four-story sports center including one basement, the third-floor room is designed as follows. The rooms consist of a lecture room, an office, a gymnasium, etc. Each room can be designed according to the requirement-key performance indicators. In the case of designing according to the indoor air pollutants, indoor climate factors, and building occupants’ task performance, among the various requirement-key performance indicators, IPU can be named as shown in .
Figure 3. Designing a sports center based on IPU
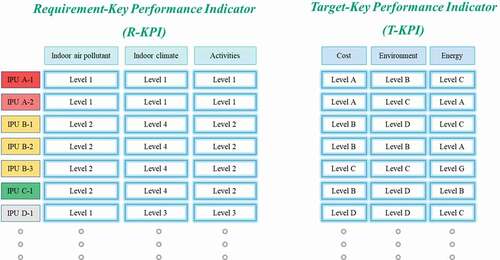
The named IPU can be designed with cost, environment, and energy as the target key performance indicators according to the level of the requirement-key performance indicator defined above (refer to ). The final decision-maker can select the final IPU scenario based on the requirement-key performance indicator and the target-key performance indicator. This choice of room-level IPUs can lead to the cumulative total building design. That is, it can be applied to all scales of built environments. For the future research, it is necessary to deal with human health based on the IPU.
Figure 4. IPU case scenarios
Quantification of environmental quality and development of an environment-combined index: In the previous studies, the IEQ score can estimate the IEQ based on the building characteristics and human behavior (Kim et al. Citation2017a, Citation2017b, Citation2018; Hong, Kim, and Lee Citation2018). To minimize the generation of environmental pollutants, eco-friendly building materials and construction processes can be evaluated to reduce the emission of harmful substances. To demonstrate this process, quantitative indicators can be developed through indoor and outdoor environmental conditions by monitoring them with an embedded sensing technology (i.e., Internet of Things, IoT) from the unit building to the urban scale.
Quantification of human health and development of a health-combined index: The combined index described in the previous section can reduce the emission of hazardous substances in the construction phase as well as in the building operation phase. In particular, it is expected to reduce the respiratory diseases of both the laborers and the building occupants. In the previous studies, experimental research was conducted to estimate the building occupants’ psychological and physiological responses based on their activities and the IEQ condition. To extend this process, psychological and physiological analyses will be conducted for the residents and construction laborers, using a smart sensing technology (i.e., vitro diagnostic device) (Kim et al. Citation2017a, Citation2018; Hong, Kim, and Lee Citation2018).
Development of a building and construction process management system with a human-environment-building interaction concept: The research methodology called “integrated multi-objective optimization model” can be used to determine optimal strategies for low energy and acceptable IEQ conditions (Kim et al. Citation2017b). Through the environment combined index and health combined index, a building and construction process management system can be developed for a healthy and sustainable building and city.
Eventually, it is expected that the proposed IPU concept will promote the spread of good health and environment-friendly buildings.
4. Conclusion
The human-indoor environmental quality (IEQ)-building interaction concept can be used by building managers and occupants in enhancing the IEQ and energy performance of buildings in short- and long-term building management. In the future research, the intelligent planning unit (IPU) can assess the psychological and physiological responses and activities of the building occupants more accurately and comprehensively, and is thus expected to be useful for quantifying the IEQ of buildings. It is also expected to contribute to the improvement of the IEQ of buildings in the building industry. Moreover, it can assess the effects of IEQ in terms of the building occupants’ behavior and the characteristics of buildings, and can thus serve as a guideline for enhancing the IEQ of buildings. Furthermore, it can represent the various IEQ parameters as a simple single index. It is expected to be able to stimulate the building occupants’ and owners’ interest in healthy and environment-friendly buildings, and to enable the decision-makers (the building owners, building occupants, and architects) to accurately and simultaneously estimate the energy savings amount, IEQ improvement, and cost savings amount by building design element, and to understand the value of good health and environment-friendly buildings.
Acknowledgments
The present research has been conducted by the Research Grant of Seoul National University of Science and Technology in 2020.
Disclosure statement
No potential conflict of interest was reported by the authors.
Additional information
Funding
Notes on contributors
Jimin Kim
Dr. Jimin Kim is an Assistant Professor of Architectural Engineering Program in the School of Architecture at Seoul National University of Science & Technology. Dr. Kim's current research topics include healthy and sustainable construction engineering and management, and decision support system, focusing on the human-environment-building interaction management system. Dr. Kim focused on the top-down management approaches to energy-economy field and bottom-up management approaches to human-oriented-energy and environment management in the field of construction and real estate.
Taehoon Hong
Dr. Taehoon Hong is an Underwood Distinguished Professor of the Department of Architecture and Architectural Engineering at Yonsei University. He is the Associate Editor of Renewable & Sustainable Energy Reviews, Elsevier, and Journal of Management in Engineering, ASCE. He is an editorial board member of Applied Energy, Elsevier as well as Energy and Buildings, Elsevier. He is also an Associate Editor of Sustainable Design and Construction, Frontiers in Built Environment. Dr. Hong’s current research topics include renewable energy system, energy performance, solar photovoltaic system, indoor environmental quality, and sustainable building.
Makarand Hastak
Dr. Makarand Hastak is the Professor and Head of the Division of Construction Engineering and Management as well as Professor of Civil Engineering at Purdue University. He has been involved with the construction industry for the past 30 years where he has conducted research, taught, and assisted industry in the area of construction engineering and management including process improvement, disaster risk reduction, infrastructure management, cost control, project management decision-making, risk management, and strategic planning.
Kwangbok Jeong
Dr. Kwangbok Jeong is an Assistant Professor of the Department of Architectural Engineering at Sejong University in Seoul, Republic of Korea. Dr. Jeong’s current research topics include sustainable construction engineering and management, sustainable building, artificial intelligence, and decision support system.
References
- Aglan, H. A. 2003. “Predictive Model for CO2 Generation and Decay in Building Envelopes.” Journal of Applied Physics 93 (2): 1287–1290. doi:https://doi.org/10.1063/1.1529992.
- Akimoto, T., S. I. Tanabe, T. Yanai, and M. Sasaki. 2010. “Thermal Comfort and Productivity-Evaluation of Workplace Environment in a Task Conditioned Office.” Building and Environment 45 (1): 45–50. doi:https://doi.org/10.1016/j.buildenv.2009.06.022.
- Apte, M. G., W. J. Fisk, and J. M. Daisey. 2000. “Indoor Carbon Dioxide Concentrations and SBS in Office Workers.” InProceedings of Healthy Buildings 1: 133.
- Auliciems, A., and S. V. Szokolay. 1997. Thermal Comfort PLEA: Passive Low Energy Architecture International in Association with University of Queensland, 4072. Brisbane: Dept. of Architecture.
- Ayr, U., E. Cirillo, I. Fato, and F. Martellotta. 2003. “A New Approach to Assessing the Performance of Noise Indices in Buildings.” Applied Acoustics 64 (2): 129–145. doi:https://doi.org/10.1016/S0003-682X(02)00075-0.
- Azarbayjani, M., D. Brentrup, and R. Cox. 2014. “Advancing Occupant-Centered Performance Simulation Metrics Linking Commercial Environmental Quality to Health, Behavior, and Productivity.” Paper presented at the First International Symposium on Sustainable Human–Building Ecosystems, held in Pittsburgh, Pennsylvania, October 5–6, 2015. Sustainable Human–Building Ecosystems 126–140. doi:https://doi.org/10.1061/9780784479681.014
- Bakó-Biró, Z., D. J. Clements-Croome, N. Kochhar, H. B. Awbi, and M. J. Williams. 2012. “Ventilation Rates in Schools and Pupils’ Performance.” Building and Environment 48: 215–223. doi:https://doi.org/10.1016/j.buildenv.2011.08.018.
- Bako-Biro, Z., P. Wargocki, C. Weschler, and P. O. Fanger. 2002. “Personal Computers Pollute Indoor Air: Effects on Perceived Air Quality, SBS Symptoms and Productivity in Offices.” Proceedings of Indoor Air 2: 249–254.
- Brager, G. S., and R. J. De Dear. 1998. “Thermal Adaptation in the Built Environment: A Literature Review.” Energy and Buildings 27 (1, February 1): 83–96. doi:https://doi.org/10.1016/S0378-7788(97)00053-4.
- Brook, R. D., S. Rajagopalan, C. A. Pope III, J. R. Brook, A. Bhatnagar, A. V. Diez-Roux, F. Holguin, et al. 2010. “Particulate Matter Air Pollution and Cardiovascular Disease: An Update to the Scientific Statement from the American Heart Association.” Circulation 121 (21): 2331–2378. doi:https://doi.org/10.1161/CIR.0b013e3181dbece1.
- Budd, G. M., and N. Warhaft. 1966. “Body Temperature, Shivering, Blood Pressure and Heart Rate during a Standard Cold Stress in Australia and Antarctica.” The Journal of Physiology 186 (1): 216–232. doi:https://doi.org/10.1113/jphysiol.1966.sp008030.
- Buratti, C., and P. Ricciardi. 2009. “Adaptive Analysis of Thermal Comfort in University Classrooms: Correlation between Experimental Data and Mathematical Models.” Building and Environment 44 (4): 674–687. doi:https://doi.org/10.1016/j.buildenv.2008.06.001.
- Callister, R. O., N. O. Suwarno, and D. R. Seals. 1992. “Sympathetic Activity Is Influenced by Task Difficulty and Stress Perception during Mental Challenge in Humans.” The Journal of Physiology 454 (1): 373–387. doi:https://doi.org/10.1113/jphysiol.1992.sp019269.
- Carayon, P. 1993. “Job Design and Job Stress in Office Workers.” Ergonomics 36 (5): 463–477. doi:https://doi.org/10.1080/00140139308967905.
- Caruana-Montaldo, B., K. Gleeson, and C. W. Zwillich. 2000. “The Control of Breathing in Clinical Practice.” Chest 117 (1): 205–225. doi:https://doi.org/10.1378/chest.117.1.205.
- Chamberlain, B., and G. Jordan. 2012. Applications of Wireless Sensors in Monitoring Indoor Air Quality in the Classroom Environment. Research Experiences for Teachers Program 2012, RET Project at University of North Texas, Denton Texas, July. https://pdfs.semanticscholar.org/d488/a9b779d6facda9f973ca5afd9c6a471ab123.pdf
- Chen, Y. C., and T. C. Hsiao. 2015. “Physiological Responses to Different CO 2 Levels in Poor Ventilation Room.” In: Lacković I., Vasic D. (eds) 6th European Conference of the International Federation for Medical and Biological Engineering. IFMBE Proceedings 45: 423–426. Cham: Springer. https://doi.org/https://doi.org/10.1007/978-3-319-11128-5_106
- Cheng, C., T. Matsukawa, D. I. Sessler, O. Makoto, A. Kurz, B. Merrifield, H. Lin, and P. Olofsson. 1995. “Increasing Mean Skin Temperature Linearly Reduces the Core-temperature Thresholds for Vasoconstriction and Shivering in Humans.” Anesthesiology: The Journal of the American Society of Anesthesiologists 82 (5): 1160–1168. doi:https://doi.org/10.1097/00000542-199505000-00011.
- Cheong, K. W., E. Djunaedy, Y. L. Chua, K. W. Tham, S. C. Sekhar, N. H. Wong, and M. B. Ullah. 2003. “Thermal Comfort Study of an Air-conditioned Lecture Theatre in the Tropics.” Building and Environment 38 (1): 63–73. doi:https://doi.org/10.1016/S0360-1323(02)00020-3.
- Choi, J. H., Q. S. Xu, S. Y. Park, J. H. Kim, S. S. Hwang, K. H. Lee, H. J. Lee, and Y. C. Hong. 2007. “Seasonal Variation of Effect of Air Pollution on Blood Pressure.” Journal of Epidemiology & Community Health 61 (4): 314–318. doi:https://doi.org/10.1136/jech.2006.049205.
- Chow, W. K., and L. T. Wong. 1998. “Survey on the Air Diffusion Devices for Air-conditioning Systems in Hong Kong.” Energy Engineering 95 (6): 50–79. doi:https://doi.org/10.1080/01998595.1998.10530441.
- Chung, T. M., and J. Burnett. 1996. A Field Survey of Lighting Environments in Office Premises in Hong Kong. Department of Building Services Engineering, Hong Kong Polytechnic University, Hung Hom, Hong Kong, China.
- Clements-Croome, D. J., H. B. Awbi, Z. Bakó-Biró, N. Kochhar, and M. Williams. 2008. “Ventilation Rates in Schools.” Building and Environment 43 (3): 362–367. doi:https://doi.org/10.1016/j.buildenv.2006.03.018.
- Collins, K. J., J. C. Easton, H. Belfield-Smith, A. N. Exton-Smith, and R. A. Pluck. 1985. “Effects of Age on Body Temperature and Blood Pressure in Cold Environments.” Clinical Science 69 (4): 465–470. doi:https://doi.org/10.1042/cs0690465.
- Cui, W., G. Cao, J. H. Park, Q. Ouyang, and Y. Zhu. 2013. “Influence of Indoor Air Temperature on Human Thermal Comfort, Motivation and Performance.” Building and Environment 68: 114–122. doi:https://doi.org/10.1016/j.buildenv.2013.06.012.
- Daisey, J. M., W. J. Angell, and M. G. Apte. 2003. “Indoor Air Quality, Ventilation and Health Symptoms in Schools: An Analysis of Existing Information.” Indoor Air 13 (1): 53–64. doi:https://doi.org/10.1034/j.1600-0668.2003.00153.x.
- De Dear, R., and G. S. Brager. 1998. “Developing an Adaptive Model of Thermal Comfort and Preference.” ASHRAE Transactions 104: 145.
- De Vecchi, R., M. J. Sorgato, M. Pacheco, C. Cândido, and R. Lamberts. 2015. “ASHRAE 55 Adaptive Model Application in Hot and Humid Climates: The Brazilian Case.” Architectural Science Review 58 (1): 93–101. doi:https://doi.org/10.1080/00038628.2014.981145.
- Djongyang, N., R. Tchinda, and D. Njomo. 2010. “Thermal Comfort: A Review Paper.” Renewable and Sustainable Energy Reviews 14 (9): 2626–2640. doi:https://doi.org/10.1016/j.rser.2010.07.040.
- Ettema, J. H., and R. L. Zielhuis. 1971. “Physiological Parameters of Mental Load.” Ergonomics 14 (1): 137–144. doi:https://doi.org/10.1080/00140137108931232.
- Fang, L., D. P. Wyon, G. Clausen, and P. O. Fanger. 2004. “Impact of Indoor Air Temperature and Humidity in an Office on Perceived Air Quality, SBS Symptoms and Performance.” Indoor Air 14 (s7): 74–81. doi:https://doi.org/10.1111/j.1600-0668.2004.00276.x.
- Fanger, P. O. 1972. Thermal Comfort. NewYork, NY: McGraw-Hill.
- Fanger, P. O., and J. Toftum. 2002. “Extension of the PMV Model to Non-air-conditioned Buildings in Warm Climates.” Energy and Buildings 34 (6): 533–536. doi:https://doi.org/10.1016/S0378-7788(02)00003-8.
- Fisk, W. J., and A. H. Rosenfeld. 1997. “Estimates of Improved Productivity and Health from Better Indoor Environments.” Indoor Air 7 (3): 158–172. doi:https://doi.org/10.1111/j.1600-0668.1997.t01-1-00002.x.
- Frank, S. M., S. N. Raja, C. F. Bulcao, and D. S. Goldstein. 1999. “Relative Contribution of Core and Cutaneous Temperatures to Thermal Comfort and Autonomic Responses in Humans.” Journal of Applied Physiology 86 (5): 1588–1593. doi:https://doi.org/10.1152/jappl.1999.86.5.1588.
- Fredericks, T. K., S. D. Choi, J. Hart, S. E. Butt, and A. Mital. 2005. “An Investigation of Myocardial Aerobic Capacity as a Measure of Both Physical and Cognitive Workloads.” International Journal of Industrial Ergonomics 35 (12): 1097–1107. doi:https://doi.org/10.1016/j.ergon.2005.06.002.
- Fromme, H., D. Twardella, S. Dietrich, D. Heitmann, R. Schierl, B. Liebl, and H. Rüden. 2007. “Particulate Matter in the Indoor Air of Classrooms—exploratory Results from Munich and Surrounding Area.” Atmospheric Environment 41 (4): 854–866. doi:https://doi.org/10.1016/j.atmosenv.2006.08.053.
- Gatto, N. M., V. W. Henderson, H. N. Hodis, J. A. John, F. Lurmann, J. C. Chen, and W. J. Mack. 2014. “Components of Air Pollution and Cognitive Function in Middle-aged and Older Adults in Los Angeles.” Neurotoxicology 40: 1–7. doi:https://doi.org/10.1016/j.neuro.2013.09.004.
- Godish, T. 2016. Indoor Environmental Quality. Boca Raton, Florida: CRC press. https://doi.org/https://doi.org/10.1201/9781420056747
- Government Publications Office, editor. 2016. International Energy Outlook 2016: With Projections to 2040. Government Printing Office. August 18.
- Haapalainen, E., S. Kim, J. F. Forlizzi, and A. K. Dey. 2010. “Psycho-physiological Measures for Assessing Cognitive Load.” In Proceedings of the 12th ACM International Conference on Ubiquitous Computing, Copenhagen, Denmark, 301–310. ACM. September 26. https://doi.org/https://doi.org/10.1145/1864349.1864395
- Hamilton M., Rackes A., Gurian P. L., and Waring M. S. 2016. “Perceptions in the US Building Industry of the Benefits and Costs of Improving Indoor Air Quality.” Indoor Air 26 (2): 318–330. doi:https://doi.org/10.1111/ina.12192.
- Hastak, M., and C. Koo. 2016a. “Theory of an Intelligent Planning Unit for the Complex Built Environment.” Journal of Management in Engineering 33 (3): 04016046. doi:https://doi.org/10.1061/(ASCE)ME.1943-5479.0000486.
- Hastak, M., and C. Koo. 2016b. “A Conceptual Framework for an Intelligent Planning Unit for the Complex Built Environment.” Procedia Engineering 161: 269–274. doi:https://doi.org/10.1016/j.proeng.2016.08.551.
- Hedge, A. 1996. “Addressing the Psychological Aspects of Indoor Air Quality.” In Proceedings of the First Asian Indoor Air Quality Seminar Sponsored by BAT, 69–71. Urumqi, China. September 22. http://ergo.human.cornell.edu/AirQuality/iaqslides96/ahpaper.html
- Heidbreder, E., A. Ziegler, A. Heidland, R. Kirsten, and W. Grüninger. 1982. “Circulatory Changes during Mental Stress in Tetraplegic and Paraplegic Man.” Klinische Wochenschrift 60 (15): 795–801. doi:https://doi.org/10.1007/BF01721144.
- Heinzerling, D., S. Schiavon, T. Webster, and E. Arens. 2013. “Indoor Environmental Quality Assessment Models: A Literature Review and A Proposed Weighting and Classification Scheme.” Building and Environment 70: 210–222. doi:https://doi.org/10.1016/j.buildenv.2013.08.027.
- Hien, W. N., W. Liping, A. N. Chandra, A. R. Pandey, and W. Xiaolin. 2005. “Effects of Double Glazed Facade on Energy Consumption, Thermal Comfort and Condensation for a Typical Office Building in Singapore.” Energy and Buildings 37 (6): 563–572. doi:https://doi.org/10.1016/j.enbuild.2004.08.004.
- Higgins, S., E. Hall, K. Wall, P. Woolner, and C. McCaughey. 2005. The Impact of School Environments: A Literature Review. London: Design Council. February.
- Hong, T., J. Kim, M. Chae, J. Park, J. Jeong, and M. Lee. 2016. “Sensitivity Analysis on the Impact Factors of the GSHP System considering Energy Generation and Environmental Impact Using LCA.” Sustainability 8 (4): 376. doi:https://doi.org/10.3390/su8040376.
- Hong, T., J. Kim, and C. Koo. 2012. “LCC and LCCO2 Analysis of Green Roofs in Elementary Schools with Energy Saving Measures.” Energy and Buildings 45: 229–239. doi:https://doi.org/10.1016/j.enbuild.2011.11.006.
- Hong, T., J. Kim, J. Lee, C. Koo, and H. S. Park. 2013. “Assessment of Seasonal Energy Efficiency Strategies of a Double Skin Façade in a Monsoon Climate Region.” Energies 6 (9): 4352–4376. doi:https://doi.org/10.3390/en6094352.
- Hong, T., J. Kim, and M. Lee. 2018. “Integrated Task Performance Score for the Building Occupants Based on the CO2 Concentration and Indoor Climate Factors Changes.” Applied Energy 228: 1707–1713. doi:https://doi.org/10.1016/j.apenergy.2018.07.063.
- Hong, T., C. Koo, J. Kim, M. Lee, and K. Jeong. 2015. “A Review on Sustainable Construction Management Strategies for Monitoring, Diagnosing, and Retrofitting the Building’s Dynamic Energy Performance: Focused on the Operation and Maintenance Phase.” Applied Energy 155: 671–707. doi:https://doi.org/10.1016/j.apenergy.2015.06.043.
- Höppe, P., T. Oohori, L. Berglund, A. Fobelets, and A. Gwosdow. 2000. “Vapor Resistance of Clothing and Its Effect on Human Response during and after Exercise.” Proceesings of CLIMA 2000: 97–101.
- Hummelgaard, J., P. Juhl, K. O. Sæbjörnsson, G. Clausen, J. Toftum, and G. Langkilde. 2007. “Indoor Air Quality and Occupant Satisfaction in Five Mechanically and Four Naturally Ventilated Open-plan Office Buildings.” Building and Environment 42 (12): 4051–4058. doi:https://doi.org/10.1016/j.buildenv.2006.07.042.
- Hunn, B. D., and J. Bochat. 2015. “Measurement of Commercial Building Performance.” ASHRAE Journal 57 (1): 66.
- Imanari, T., T. Omori, and K. Bogaki. 1999. “Thermal Comfort and Energy Consumption of the Radiant Ceiling Panel System: Comparison with the Conventional All-air System.” Energy and Buildings 30 (2): 167–175. doi:https://doi.org/10.1016/S0378-7788(98)00084-X.
- International Organization for Standardization. 2005. Ergonomics of the Thermal Environment: Analytical Determination and Interpretation of Thermal Comfort Using Calculation of the PMV and PPD Indices and Local Thermal Comfort Criteria. Management, 3 (605), p. e615. International Organization for Standardization.
- ISO, EN. 7730: 2005. 2005. Ergonomics of the Thermal environment-Analytical Determination and Interpretation of Thermal Comfort Using Calculation of the PMV and PPD Indices and Local Thermal Comfort Criteria. Management, 3 (605), p. e615. Geneva, Switzerland: International Organization for Standardization.
- Ivanov, M. 2016. “Reliability of the Results from Unplanned Subjective Assessment of the Indoor Air Quality and Thermal Comfort Parameters in Small Lecture Room.” Energy Procedia 85: 295–302. doi:https://doi.org/10.1016/j.egypro.2015.12.255.
- Jaggs, M., and J. Palmer. 2000. “Energy Performance Indoor Environmental Quality Retrofit—a European Diagnosis and Decision Making Method for Building Refurbishment.” Energy and Buildings 31 (2): 97–101. doi:https://doi.org/10.1016/S0378-7788(99)00023-7.
- Jeong, J., T. Hong, C. Ji, J. Kim, M. Lee, K. Jeong, and C. Koo. 2017. “Development of a Prediction Model for the Cost Saving Potentials in Implementing the Building Energy Efficiency Rating Certification.” Applied Energy 189: 257–270. doi:https://doi.org/10.1016/j.apenergy.2016.12.024.
- Jeong, J., T. Hong, J. Kim, M. Chae, and C. Ji. 2018. “Multi-criteria Analysis of a Self-consumption Strategy for Building Sectors Focused on Ground Source Heat Pump Systems.” Journal of Cleaner Production 186: 68–80. doi:https://doi.org/10.1016/j.jclepro.2018.03.121.
- Ji, C., T. Hong, J. Jeong, J. Kim, M. Lee, and K. Jeong. 2016. “Establishing Environmental Benchmarks to Determine the Environmental Performance of Elementary School Buildings Using LCA.” Energy and Buildings 127: 818–829. doi:https://doi.org/10.1016/j.enbuild.2016.06.042.
- Kajtár, L., and L. Herczeg. 2012. “Influence of Carbon-dioxide Concentration on Human Well-being and Intensity of Mental Work.” QJ Hung Meteorol Serv 116: 145–169.
- Kim, C. J., J. Kim, T. Hong, C. Koo, K. Jeong, and H. S. Park. 2015a. “A Program-level Management System for the Life Cycle Environmental and Economic Assessment of Complex Building Projects.” Environmental Impact Assessment Review 54: 9–21. doi:https://doi.org/10.1016/j.eiar.2015.04.005.
- Kim, J., T. Hong, J. Jeong, C. Koo, and K. Jeong. 2016a. “An Optimization Model for Selecting the Optimal Green Systems by considering the Thermal Comfort and Energy Consumption.” Applied Energy 169: 682–695. doi:https://doi.org/10.1016/j.apenergy.2016.02.032.
- Kim, J., T. Hong, J. Jeong, C. Koo, and M. Kong. 2017a. “An Integrated Psychological Response Score of the Occupants Based on Their Activities and the Indoor Environmental Quality Condition Changes.” Building and Environment 123: 66–77. doi:https://doi.org/10.1016/j.buildenv.2017.06.046.
- Kim, J., T. Hong, J. Jeong, M. Lee, C. Koo, M. Lee, C. Ji, and J. Jeong. 2016b. “An Integrated Multi-objective Optimization Model for Determining the Optimal Solution in the Solar Thermal Energy System.” Energy 102: 416–426. doi:https://doi.org/10.1016/j.energy.2016.02.104.
- Kim, J., T. Hong, J. Jeong, M. Lee, M. Lee, K. Jeong, C. Koo, and J. Jeong. 2017b. “Establishment of an Optimal Occupant Behavior considering the Energy Consumption and Indoor Environmental Quality by Region.” Applied Energy 204: 1431–1443. doi:https://doi.org/10.1016/j.apenergy.2017.05.017.
- Kim, J., T. Hong, and C. W. Koo. 2012. “Economic and Environmental Evaluation Model for Selecting the Optimum Design of Green Roof Systems in Elementary Schools.” Environmental Science & Technology 46 (15): 8475–8483. doi:https://doi.org/10.1021/es2043855.
- Kim, J., M. Kong, T. Hong, K. Jeong, and M. Lee. 2018. “Physiological Response of Building Occupants Based on Their Activity and the Indoor Environmental Quality Condition Changes.” Building and Environment 145: 96–103. doi:https://doi.org/10.1016/j.buildenv.2018.09.018.
- Kim, J., C. Koo, C. J. Kim, T. Hong, and H. S. Park. 2015b. “Integrated CO2, Cost, and Schedule Management System for Building Construction Projects Using the Earned Value Management Theory.” Journal of Cleaner Production 103: 275–285. doi:https://doi.org/10.1016/j.jclepro.2014.05.031.
- Kim, M. J., R. D. Braatz, J. T. Kim, and C. K. Yoo. 2016c. “Economical Control of Indoor Air Quality in Underground Metro Station Using an Iterative Dynamic Programming-based Ventilation System.” Indoor and Built Environment 25 (6): 949–961. doi:https://doi.org/10.1177/1420326X15591640.
- Kim, S., and E. Paulos. 2010. “InAir: Sharing Indoor Air Quality Measurements and Visualizations.” In Proceedings of the SIGCHI Conference on Human Factors in Computing Systems, 1861–1870. ACM. April 10. New York, NY: Association for Computing Machinery.
- Koo, C., T. Hong, K. Jeong, C. Ban, and J. Oh. 2017. “Development of the Smart Photovoltaic System Blind and Its Impact on Net-zero Energy Solar Buildings Using Technical-economic-political Analyses.” Energy 124: 382–396. doi:https://doi.org/10.1016/j.energy.2017.02.088.
- Koo, C., T. Hong, M. Lee, and J. Kim. 2016. “An Integrated Multi-objective Optimization Model for Determining the Optimal Solution in Implementing the Rooftop Photovoltaic System.” Renewable and Sustainable Energy Reviews 57: 822–837. doi:https://doi.org/10.1016/j.rser.2015.12.205.
- Koo, C., T. Hong, and J. Park. 2016. “Development of the Life-cycle Economic and Environmental Assessment Model for Establishing the Optimal Implementation Strategy of the Rooftop Photovoltaic System.” Technological and Economic Development of Economy 2016: 1–21.
- Kosonen, R., and F. Tan. 2004. “Assessment of Productivity Loss in Air-conditioned Buildings Using PMV Index.” Energy and Buildings 36 (10, October 1): 987–993. doi:https://doi.org/10.1016/j.enbuild.2004.06.021.
- Kotopouleas, A., and M. Nikolopoulou. 2016. “Thermal Comfort Conditions in Airport Terminals: Indoor or Transition Spaces?” Building and Environment 99: 184–199. doi:https://doi.org/10.1016/j.buildenv.2016.01.021.
- Lagercrantz, L., and J. Sundell. 2000. “Negative Impact of Air Pollution on Productivity.” InHealthy Buildings 20000 (1): 653–658.
- Lam, J. C., S. C. Hui, and A. L. Chan. 1997. “Regression Analysis of High-rise Fully Air-conditioned of Fice Buildings.” Energy and Buildings 26 (2): 189–198. doi:https://doi.org/10.1016/S0378-7788(96)01034-1.
- Lan, L., P. Wargocki, D. P. Wyon, and Z. Lian. 2011. “Effects of Thermal Discomfort in an Office on Perceived Air Quality, SBS Symptoms, Physiological Responses, and Human Performance.” Indoor Air 21 (5): 376–390. doi:https://doi.org/10.1111/j.1600-0668.2011.00714.x.
- Lee, M. C., K. W. Mui, L. T. Wong, W. Y. Chan, E. W. Lee, and C. T. Cheung. 2012. “Student Learning Performance and Indoor Environmental Quality (IEQ) in Air-conditioned University Teaching Rooms.” Building and Environment 49: 238–244. doi:https://doi.org/10.1016/j.buildenv.2011.10.001.
- Lenneman, J. K., J. R. Shelley, and R. W. Backs. 2005. “Deciphering Psychological-Physiological Mappings while Driving and Performing a Secondary Memory Task.” In Driving Assessment 2005: 3rd International Driving Symposium on Human Factors in Driver Assessment, Training, and Vehicle Design, Rockport, Maine. Iowa City, IA: Public Policy Center, University of Iowa. https://doi.org/https://doi.org/10.17077/drivingassessment.1203
- Li, B., R. Yao, Q. Wang, and Y. Pan. 2014. “An Introduction to the Chinese Evaluation Standard for the Indoor Thermal Environment.” Energy and Buildings 82: 27–36. doi:https://doi.org/10.1016/j.enbuild.2014.06.032.
- Linn, W. S., H. Gong Jr, K. W. Clark, and K. R. Anderson. 1999. “Day-to-day Particulate Exposures and Health Changes in Los Angeles Area Residents with Severe Lung Disease.” Journal of the Air & Waste Management Association 49 (9): 108–115. doi:https://doi.org/10.1080/10473289.1999.10463890.
- Luo, M., B. Cao, W. Ji, Q. Ouyang, B. Lin, and Y. Zhu. 2016. “The Underlying Linkage between Personal Control and Thermal Comfort: Psychological or Physical Effects?” Energy and Buildings 111: 56–63. doi:https://doi.org/10.1016/j.enbuild.2015.11.004.
- Mak, C. M., and Y. P. Lui. 2012. “The Effect of Sound on Office Productivity.” Building Services Engineering Research and Technology 33 (3): 339–345. doi:https://doi.org/10.1177/0143624411412253.
- Mäkinen, T. M., L. A. Palinkas, D. L. Reeves, T. Pääkkönen, H. Rintamäki, J. Leppäluoto, and J. Hassi. 2006. “Effect of Repeated Exposures to Cold on Cognitive Performance in Humans.” Physiology & Behavior 87 (1): 166–176. doi:https://doi.org/10.1016/j.physbeh.2005.09.015.
- Maula, H., V. Hongisto, L. Östman, A. Haapakangas, H. Koskela, and J. Hyönä. 2016. “The Effect of Slightly Warm Temperature on Work Performance and Comfort in Open‐plan Offices–a Laboratory Study.” Indoor Air 26 (2): 286–297. doi:https://doi.org/10.1111/ina.12209.
- Mehler, B., B. Reimer, J. Coughlin, and J. Dusek. 2009. “Impact of Incremental Increases in Cognitive Workload on Physiological Arousal and Performance in Young Adult Drivers.” Transportation Research Record: Journal of the Transportation Research Board 2138 (1): 6–12. doi:https://doi.org/10.3141/2138-02.
- Mendell, M. J., E. A. Eliseeva, M. M. Davies, and A. Lobscheid. 2016. “Do Classroom Ventilation Rates in C Alifornia Elementary Schools Influence Standardized Test Scores? Results from a Prospective Study.” Indoor Air 26 (4): 546–557. doi:https://doi.org/10.1111/ina.12241.
- Moschandreas, D. J., and S. C. Sofuoglu. 2004. “The Indoor Environmental Index and Its Relationship with Symptoms of Office Building Occupants.” Journal of the Air & Waste Management Association 54 (11): 1440–1451. doi:https://doi.org/10.1080/10473289.2004.10470999.
- Mui, K. W., and L. T. Wong. 2006. “Acceptable Illumination Levels for Office Occupants.” Architectural Science Review 49 (2): 116–119. doi:https://doi.org/10.3763/asre.2006.4915.
- Mui, K. W., and L. T. Wong. 2007. “Evaluation of the Neutral Criterion of Indoor Air Quality for Air-conditioned Offices in Subtropical Climates.” Building Services Engineering Research and Technology 28 (1): 23–33. doi:https://doi.org/10.1177/0143624406070666.
- Mui, K. W., L. T. Wong, and L. Y. Law. 2007. “An Energy Benchmarking Model for Ventilation Systems of Air-conditioned Offices in Subtropical Climates.” Applied Energy 84 (1): 89–98. doi:https://doi.org/10.1016/j.apenergy.2006.04.002.
- Myhrvold, A. N., E. Olsen, and O. Lauridsen. 1996. “Indoor Environment in Schools–pupil’s Health and Performance in regard to CO2 Concentrations.” Indoor Air 96 (4): 369–371.
- Niemelä, R., M. Hannula, S. Rautio, K. Reijula, and J. Railio. 2002. “The Effect of Air Temperature on Labour Productivity in Call Centres—a Case Study.” Energy and Buildings 34 (8): 759–764. doi:https://doi.org/10.1016/S0378-7788(02)00094-4.
- Ning, H., Z. Wang, X. Zhang, and Y. Ji. 2016. “Adaptive Thermal Comfort in University Dormitories in the Severe Cold Area of China.” Building and Environment 99: 161–169. doi:https://doi.org/10.1016/j.buildenv.2016.01.003.
- Nordström, K., D. Norbäck, and R. Akselsson. 1994. “Effect of Air Humidification on the Sick Building Syndrome and Perceived Indoor Air Quality in Hospitals: A Four-month Longitudinal Study.” Occupational and Environmental Medicine 51 (10): 683–688. doi:https://doi.org/10.1136/oem.51.10.683.
- Olesen, B. W. 2012. “Revision of EN 15251: Indoor Environmental Criteria.” REHVA Journal 49 (4): 6–12.
- Park, H. S., K. Jeong, T. Hong, C. Ban, C. Koo, and J. Kim. 2016. “The Optimal Photovoltaic System Implementation Strategy to Achieve the National Carbon Emissions Reduction Target in 2030: Focused on Educational Facilities.” Energy and Buildings 119: 101–110. doi:https://doi.org/10.1016/j.enbuild.2016.03.029.
- Park, J. S., and C. H. Yoon. 2011. “The Effects of Outdoor Air Supply Rate on Work Performance during 8‐h Work Period.” Indoor Air 21 (4): 284–290. doi:https://doi.org/10.1111/j.1600-0668.2010.00700.x.
- Persily, A. 2015. “Challenges in Developing Ventilation and Indoor Air Quality Standards: The Story of ASHRAE Standard 62.” Building and Environment 91: 61–69. doi:https://doi.org/10.1016/j.buildenv.2015.02.026.
- Phillips, A. C., D. Carroll, P. Evans, J. A. Bosch, A. Clow, F. Hucklebridge, and G. Der. 2006. “Stressful Life Events are Associated with Low Secretion Rates of Immunoglobulin A in Saliva in the Middle Aged and Elderly.” Brain, Behavior, and Immunity 20 (2): 191–197. doi:https://doi.org/10.1016/j.bbi.2005.06.006.
- Pilcher, J. J., E. Nadler, and C. Busch. 2002. “Effects of Hot and Cold Temperature Exposure on Performance: A Meta-analytic Review.” Ergonomics 45 (10, August 1): 682–698. doi:https://doi.org/10.1080/00140130210158419.
- Ravindu, S., R. Rameezdeen, J. Zuo, Z. Zhou, and R. Chandratilake. 2015. “Indoor Environment Quality of Green Buildings: Case Study of an LEED Platinum Certified Factory in a Warm Humid Tropical Climate.” Building and Environment 84: 105–113. doi:https://doi.org/10.1016/j.buildenv.2014.11.001.
- Rea, M. S. 2000. The IESNA Lighting Handbook: Reference & Application. New York: Illuminating Engineering Society of North America. July.
- Reynolds, S. J., D. W. Black, S. S. Borin, G. Breuer, L. F. Burmeister, L. J. Fuortes, T. F. Smith, et al. 2001. “Indoor Environmental Quality in Six Commercial Office Buildings in the Midwest United States.” Applied Occupational and Environmental Hygiene 16 (11): 1065–1077. doi:https://doi.org/10.1080/104732201753214170.
- Rijal, H. B., P. Tuohy, M. A. Humphreys, J. F. Nicol, A. Samuel, and J. Clarke. 2007. “Using Results from Field Surveys to Predict the Effect of Open Windows on Thermal Comfort and Energy Use in Buildings.” Energy and Buildings 39 (7): 823–836. doi:https://doi.org/10.1016/j.enbuild.2007.02.003.
- Roelofsen, P. 2002. “The Impact of Office Environments on Employee Performance: The Design of the Workplace as a Strategy for Productivity Enhancement.” Journal of Facilities Management 1 (3): 247–264. doi:https://doi.org/10.1108/14725960310807944.
- Satish, U., M. J. Mendell, K. Shekhar, T. Hotchi, D. Sullivan, S. Streufert, and W. J. Fisk. 2012. “Is CO2 an Indoor Pollutant? Direct Effects of Low-to-moderate CO2 Concentrations on Human Decision-making Performance.” Environmental Health Perspectives 120 (12): 1671. doi:https://doi.org/10.1289/ehp.1104789.
- Schellen, L., W. D. van Marken Lichtenbelt, M. G. Loomans, J. Toftum, and M. H. De Wit. 2010. “Differences between Young Adults and Elderly in Thermal Comfort, Productivity, and Thermal Physiology in Response to a Moderate Temperature Drift and a Steady‐state Condition.” Indoor Air 20 (4): 273–283. doi:https://doi.org/10.1111/j.1600-0668.2010.00657.x.
- Seppanen, O., W. J. Fisk, and Q. Lei. 2006a. Effect of Temperature on Task Performance in Office Environment, 5th International Conference on Cold Climate Heating, Ventilating and Air Conditioning, Moscow, Russia, May 21-24, 2006. Lawrence Berkeley National Laboratory.
- Seppanen, O., W. J. Fisk, and Q. H. Lei. 2006b. Room Temperature and Productivity in Office Work, conference: Healthy Buildings 2006, Lisbon, Portugal, June 4-8, 2006. Lawrence Berkeley National Laboratory. https://www.osti.gov/servlets/purl/903492
- Seppänen, O. A., and W. J. Fisk. 2004. “Summary of Human Responses to Ventilation.” Indoor Air 14 (1): 102–118. doi:https://doi.org/10.1111/j.1600-0668.2004.00279.x.
- Shendell D. G., Prill R., Fisk W. J., Apte M. G., Blake D., Faulkner D., Authority N. A., and Mount Vernon W. A. 2003. Associations between Classroom CO2 Concentrations and Student Attendance. Berkeley, CA: EO Lawrence Berkeley National Laboratory. July 25.
- Sicurella, F., and P. Colamesta. 2015. “A Global Approach to Evaluate IAQ and Thermal Comfort in A Healthy Building Perspective.” In Proceedings of International Conference CISBAT 2015 Future Buildings and Districts Sustainability from Nano to Urban Scale, Lausanne, Switzeland, 387–392. No. EPFL-CONF-213351. LESO-PB, EPFL.
- Simonson, C. 2005. “Energy Consumption and Ventilation Performance of a Naturally Ventilated Ecological House in a Cold Climate.” Energy and Buildings 37 (1): 23–35. doi:https://doi.org/10.1016/j.enbuild.2004.04.006.
- STANDARD, ASHRAE. 2010. Standard 55-2010, Thermal Environmental Conditions for Human Occupancy. American Society of Heating, Refrigerating and Air Conditioning Engineers, Atlanta, GA, United States.
- Sun, Y. P., and N. Zhu. 2013. “Study on Assessment of High Temperature and Humidity in Working Environment on Human Health.” Advanced Materials Research 610: 739–742. Trans Tech Publications.
- Takeda, S., K. Nagano, T. Mochida, and K. Shimakura. 2004. “Development of a Ventilation System Utilizing Thermal Energy Storage for Granules Containing Phase Change Material.” Solar Energy 77 (3): 329–338. doi:https://doi.org/10.1016/j.solener.2004.04.014.
- Tanabe, S. I., Y. Iwahashi, S. Tsushima, and N. Nishihara. 2013. “Thermal Comfort and Productivity in Offices under Mandatory Electricity Savings after the Great East Japan Earthquake.” Architectural Science Review 56 (1): 4–13. doi:https://doi.org/10.1080/00038628.2012.744296.
- Thackray R. I. and Pearson D. W. 1968. “Effects of Cognitive Appraisal of Stress on Heart Rate and Task Performance.” Perceptual and Motor Skills 27 (2): 651–658. doi:https://doi.org/10.2466/pms.1968.27.2.651.
- Tham, K. W. 2004. “Effects of Temperature and Outdoor Air Supply Rate on the Performance of Call Center Operators in the Tropics.” Indoor Air 14 (s7): 119–125. doi:https://doi.org/10.1111/j.1600-0668.2004.00280.x.
- Tham, K. W., and H. C. Willem. 2010. “Room Air Temperature Affects Occupants’ Physiology, Perceptions and Mental Alertness.” Building and Environment 45 (1): 40–44. doi:https://doi.org/10.1016/j.buildenv.2009.04.002.
- Toftum, J., A. S. Jørgensen, and P. O. Fanger. 1998. “Upper Limits for Indoor Air Humidity to Avoid Uncomfortably Humid Skin.” Energy and Buildings 28 (1): 1–3. doi:https://doi.org/10.1016/S0378-7788(97)00017-0.
- Varjo, J., V. Hongisto, A. Haapakangas, H. Maula, H. Koskela, and J. Hyönä. 2015. “Simultaneous Effects of Irrelevant Speech, Temperature and Ventilation Rate on Performance and Satisfaction in Open-plan Offices.” Journal of Environmental Psychology 44: 16–33. doi:https://doi.org/10.1016/j.jenvp.2015.08.001.
- Vehviläinen, T., H. Lindholm, H. Rintamäki, R. Pääkkönen, A. Hirvonen, O. Niemi, and J. Vinha. 2016. “High Indoor CO2 Concentrations in an Office Environment Increases the Transcutaneous CO2 Level and Sleepiness during Cognitive Work.” Journal of Occupational and Environmental Hygiene 13 (1): 19–29. doi:https://doi.org/10.1080/15459624.2015.1076160.
- Verheyen, J., N. Theys, L. Allonsius, and F. Descamps. 2011. “Thermal Comfort of Patients: Objective and Subjective Measurements in Patient Rooms of a Belgian Healthcare Facility.” Building and Environment 46 (5): 1195–1204. doi:https://doi.org/10.1016/j.buildenv.2010.12.014.
- Vrijkotte, T. G., L. J. Van Doornen, and E. J. De Geus. 2000. “Effects of Work Stress on Ambulatory Blood Pressure, Heart Rate, and Heart Rate Variability.” Hypertension 35 (4): 880–886. doi:https://doi.org/10.1161/01.HYP.35.4.880.
- Wagner, A., E. Gossauer, C. Moosmann, T. Gropp, and R. Leonhart. 2007. “Thermal Comfort and Workplace Occupant satisfaction—Results of Field Studies in German Low Energy Office Buildings.” Energy and Buildings 39 (7): 758–769. doi:https://doi.org/10.1016/j.enbuild.2007.02.013.
- Wanner, H., A. P. Verhoeff, A. Colombi, B. Flannigan, S. Gravesen, A. Mouilleseux, A. Nevalainen, J. Papadakis, and K. Seidel. 1993. European Collaborative Action: Indoor Air Quality and Its Impact on Man: Environmental Quality and Life. Luxemburg: Commission of the European Communities.
- Wargocki, P., L. Lagercrantz, T. Witterseh, J. Sundell, D. P. Wyon, and P. O. Fanger. 2002. “Subjective Perceptions, Symptom Intensity and Performance: A Comparison of Two Independent Studies, Both Changing Similarly the Pollution Load in an Office.” Indoor Air 12 (2): 74–80. doi:https://doi.org/10.1034/j.1600-0668.2002.01101.x.
- Wargocki, P., and D. P. Wyon. 2007. “The Effects of Moderately Raised Classroom Temperatures and Classroom Ventilation Rate on the Performance of Schoolwork by Children (RP-1257).” Hvac&R Research 13 (2): 193–220. doi:https://doi.org/10.1080/10789669.2007.10390951.
- Wargocki, P., D. P. Wyon, Y. K. Baik, G. Clausen, and P. O. Fanger. 1999. “Perceived Air Quality, Sick Building Syndrome (SBS) Symptoms and Productivity in an Office with Two Different Pollution Loads.” Indoor Air 9 (3): 165–179. doi:https://doi.org/10.1111/j.1600-0668.1999.t01-1-00003.x.
- Wargocki, P., D. P. Wyon, and P. O. Fanger. 2000. “Productivity Is Affected by the Air Quality in Offices.” InProceedings of Healthy Buildings 1 (1): 635–640.
- Wiik, R. 2011. “Indoor Productivity Measured by Common Response Patterns to Physical and Psychosocial Stimuli.” Indoor Air 21 (4): 328–340. doi:https://doi.org/10.1111/j.1600-0668.2011.00708.x.
- Willem, H. C. 2006 “Thermal and Indoor Air Quality Effects on Physiological Responses, Perception and Performance of Tropically Acclimatized People.” Doctoral dissertation.
- Wolkoff, P., and G. D. Nielsen. 2001. “Organic Compounds in Indoor Air—their Relevance for Perceived Indoor Air Quality?” Atmospheric Environment 35 (26): 4407–4417. doi:https://doi.org/10.1016/S1352-2310(01)00244-8.
- Wong, L. T., and K. W. Mui. 2009. “An Energy Performance Assessment for Indoor Environmental Quality (IEQ) Acceptance in Air-conditioned Offices.” Energy Conversion and Management 50 (5): 1362–1367. doi:https://doi.org/10.1016/j.enconman.2009.01.005.
- Worrell, E., J. A. Laitner, M. Ruth, and H. Finman. 2003. “Productivity Benefits of Industrial Energy Efficiency Measures.” Energy 28 (11): 1081–1098. doi:https://doi.org/10.1016/S0360-5442(03)00091-4.
- Wyndham, C. H., N. B. Strydom, J. F. Morrison, C. G. Williams, G. A. Bredell, M. J. Von Rahden, L. D. Holdsworth, C. H. Van Graan, A. J. Van Rensburg, and A. Munro. 1964. “Heat Reactions of Caucasians and Bantu in South Africa.” Journal of Applied Physiology 19 (4): 598–606. doi:https://doi.org/10.1152/jappl.1964.19.4.598.
- Wyon, D. P. 2004. “The Effects of Indoor Air Quality on Performance and Productivity.” Indoor Air 14 (7): 92–101. doi:https://doi.org/10.1111/j.1600-0668.2004.00278.x.
- Xue, P., C. M. Mak, and Z. T. Ai. 2016. “A Structured Approach to Overall Environmental Satisfaction in High-rise Residential Buildings.” Energy and Buildings 116: 181–189. doi:https://doi.org/10.1016/j.enbuild.2016.01.006.
- Yang, L., H. Yan, and J. C. Lam. 2014. “Thermal Comfort and Building Energy Consumption Implications–a Review.” Applied Energy 115: 164–173. doi:https://doi.org/10.1016/j.apenergy.2013.10.062.
- Yun, H., I. Nam, J. Kim, J. Yang, K. Lee, and J. Sohn. 2014. “A Field Study of Thermal Comfort for Kindergarten Children in Korea: An Assessment of Existing Models and Preferences of Children.” Building and Environment 75: 182–189. doi:https://doi.org/10.1016/j.buildenv.2014.02.003.
- Zanobetti, A., M. J. Canner, P. H. Stone, J. Schwartz, D. Sher, E. Eagan-Bengston, K. A. Gates, L. H. Hartley, H. Suh, and D. R. Gold. 2004. “Ambient Pollution and Blood Pressure in Cardiac Rehabilitation Patients.” Circulation 110 (15): 2184–2189. doi:https://doi.org/10.1161/01.CIR.0000143831.33243.D8.
- Zeier, H., P. Brauchli, and H. I. Joller-Jemelka. 1996. “Effects of Work Demands on Immunoglobulin A and Cortisol in Air Traffic Controllers.” Biological Psychology 42 (3): 413–423. doi:https://doi.org/10.1016/0301-0511(95)05170-8.
- Zhang, H., E. Arens, D. Kim, E. Buchberger, F. Bauman, and C. Huizenga. 2010. “Comfort, Perceived Air Quality, and Work Performance in a Low-power Task–ambient Conditioning System.” Building and Environment 45 (1): 29–39. doi:https://doi.org/10.1016/j.buildenv.2009.02.016.
- Zhang, X., P. Wargocki, and Z. Lian. 2016. “Human Responses to Carbon Dioxide, a Follow-up Study at Recommended Exposure Limits in Non-industrial Environments.” Building and Environment 100: 162–171. doi:https://doi.org/10.1016/j.buildenv.2016.02.014.
- Zhang, X., P. Wargocki, and Z. Lian. 2017. “Physiological Responses during Exposure to Carbon Dioxide and Bioeffluents at Levels Typically Occurring Indoors.” Indoor Air 27 (1): 65–77. doi:https://doi.org/10.1111/ina.12286.
- Zhang, Y. 2015. “Design Criteria of Built Thermal Environment for Hot Summer & Warm Winter Zone of China.” Building and Environment 88: 97–105. doi:https://doi.org/10.1016/j.buildenv.2014.11.015.
- Zomorodian, Z. S., M. Tahsildoost, and M. Hafezi. 2016. “Thermal Comfort in Educational Buildings: A Review Article.” Renewable and Sustainable Energy Reviews 59: 895–906. doi:https://doi.org/10.1016/j.rser.2016.01.033.