
 ?Mathematical formulae have been encoded as MathML and are displayed in this HTML version using MathJax in order to improve their display. Uncheck the box to turn MathJax off. This feature requires Javascript. Click on a formula to zoom.
ABSTRACT
The accident rate in the Korean construction industry is rapidly increasing each year. In particular, the mortality rate from human accidents in construction is very high compared to that of other industries. This indicates that the safety activities carried out at the national level have not been effective in reducing the accident rate. To resolve these problems, the risk factors for human accidents should not only be forecasted in advance, but should also be controlled, monitored, and managed from the commencement to the completion of construction projects. However, most studies on this topic have only listed the importance of risks based on the frequency of safety accidents rather than providing a quantitative analysis. Therefore, it is necessary to develop a model that can analyze and quantify the pattern of human accident risks. The purpose of this study is to develop a quantification model for human accidents in South Korean construction sites. To this end, insurance claim payout data were collected and analyzed to develop a risk quantification model using a Monte Carlo simulation. The results will be used as base data to develop a construction site safety management checklist and human accident prediction model.
1. Introduction
The accident rate in the Korean construction industry is rapidly increasing each year (Yu, Son, and Kim Citation2016). In particular, the mortality rate from human accidents in construction is very high compared to that of other industries (Hwang and Lee Citation2004). According to the Korea Occupational Safety and Health Agency (KOSHA), 26,570 of the 90,656 industrial disaster victims in 2016 were construction workers. This represents a 5.7% increase from the previous year and is the highest rate at 29.3%(Lee Citation2020a). The death toll is 554 out of total 1,777, the highest rate at 31.2%(Lee Citation2020b). This means that safety activities carried out at the national level, such as introducing a process safety management system, building a comprehensive risk management system, creating a clean workplace, financing an industrial accident prevention facility, and focusing on providing support for sectors that are vulnerable to industrial accidents, were not significantly effective in reducing the accident rate (Yoon Citation2015). Research in various fields has attempted to resolve these problems (Go, Song, and Lee Citation2005; Yang, Park, and Lee Citation2009; Yi Citation2001). For example, Koh Seong-seok et al. (2004) reported the risk level of different types of construction based on accidents that occurred in Korean construction sites over 11 years from 1992 to 2000; Yang Yoon-seok et al. (2009) estimated occupation-specific risk scores by analyzing injury and death cases for each occupation in Korean construction sites over 3 years from 2005 to 2007(Yang, Park, and Lee Citation2009); and Lee Gyu-jin (2001) identified the frequency and causes of fall accidents at construction sites by work process (time), workplace (space), and workers (resources) and assigned importance by factors (Yi Citation2001). However, most of these studies were limited to process-related risks or only suggested the importance of risk factors based on the frequency of safety accidents without quantitatively analyzing their use and risks.
To reduce industrial accidents in Korean construction sites, the risk factors for human accidents should not only be forecasted in advance, but should also be controlled, monitored, and managed throughout the entire construction project. To this end, a human accident prediction model that can analyze and quantify the pattern of human accident risks must be established. Therefore, the purpose of this study is to develop a quantification model for human accidents in South Korean construction sites. It is expected that the results of this study will contribute to establishing academic grounds for qualifying human accident risk factors and reducing the accident rate in construction sites. This will also support the development of a construction site safety management checklist and human accident risk management model.
As shown in , the quantification model of human accidents is developed in five steps. First, earlier studies conducted at home and abroad were investigated to define industrial accidents at construction sites. Second, data were collected to analyze human accident patterns using insurance company A’s compensation payout for human accidents that occurred in Korean construction sites over 14 years, from 2001 to 2014. Third, descriptive statistics were performed using the collected data to identify the types and characteristics of human accidents by pattern. Fourth, the probability of events according to accident patterns and insurance payout parameters were estimated to quantitatively analyze human accident patterns. Fifth, a Monte Carlo simulation was performed on the estimated population to analyze the distribution of human accidents by pattern.
Figure 1. Methodology
2. Theoretical consideration
2.1. Earlier studies
In the Korean literature, Koh Seong-seok et al. (2004) analyzed industrial accidents in Korean construction sites and identified accident risks by construction type. The results of their work showed that the incidence of accidents in formwork, building work, and steel-frame work were 17.4%, 11.6%, and 11.0%, respectively, meaning that more than one industrial accident occurred monthly (Go, Song, and Lee Citation2005). Yang Yoon-seok et al. (2009) analyzed injury and death cases by occupation that occurred in Korean construction sites over 3 years from 2005 to 2007 and estimated occupation-specific risk scores using risk plane and index of relative risk for a given trad (IRR), which are industrial accident assessment techniques. Painters, waterproof workers, masons, electricians, and welders were found to be high-risk occupations, suggesting that accident prevention effects would be greatly improved if these occupations were prioritized for safety management (Yang, Park, and Lee Citation2009). Lee Gyu-jin (2001) analyzed the frequency and causes of fall accidents at construction sites by work process (time), workplace (space), and workers (resources) and assigned their importance by safety management factors. They found that fall accidents most often took place during frame work, followed by general work, electric work, and exterior painting, and mostly occurred at the opening/end areas, followed by temporary structures and equipment/instruments. Meanwhile, the main causes were poor installation and the lack of installation of safety facilities (Yi Citation2001).
In the literature from outside South Korea, Abdelhamid & Everett (Citation2000) suggested the use of Accident Root Causes Tracing Model (ARCTM) to respond to risk factors in construction sites. The authors proposed that safety management procedure must be designed to distinguish unsafe conditions and prevent potential accidents in advance, and management must focus on and value safety by strengthening education programs for workers (Abdelhamid and Everett Citation2000). Hamid et al. (Citation2008) carried out a survey to promote safety performance and analyzed the main factors and causes of safety accidents. They found that the main factors include human factors, non-compliance with work procedures, workplace management, and defects in safety equipment. Further, the main causes include operator’s skills, worker’s failure to comply with work procedures, work requiring a mastery of skills, and the failure to wear safety equipment (Hamid, Majid, and Singh Citation2008). Meng et al. (Citation2010) applied seven factors such as workers’ age, collision unit, vehicle type, drinking, lighting status, collision type, and severity to a tree diagram and tried to identify all possible accident scenarios. They also suggested a new probabilistic quantitative risk assessment model to predict casualty risk by combining accident frequency and long-term collision in the workplace (Meng, Weng, and Qu Citation2010).
As stated above, various studies have been conducted to reduce the accident rate on construction sites. However, most studies categorized accident risks by work types and specific works or applied a deterministic method that evaluates the importance of risks using frequency instead of a probabilistic method. The analysis method-applied safety management system cannot systematically respond to risks, which change as the construction environment changes. Therefore, this study intends to develop a model to analyze and quantify patterns of human accident risks.
2.2. Monte Carlo simulation
A probabilistic approach should be taken to human accidents that occur in construction sites, since the damages and probability of such events do not have one value (Kim, Yu, and Kim Citation2012). As shown in , the analytical approach of the function is divided into a definite model and a probability model, with a clear difference between the two models (Jang Citation2006).
Figure 2. Analytical approach models (Kim, Yu, and Kim Citation2012; Jang Citation2006; Lee, Son, and Kim Citation2003)
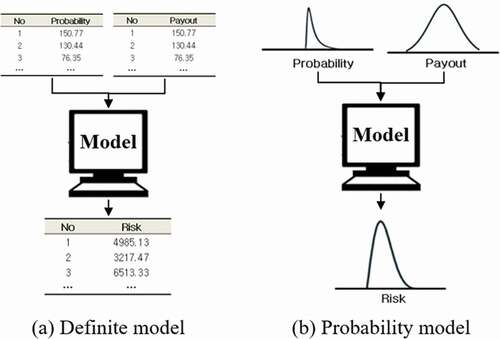
If fixed numbers are input into the model, as shown in ), a single solution is drawn by a functional formula between the two variables. On the contrary, as shown in ), the probability model can produce a solution that satisfies the condition after performing a simulation by repeatedly generating random numbers as parameters or variables (Lee, Son, and Kim Citation2003).
The Monte Carlo simulation is a probability model and a simulated sampling technique that randomly selects parameters for use in the simulation from a probability distribution (Han and Kim Citation2010). Since the solution derived from the Monte Carlo simulation is presented in a probability distribution form with the mean value and variance rather than a single value, it can predict how it will change in various environments (Binder et al. Citation1993). This study, therefore, applied the Monte Carlo simulation to develop a quantification model of human accidents.
3. Data collection
3.1. Definition of human accident patterns
In this study, 156 data of human accidents that took place in construction sites and insurance claim payouts made for 14 years from 2001 to 2014 from insurance company A were collected. Among them, a total of 154 data were selected, excluding cases of explosions, getting stuck and drowning, and electric shocks, which had 0 or 1 incidents. Cases with 0 or 1 incidents were excluded because a probability distribution could not be defined since the variance of independent variables (accident pattern) was 0 in the Monte Carlo simulation (Yu et al. Citation2017). Therefore, 154 data with more than 2 incidents were selected and classified into 5 kinds of accident patterns such as 1) slip, 2) fall, 3) pin or overturning, 4) impact or graze, and 5) crumble.
As the causes of accidents defined in the KOSHA’s Report on the Cause of Industrial Accidents and the classification criteria of the KOSHA Guide G-08-2006, which provides guidelines for the classification of industrial disaster records, are quite different, it was possible that the meaning of human accident patterns could be obscured (Lee Citation2018).
For this reason, this study defines human accident patterns based on the criteria provided by the KOSHA’s report on the Cause of Industrial Accidents (Korea Occupational Safety & Health Agency Citation2020) as shown in . Impact and graze had their own definitions, but here, they were grouped in the same category since they occurred in a series in most cases.
Table 1. Descriptive statistics based on accident pattern (Unit: USD)
3.2. Descriptive statistics
In order to quantify human accident patterns, technical statistics and accident type analysis must first be conducted by accident pattern. Descriptive statistics of accident frequency, average compensation payment, and deviation by patterns are summarized in .
Table 2. Definition of accident pattern (Lee Citation2018; Korea Occupational Safety & Health Agency Citation2020)
Table 2. Safety accident pattern code (Unit: USD)
As a result, the highest frequency was slip, followed by pin or overturning, and impact or graze, while the highest average compensation payment was fall.
3.3. Cause analysis of human accidents
To analyze the characteristics of human accident patterns, accidents were divided into three categories: accumulate construction rate, season, and location. Then, descriptive statistical analysis was performed and the results are shown in Table 3.
(1) Slip
Slip accidents are often caused by carelessness in the surrounding environment. Slips can always occur by stumbling over objects or slipping on an icy road. In particular, Kim et al. reported that slips happen more during the spring and summer than winter because workers tend to reduce their speed on slippery roads and pay more attention to safety in winter (Kim et al. Citation2011). Additionally, slipping on ground hardened by frost in fall or winter may cause more serious injuries, which raises the amount of compensation payment (Suh, Eo, and Jung Citation2005).
(2) Fall
Fall accidents mainly occur due to poor safety facilities. Falls may cause more serious injuries than other types of accidents and lead to death at worst. In the case of accumulated construction rate, most fall accidents occur in the 80%–100% construction section, and compensation payments were higher in the 60%–100% section, which is the later part of construction project, than in the 20%–60% section. This is because as a construction project progresses, buildings rise higher and a fall can result in a more catastrophic injury (Suh, Eo, and Jung Citation2005). In case of location, fall accidents that occur in cities accounted for 63.6% and compensation payment amounted to KRW 41.51 billion, which is the highest and largest compensation amount. Many high-rise buildings such as apartment buildings and studio apartments are currently under construction in cities and the higher the building rises, the more severe the injury. Hence, compensation payment was found to be the highest in cities.
(3) Pin or Overturning
Pin or overturning happens mostly when a safety fence falls or construction machinery and mobility equipment are overturned. Pin or overturning accidents occurring in cities also accounted for 52.1%. Particularly in cities, space-related restrictions related to the utilization of the construction site and the scope of open storage yard increase crowdedness in the working site. According to Jang Chul-gi et al. (2008), crowdedness in a working site poses danger in working, and intensified crowdedness leads to a higher possibility of accidents (Chang, Sung, and Park Citation2008).
(4) Impact or Graze
Impact or graze accidents caused a higher average amount of compensation payment during spring and winter. This is believed to be because wind flows faster during spring and winter in Korea than in other seasons (Byun, Choi, and Seo Citation2010).In the case of collision with an object flying on a gust, the flying object’s speed is determined by wind speed; the faster the object flies, the more severe the injury becomes. Therefore, the average amount of compensation payment seems to be higher.
(5) Crumble
There were only five cases of crumble accidents and the accident frequency was 3.2%. Compensation payment also amounted to USD 5,693, which is the lowest among accident types. In the case of accumulate construction rate, a crumble occurred only in the 60%–100% section, the later part of construction project. In this section, various types of construction work and many materials such as frames, curtain walls, and finishes are mobilized, so the construction site becomes more crowded. It is therefore believed that intensified crowdedness in a construction site leads to an increased possibility of accidents related to machinery and mobility equipment.
4. Development of a quantification model for human accidents on construction sites
4.1. Setting up a probability model
To evaluate the risk of safety accidents by pattern using the Monte Carlo simulation, the formula (1) below was created to quantify the causes of human accidents.
R = Risk by accident type
P = Probability of accident
C = Compensation payment by accident type
Formula (1) produces the level of risk by accident type (R) by setting the probability of accident (P) and compensation payment by accident type (C) as variables. Here, P refers to the probability of human accidents that may occur in a single project and C refers to the damages for human accidents by pattern.
In addition, the distribution fitting function of the Crystal Ball program was utilized to establish a probability distribution model and estimate variables from actual data (a method to review historical data). Additionally, a distribution pattern was determined and Anderson-Darling tests were carried out. After performing the goodness of fit test for distribution, if A-D statistic was less than 1.50 and P-value was over 0.05, the fit was considered good (Jornadan Citation2005).
4.2. Probability distribution of accident
When performing the Monte Carlo simulation, the probability distribution of variables must first be assumed. This study assumed the probability distribution of parameters based on data collected. Formula (2) presents the probability of accident (P) that may occur in a single project for one year in the form of a functional formula.
P = Probability of accident
F = Frequency of accidents occurring in one year
A = Ratio by accident type
The frequency of accidents in each project was analyzed and the frequency calculated was divided by the project period to produce the frequency of accidents (F) that may occur in a single project every year. As a result, the average frequency of accidents in 78 projects was 0.83 and the standard deviation was 0.93. Further, the result of estimating parameters using the goodness of fit test for distribution presented a log distribution, and the fit was verified as good with A-D value of 0.49 and P-value of 0.14.
The probability of an accident (P) that may occur in a single project was estimated by multiplying the probability distribution (F) in Formula (2) and the ratio by accident type (A) in . The Monte Carlo simulation was conducted 100,000 times and the results are shown in .
Table 4. Occurrence rate based on accident pattern (%)
Table 5. Descriptive analysis of simulation results based on accident pattern
4.3. Probability distribution of damages
More than 15 data points should be secured to utilize the distribution fitting function of the Crystal Ball program. More than 15 data points were secured for codes 1, 3, and 4, so the distribution fitting function was implemented. It presented a log normal distribution and shows the characteristics of the probability distribution of codes 1, 3, and 4.
Table 6. Probability distribution
However, for codes 2 and 5, it was impossible to estimate the probability distribution and they were assumed to have a normal distribution due to lack of data. Nam Won-ho et al. (2012) reported that if the accurate probability distribution cannot be identified, a normal distribution is generally used (Nam et al. Citation2012). Here, when assuming the probability distribution of parameters based on the collected data, it was necessary to check whether the data satisfied normality (Kim, Park, and Lee Citation2008).
y = Log function data
x = Insurance claim payout
Normality for codes 2 and 5 was tested and found unsatisfactory. Therefore, the Shapiro–Wilk test, which is a test of normality, was performed after replacing the data using a log function like Formula (3). The Kolmogorov–Smirnov test is generally used when the number of data points exceeds 200. In this study, the Shapiro–Wilk test was used because the number of data points was less than 2,000(Choi Citation2015).
The results of the test-retest show that normality was satisfied, as shown in . The probability distribution patterns for codes 2 and 5 were USD 4,171 on average with an standard deviation (SD) of USD 886 and USD 1,888 on average with an SD of USD 2,676, respectively. Based on the mean value and SD derived, a normality distribution was assumed and the simulation was performed 100,000 times. The trial value derived went through inverse-replacement by an exponential function, as shown in Formula (4). The reversely replaced data refer to parameters derived through simulation, namely the estimated amount of compensation payment.
Table 7. Normality test (Shapiro–Wilk)
y = Estimated amount of compensation payment,
x = Loot function data.
The probability distribution was a normal distribution with USD 2,034 on average with an SD of USD 8,388 for code 2 and USD 4,422 on average with an SD of USD 2,676 for code 5. The probability distribution of compensation payment and parameters for codes 2 and 5 were estimated based on the data collected. The simulation was performed 100,000 times by generating random numbers that follow the estimated probability distribution. The results are shown in .
Table 8. Descriptive analysis of simulation results based on payment by accident pattern
4.4. Results of casualty risk calculation
Risks present in construction sites are uncertain, and it is very difficult to accurately predict them. Therefore, this study estimated the probability of accidents (frequency) and compensation payment by accident codes using the Monte Carlo simulation. Considering the derived values, the level of risk by accident code was quantitatively analyzed using Formula (1) through (4).
shows the estimated values of risk levels derived through simulations. The probability distribution has these mean values and variance.
Figure 3. Simulation results regarding human accident patterns
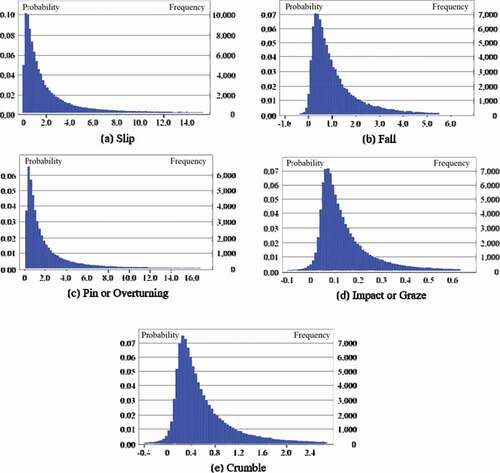
In , the x-axis indicates the level of risk (probability of accident x compensation payment) and the y-axis indicates the probability of the occurrence of an accident. also presents statistic values by human accident risks.
Table 9. Descriptive analysis of simulation results regarding human accident patterns
In , the mean values are used as a reference to list the risk priority (importance) of human accidents. Standard deviation and kurtosis refer to the variance of each risk and are used as criteria to predict the extent to which each risk may change in construction sites in which working environments dynamically change.
The maximum value is used as a reference to list the probability of high-risk accidents. The simulation results were used to analyze the level of the risk of human accidents. The details are as follows:
(1) Level of Risk
The mean values of risks were compared by accident types. As a result, pin or overturning (2.74) and slip (2.44) were at higher risk than fall (1.33), impact or graze (0.576), and crumble (0.130). This indicates that safety management in construction sites should pay greater attention to risks of pin or overturning and slip than other accident types.
(2) Variance of Risk
Standard deviation and kurtosis can be used to analyze the variance of risk. A huge variance was found in all accident types. If the variance is large, the range between the minimum value and maximum value becomes wider, but the wide range is effective in testing extreme values (Jornadan Citation2005). As a result, variance was largest in pin or overturning (5.93, 325.91), followed by slip (4.973, 3044.76), fall (1.594, 62.9), impact or graze (0.768, 46.79), and crumble (0.179, 123.25). This means that pin or overturning has a wider context of risk than other accident types.
(3) Maximum value
The probability of extremely high-risk accidents can be predicted using the maximum values of risks derived. This was highest in slip (639.486) and pin or overturning (294.399), followed by fall (46.211), impact or graze (20.751), and crumble (9.163). This implies that when comparing human accident types in extreme situations, slip and pin or overturning would be far more threatening than other accident types.
5. Conclusion
This study aimed to develop a model to analyze and quantify the pattern of human accident risks. To this end, data from human accidents that have occurred in South Korean construction sites and insurance claim payouts made over 14 years were collected from insurance company A. Based on the data, descriptive statistics were carried out and the characteristics of human accident types were identified. Moreover, the Monte Carlo simulation was utilized to quantify the risk of each human accident and analyze the characteristics of distribution by accident type. The results showed that it was possible to quantify human accident risks and predict how such risks change in various situations.
First, the mean value of risks by accident causes was higher in pin or overturning (2.74) and slip (2.44) than fall (1.33), impact or graze (0.576), and crumble (0.130). This indicates that more attention should be given to pin or overturning and slip compared to other accident types when performing safety management in construction sites.
Second, the variance of accident risks for all causes was very high in pin or overturning (5.93, 325.91), followed by slip (4.973, 3044.76), fall (1.594, 62.9), impact or graze (0.768, 46.79), and crumble (0.179, 123.25). This indicates that pin or overturning and slip have a wider context of risks than other accident types.
Third, the maximum value of risk was higher in slip (639.486) and pin or overturning (294.399) than fall (46.211), impact or graze (20.751), and crumble (9.163). This indicates that slip and pin or overturning are far more threatening than other accident types in extreme situations.
The results of this study contribute to the establishment of academic grounds for the qualification of human accident risk factors and support the development of a construction site safety management checklist and, ultimately, a human accident risk management model.
Disclosure statement
No potential conflict of interest was reported by the authors.
Additional information
Funding
Notes on contributors
Hanguk Ryu
Prof. Hanguk Ryu got the Ph.D. from Seoul National University then he worked as a professor in Changwon National University and is working as a professor in Sahmyook University, Republic of Korea. His major area is construction management. Ryu has concentrated on the research such as development of construction management technology, effective design management, and construction information technology.
Sungeun Ha
Sungeun Ha is studying in architectural engineering from University of ulsan, as a student of master course, and is currently a researcher at University of Ulsan in South Korea. In the field of construction project safety management and construction engineering, he actively conducts research on simulation, optimization and risk management and qualitative analysis of safety accidents and human damage using statistical analysis.
Kiyoung Son
Prof. Kiyoung Son got the Ph.D. from Texas A&M University then he is working as a professor in University of Ulsan, Republic of Korea. His major area is construction management. Son has concentrated on the research such as development of sustainable construction technology and management, simulation, optimization and risk management, construction information technology.
Seunghyun Son
Seunghyun Son is studying in architectural engineering from Kyung Hee University, as a student of doctoral course, and is currently a lecturer at University of Ulsan in South Korea. In the field of construction project management and construction engineering, he is actively conducting research on simulation, optimization, and risk management of building projects and qualitative analysis using machine learning technique. In addition, he has participated in the development of reinforcement method against seismic impact and free-form concrete panel production technology for about five years.
References
- Abdelhamid, T. S., and J. G. Everett. 2000. “Identifying Root Causes of Construction Accidents.” Journal of Construction Engineering and Management 126 (1): 52–60. doi:https://doi.org/10.1061/(ASCE)0733-9364(2000)126:1(52).
- Binder, K., D. Heermann, L. Roelofs, A. J. Mallinckrodt, and S. McKay. 1993. “Monte Carlo Simulation in Statistical Physics.” Computers in Physics 7 (2): 156–157. doi:https://doi.org/10.1063/1.4823159.
- Byun, J. Y., Y. J. Choi, and B. K. Seo. 2010. “Characteristics of a Wind Map over the Korea Peninsula Based on Mesoscale Model WRF.” Asia-Pacific Journal of Atmospheric Sciences 20 (2): 195–210.
- Chang, C. K., Y. K. Sung, and H. S. Park. 2008. “Benefits of Prework and Suggestion for Successful Implementation.” Journal of the Architectural Institute of Korea (Structure & Construction) 24 (5): 157–164.
- Choi, E. 2015. “Type of Statistical Methods and Errors in the Journal of Korean Academy of Fundamentals of Nursing.” Journal of Korean Academy of Fundamentals of Nursing 22 (4): 452–457. doi:https://doi.org/10.7739/jkafn.2015.22.4.452.
- Go, S. S., H. Song, and H. M. Lee. 2005. “Development of the Safety Information Management System according to the Risk Index for the Building Construction Work.” Journal of the Architectural Institute of Korea (Structure & Construction) 21 (6): 113–120.
- Hamid, A. R. A., M. Z. A. Majid, and B. Singh. 2008. “Causes of Accidents at Construction Sites.” Malaysian Journal of Civil Engineering 20 (2): 242–259. doi:https://doi.org/10.11113/mjce.v20n2.219.
- Han, H. S., and C. Y. Kim. 2010. “Applying Monte Carlo Simulation for Supporting Decision Makings in Software Projects.” Journal of the Korea Society of IT Services 9 (4): 123–133.
- Hwang, J. S., and C. S. Lee. 2004. “Weight Evaluation of Risk Factors for Early Construction Stage.” Korean Journal of Construction Engineering and Management 5 (2): 115–122.
- Jang, M. H. 2006. “Development of Schedule Risk Simulation System Using a Stochastic Method.” Journal of the Architectural Institute of Korea (Structure & Construction) 22 (8): 117–124.
- Jornadan, M. 2005. Analyze Future Risk Using Simulation, 549 p. 1st ed. Seoul: Eretec.
- Kim, D. G., J. S. Park, and J. H. Lee. 2008. “Evaluation on Intersection Safety with respect to Signalization and Left-turn Treatments.” Seoul Studies 9 (3): 107–118.
- Kim, G. H., J. H. Yu, and C. D. Kim. 2012. “Forecasting Methods for Monthly Expenditures by Monte-Carlo Simulation Focused on Apartment Housing Project.” Journal of the Architectural Institute of Korea (Structure & Construction) 28 (11): 149–156.
- Kim, H. H., Y. W. Kim, K. A. Cho, M. H. Cho, J. H. Kim, D. Y. Cho, C. Y. Yoo, and J. S. Park. 2011. “A Study on the Prevention of Musculoskeletal Disease in Cleaners.” Journal of the Ergonomics Society of Korea 10 (1): 78–85.
- Korea Occupational Safety & Health Agency. 2020. “KOSHA Guide G-08-2006.” Accessed May 2020. http://www.kosha.or.kr
- Lee, D. J., B. S. Son, and W. Y. Kim. 2003. “A Method of Forecasting EAC (Estimate at Completion) Using Monte Carlo Simulation.” Journal of the Architectural Institute of Korea (Structure & Construction) 19 (9): 137–146.
- Lee, H. S. 2020a. “Current Status of Industrial Accident Occurrence in 2016.” Accessed May 2020. http://www.kosha.or.kr/main.do?chk=1
- Lee, H. S. 2020b. “Current Status of Industrial Accident Occurrence in 2015.” Accessed May 2020. http://www.kosha.or.kr/main.do?chk=1
- Lee, J. 2018. “The Analysis of Significance and Influence Factor on the Injured of Industry Accident.” Journal of the Ergonomics Society of Korea 37 (1): 43–62. doi:https://doi.org/10.5143/JESK.2018.37.1.43.
- Meng, Q., J. Weng, and X. Qu. 2010. “A Probabilistic Quantitative Risk Assessment Model for the Long-term Work Zone Crashes.” Accident Analysis & Prevention 42 (6): 1866–1877. doi:https://doi.org/10.1016/j.aap.2010.05.007.
- Nam, W. H., T. Kim, J. Y. Choi, and J. J. Lee. 2012. “Estimating Vulnerable Duration for Irrigation with Agricultural Water Supply and Demand during Residual Periods.” Journal of the Korean Society of Agricultural Engineers 54 (5): 123–128. doi:https://doi.org/10.5389/KSAE.2012.54.5.123.
- Suh, J. H., E. K. Eo, and K. Y. Jung. 2005. “Original Articles: The Height of Fall as a Predictor of Fatality of Fall.” Journal of the Korea Society of Traumatology 18 (2): 101–106.
- Yang, Y. S., J. H. Park, and C. S. Lee. 2009. “Accident Risk Analysis of Construction Workers by Occupation.” Journal of the Architectural Institute of Korea (Structure & Construction) 25 (10): 149–156.
- Yi, K. J. 2001. “The Origin of Fall Incidents in Construction Sites Classified by Locations and Trades of Concern.” Journal of the Korean Society of Safety 16 (2): 85–90.
- Yoon, H. J. 2015. “Improvement of Construction Safety Management System for the Realization of Safety Society.” Krihs Policy Brief 520: 1–8.
- Yu, Y. J., K. Y. Son, and J. M. Kim. 2016. “Risk Analysis Using Construction Insurance Claim Payouts.” Journal of the Korea Institute of Building Construction 16 (4): 349–357. doi:https://doi.org/10.5345/JKIBC.2016.16.4.349.
- Yu, Y. J., K. Y. Son, T. H. Kim, and J. M. Kim. 2017. “A Risk Quantification Study for Accident Causes on Building Construction Site by Applying Probabilistic Forecast Concept.” Journal of the Korea Institute of Building Construction 17 (3): 287–294. doi:https://doi.org/10.5345/JKIBC.2017.17.3.287.