
 ?Mathematical formulae have been encoded as MathML and are displayed in this HTML version using MathJax in order to improve their display. Uncheck the box to turn MathJax off. This feature requires Javascript. Click on a formula to zoom.
ABSTRACT
To understand the effect of connection type on the seismic fragility of concrete-filled steel tube (CFST) column frame-core tube structures, typical structures with different numbers of storeys (15, 30, 45, and 60) and different types of beam-end connections (rigid connections, hinged connections, and rigid connections with outriggers) are designed. The probabilistic seismic demand models (PSDMs) of the structures are obtained using cloud analysis, and seismic fragility curves based on the mean period and the number of storeys are established. The results show that the differences in the seismic fragilities among the structures with the three types of connections can be effectively determined by the critical inter-storey drift ratio (IDR) and the storey ductility and that the determination method with the critical IDR is relatively simple. The use of beam-end hinges in the 15-storey structure results in an advantageous seismic performance, with a lower probability of exceeding the limit states, and the performance of the 60-storey structure with beam-end hinges is sensitive to spectral acceleration. The spectral acceleration and peak ground acceleration (PGA) can effectively describe the fragility curves based on the number of storeys and the mean period, respectively.
Graphical Abstract
1. Introduction
Concrete-filled steel tube (CFST) frame-core tube structures are widely used in super-high-rise buildings. However, in terms of structural design, the shear ratio of the outer frame often exceeds the code thresholds, necessitating an increase in the stiffness of the outer frame to meet the code requirements. Researchers have argued that this design problem can be circumvented by decreasing the shear ratio of the outer frame and increasing the size of the core tube, thereby improving the collapse resistance of the structure (Lu et al. Citation2019). On this basis, we previously proposed a design solution for a CFST column frame-core tube structure system with adjustable connections, in which all the traditional rigid beam ends of the outer frame are replaced with hinged beam ends so that seismic shear is entirely resisted by the core tube (Zeng, Huang, and Zhou Citation2021). The use of bolted connections (similar to hinged joints) for the outer frame improves the on-site construction efficiency and meets the needs of building industrialization but fundamentally changes the load path between the outer frame and the core tube, calling for an in-depth investigation of the effects of different connection types on the performance of the outer frame (Bai et al. Citation2021; Li and Xie Citation2021).
Seismic damage to high-rise structures concentrates in the structural joints, so connections have become a key issue in seismic design and post-earthquake retrofitting. Peng et al. (Peng, Jinping, and Mahin Citation2020) studied a form of beam-to-column connection consisting of a mechanical hinge combined with a pair of buckling-restrained steel plates, in which the mechanical hinge is used to resist shear and the buckling-restrained steel plates are employed to transfer the bending moment to dissipate the seismic energy through the deformation of the steel plates; this combination ensures that other structural members remain elastic. Garoosi et al. (Moradi Garoosi, Roudsari, and Hashemi Citation2018) proposed two types of replaceable reduced beam section (RBS) connections, which were compared with an ordinary bolted connection and an ordinary RBS connection through experimental investigation and numerical simulation; the results showed that the replaceable RBS connections effectively reduced the damage to the columns and panel zones. Psycharis and Mouzakis (Psycharis and Mouzakis Citation2012) conducted monotonic loading, cyclic loading, and pure shear tests on precast beam and column members with pinned connections to investigate the effects of various parameters on the performance of the connections. Ghayeb et al. (Ghayeb, Hashim Abdul, and Ramli Sulong Citation2017) carried out cyclic loading tests on precast concrete joints and monolithic concrete joints and compared the strength, ductility, and energy dissipation of the joints. The test results showed that the new precast concrete joint for frame structures results in a drift ratio up to 9% and a satisfactory resistance to seismic loads. Sharma et al. (Sharma et al. Citation2021) compared the characteristics of the seismic fragility curves for semi-rigid steel frames subjected to near-field and far-field earthquakes and found that near-field earthquakes with a high directivity ratio led to a higher probability of exceedance than far-field earthquakes.
There have been many studies, including the aforementioned reports, on the seismic capacity and post-earthquake retrofitting of connections, whereas efforts have rarely been devoted to examining the influences of different types of connections on the global seismic-resistance capacity of high-rise structures. The damage mechanism of high-rise structures changes with the connection type; damage indices can be determined to effectively reflect the differences in the structural stress and thus clarify the elastic plastic behaviour of high-rise structures during earthquakes. Fragility analysis can describe the damage probability of the structure, which helps to realize the difference in the connections in probabilistic terms and to explore the effectiveness of different control induces. This work provides a foundation for the performance-based seismic design method.
In this present study, seismic fragility analysis is conducted to investigate the seismic failure probability of CFST column frame-core tube structures at different performance levels. The types of connections of the outer frame are divided into traditional types (rigid beam-end connections and rigid beam-end connections with outriggers) and a new type (hinged beam-end connections). The seismic failure probability curves of structures with different types of connections are analysed to provide a reference for seismic design in the future.
Research results of fragility analysis for composite steel-concrete structures have been widely used for seismic damage assessment. Pnevmatikos et al (Pnevmatikos, Papagiannopoulos, and Papavasileiou Citation2019) compared the fragility curves of mixed concrete/steel moment-resisting framed structures with those of concrete or steel framed structures and found that mixed concrete/steel framed structures designed according to the current code are less vulnerable. Mohammadgholibeyki et al (Mohammadgholibeyki and Epackachi Citation2020) developed drift-based fragility functions by statistically analysing the test data of 60 steel-plate concrete composite shear walls and indicated that the aspect ratio and axial load ratio have a significant effect on the fragility function. Xu et al (Chengxiang et al. Citation2018) carried out a seismic fragility analysis of steel-reinforced concrete frame structures with OpenSees software and investigated the differences in the seismic fragility curves based on the peak inter-storey drift ratio (IDR) and two damage indices, demonstrating that the analysis based on the damage index of the members is more cost-effective, practical, and robust. Xiong et al (Xiong, Xinzheng, and Lin Citation2019) executed the fragility analysis of the frame-shear wall structure using the storey curvature as the engineering demand parameter (EDP) and determined and validated the damage limit state (LS) of the shear wall. Skalomenos et al (Skalomenos, Hatzigeorgiou, and Beskos Citation2015) researched the seismic performance of plane moment-resisting frames composed of steel I-beams and CFST columns and established fragility curves based on the peak ground acceleration (PGA) and spectral acceleration.
2. Structural models and parameter selection
2.1. Structures with different types of connections
In total, 12 structures are designed considering combinations of three different types of connections (hinged beam-end connections, rigid beam-end connections, and rigid beam-end connections with outriggers, whose corresponding structures are hereafter called hinged-connection structures, rigid-connection structures and outrigger structures) with four different structure heights (15, 30, 45, and 60 storeys). The ground motion intensity levels conforming to an extreme value type I distribution (shown in Section 2.3) with seven means, each with 120 PGA samples, are considered. The structural analysis software CANNY (Guobin et al. Citation2019) is used to construct the numerical structural models, which have been verified by testing (Zeng, Huang, and Zhou Citation2021), and to carry out a total of 10,080 non-linear dynamic time history analyses.
Figure 1. Diagram of structural models: (a) elevations of structures with different heights; (b) plan layout; (c) elevation of outrigger storey.
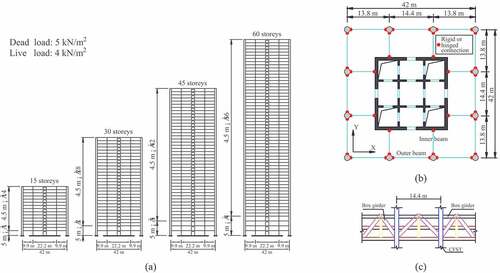
Figure 2. Uniaxial spring model of beams.
Figure 3. Column element model.
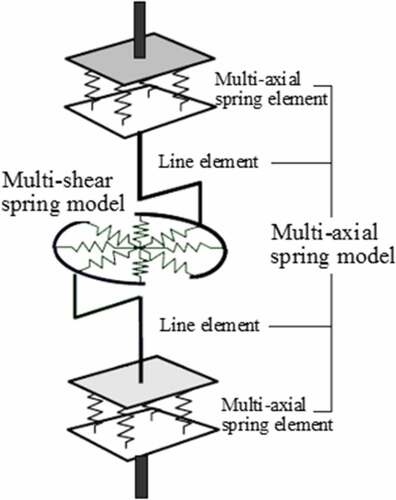
Figure 4. Rigid wall-beam model: (a) wall model with a rigid wall-beam; (b) nodal rotations equal to the wall rotation.
The overall dimensions of the structures refer to the model structures shown in . According to technical specifications (DBJ15-92-Citation2013 Citation2013), the structure is designed for seismic conditions corresponding to a seismic precautionary intensity of 7, site class III, and second seismic design group. Grade C60 concrete (with a cube compressive strength of 60 MPa) and HRB400 reinforcing steel (with a standard yield strength of 400 MPa) are used in the structures. show the design parameters of various structural models. The outriggers of the outrigger structure are located in storeys 6–8 and 11–13 of the 15-storey model, storeys 14–16 and 21–23 of the 30-storey model, storeys 21–23 and 33–35 of the 45-storey model, and storeys 29–31 and 44–46 of the 60-storey model. For the hinged-connection structure, when the core tube thickness is appropriately increased, the column and beam section sizes of the outer frame are reduced accordingly.
Table 1. CFST columns and core tube sections of the rigid-connection, hinged-connection and outrigger structures.
Table 2. Dimensions and reinforcement ratios of the steel beams.
Table 3. Reinforcement ratio of the core tube (%).
Table 4. Reinforcement of coupling beams for rigid-connection, hinged-connection and outrigger structures.
The uniaxial spring model is adopted to simulate the forces in the steel beams and coupling beams, as shown in . The CFST columns employ the multi-axial spring model in to consider the coupling effect of the bending moment and axial force and to consider the seismic bidirectional effect of bending and shear. The shear wall model allows in-plane bending and shear resistance. The rigid diaphragm assumption leads to the upper and lower ends of the shear wall model using rigid beams, and the side and middle columns of the model simulate the in-plane seismic performance, as shown in .
As shown in , the periods in the horizontal directions are almost equal to the structural symmetry, and the fundamental periods T1 of the 15-storey structure with different types of connections are similar. For structures with other numbers of storeys, the more storeys there are, the more pronounced the difference in T1, which indicates the strong influence of this type of connection. During the structural design process, the stiffness of the outer frame in the hinged-connection structure is reduced while increasing the core tube stiffness, which possibly results in its fundamental period being slightly lower than that of the rigid-connection structure. It is useful to examine the differences among the three types of connections and make subsequent comparisons. According to the magnitude of the translational periods, the outrigger structure has the largest stiffness, followed by the rigid-connection structure, and the hinged-connection structure is most flexible, as expected. The torsional periods of the outrigger structure and rigid-connected structure are similar due to the lower influence, and the hinged-connection structure with the highest stiffness core tube has the smallest torsional period.
Table 5. Vibration modes of the finite element models in CANNY.
The Rayleigh damping corresponding to a 5% damping ratio is applied in the first and fifth modes in this paper, and the corresponding simulation result errors, verified in the test (Zeng, Huang, and Zhou Citation2021), are relatively stable, which indicates that the spurious damping force does not affect the results too much. When the structure enters the elastic-plastic phase, the damping generated by the non-structural members is difficult to reflect in the numerical model, and the presence of the spurious damping force can consider this part of the damping force to alleviate the deviations in the computed results. This damping is also frequently used in related papers, and its results are accepted (Trautner et al. Citation2019; Birzhandi and Halabian, Citation2018; Moniri Citation2017).
Figure 5. Typical wall and coupling beam details: (a) construction plan of the core tube; (b) section of the coupling beam.
2.2. Selection of the ground motion records
A total of 12 ground motion records from the Centre for Engineering Strong Motion Data are selected (CESMD Center Management Group Citationn.d.). The basic information about these ground motion records is shown in . Based on the test phenomenon, ground motions with longer periods cause greater damage to the hinged-connection structures (Zeng, Huang, and Zhou Citation2021). In this paper, the structures are subjected to ground motions with different frequencies, evaluated by the mean periods , and the results are analysed to understand the differences in the seismic responses.
Table 6. Ground motion characteristics.
The principles of seismic selection require that ground motions be the effective motivation for the structural response, and the range of earthquake frequencies should be represented by the ground motions selected. Therefore, the bracketed duration (Bommer and MARTÍNEZ-PEREIRA Citation1999) (the threshold value is 5% of the PGA) of ground motions is generally 5 times the T1 of the structures, and the values of , an index calculated using EquationEquation (1)
(1)
(1) (Rathje, Abrahamson, and Bray Citation1998) to describe the seismic frequency, conform to a uniform distribution between 0 and 1.2 s. Bidirectional seismic excitations are adopted, where the ratio of the PGAs in the primary and secondary directions is 1:0.85.
To investigate the effects of , the ground motion records are divided into four groups. Group 1 contains record nos. 1–3 (the low-period group with 0 <
< 0.3 s), Group 2 includes record nos. 4–6 (the short- to medium-period group with 0.3 <
< 0.45 s), Group 3 consists of record nos. 7–9 (the medium- to long-period group with 0.45 <
< 0.6 s), and Group 4 contains record nos. 10–12 (the long-period group with 0.6 <
< 1.2 s).
where is the mean period, Ci is the Fourier spectrum value corresponding to each frequency and fi is a frequency between 0.25 Hz and 20 Hz.
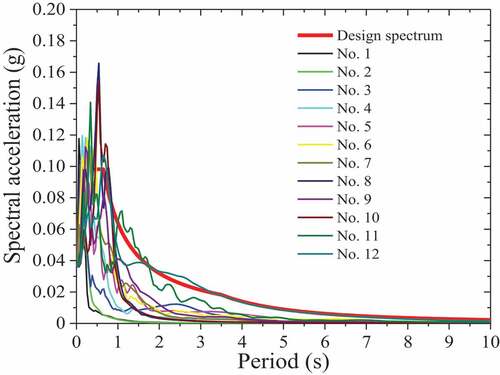
A comparison between the long-period design spectrum (DBJ15-92-Citation2013 Citation2013) and the response spectra of the 12 ground motion records is shown in , which describes the acceleration response spectra for every ground motion with a PGA equal to 0.035 g. Typically, to reflect the seismic frequencies of most natural seismic waves and study the influence of the seismic frequency on the structures, the whole waves selected do not have larger spectral values at periods greater than 1 s. The numbers of the ground motions increase from the smallest to the largest mean period, so that the No. 12 ground motion in Group 4 representing long-period waves has the largest spectral acceleration value at periods greater than 1 s. The input seismic wave is amplified to the desired PGA (shown in Section 2.3) to derive the fragility curves.
The T1 values of structures with 15 to 60 storeys, representing a wide range of structures in terms of height, are scattered on the platform and descent stage of the design spectrum so that the effects of the spectral acceleration on the structures of different heights can be fully reflected. The response spectra for the ground motion records are not matched to consider the influence of , which results in a uniform distribution. As a result, the results are representative and reveal the corresponding regularities.
Figure 6. Response spectra for the selected ground motion records.
2.3. Random variable sampling
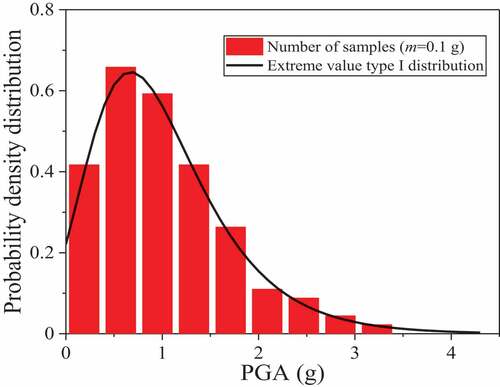
The PGA is randomly selected using MATLAB according to the extreme value type I distribution with parameters and
. The mean values of PGA were set to 0.05 g, 0.1 g, 0.3 g, 0.5 g, 0.7 g, 0.9 g, and 1.2 g, and 120 samples were generated at each level. According to the extreme value type I distribution used in the literature (Zeng, Huang, and Zhou Citation2019), the ratio of the mean to the standard value is set to 0.75, and the coefficient of variation (COV) is set to 0.73. Other parameters are shown in , and the fitting effect between the sampled PGAs and the data obtained theoretically according to the extreme value type I distribution is illustrated in .
Table 7. Parameters of the extreme value type I distribution.
An increase in the scale factor can lead to an overestimation in the structural response, so it is recommended that the maximum scale factor be taken as 2 (Dávalos and Miranda Citation2019). Nevertheless, it is difficult to avoid choosing a scale factor greater than 2 in the fragility analysis, which is limited by the natural seismic waves and the study objectives. In this paper, cloud analysis, used widely in fragility analysis, can ensure that the results are not at the maximum deviation by regression analysis of mass data. Meanwhile, most scale factors of the PGA samples, conforming to the extreme value type I distribution, are within a reasonable range, effectively controlling the magnitude of the deviation. Therefore, the calculation results can be used in structural design.
Figure 7. Comparison of extreme value type I distribution and samples.
2.4. Ground motion intensity measures (IMs) and the demand parameter
Luco and Cornell (Nicolas Luco and Cornell Citation2007) established the efficiency and sufficiency criteria for IM selection, and related studies have quantified the sufficiency of IMs, concluding that spectral acceleration is an efficient and sufficient IM (Dhulipala et al. Citation2018; Ebrahimian et al. Citation2015). However, some studies have indicated that PGA may be more suitable in the case of near-field earthquakes (Liu, Paolacci, and Da-Gang Citation2017). The ground motion IMs recommended by HAZUS (HAZUS-MH MR4 Citation2003) include PGA and spectral acceleration Sa(T1) (corresponding to a damping ratio of 5% and T1). In this paper, PGA and Sa(T1) are applied to perform the fragility analysis, and the effectiveness of each is evaluated.
The IDR is commonly regarded as an EDP for fragility analysis. To extend the scope of application and compensate for the deficiency in the evaluation using the IDR, the critical IDR and the storey ductility are selected as additional indices to describe the horizontal displacement of the structure. The storey ductility is applied widely to reflect the seismic response of the structure(Ghayoumian and Emami Citation2020; Emami and Halabian Citation2018), and the storey ductility of the ith storey, , is defined as the ith maximum storey drift divided by the ith yield storey drift. The critical IDR of the ith storey,
, is defined according to the specifications (JGJ 3-Citation2010 Citation2010) as follows:
where and
are the displacements of the ith storey and the (i-1)th storey,
is the height of the (i-1)th storey, and
and
are the IDRs of the ith storey and the (i-1)th storey, respectively.
3. Fragility function for seismic risk assessment
3.1. Probabilistic seismic demand model (PSDM)
The PSDM is a probability distribution model that describes the seismic demand capacity of a structure under uncertain earthquakes. This model is the basis for establishing the seismic fragility curve of the structure. According to a study by Cornell et al. (Cornell et al. Citation2002) on PSDMs, it can be generally assumed that EDP and IM follow a power function relationship:
where is the predicted seismic demand of EDP for the structure, im is the value of IM for the ground motion, and a and b are fitting constants.
The deviation between the time history analysis result Di and the fitted result is denoted by
(Zanini and Hofer Citation2019), which reflects the uncertainty in PSDM:
where is the standard deviation of the fitted log-linear curves and N is the total number of data points of the time history analysis results.
3.2. Method for fragility curve construction
The seismic fragility curve describes the relationship between IM and the structural failure probability, which is the probability of EDP exceeding the seismic capacity demand (symbolized by C) of the structure at the LS. Given the assumption of log-normal distributions for EDP and C, the structural failure probability can be expressed by the following general equation
where the median value denotes the quantile of a log-normally distributed random variable with an exceedance probability of 50%, as shown in EquationEquation (7)
(7)
(7) ,
represents the uncertainty in the fragility curve, and
is a standard normal distribution function.
Considering the various uncertainties, the equation for is given by
represents the uncertainty in parameters such as the structural dimensions and material strength, and
represents the uncertainty in the assumptions such as those regarding the equation and numerical model. Previous research by Wen et al. (Wen, Ellingwood, and Bracci Citation2004) has indicated that the value of
does not have a significant effect on the fragility curve, so the accepted value of
is adopted in the present study (Yu, Lu, and Bing Citation2017; Rajeev and Tesfamariam Citation2012). Moreover,
and
are employed for slight to moderate damage states and severe damage states, respectively, which are based on the recommendations of HAZUS (HAZUS-MH MR4 Citation2003) and some scholars (Tavares, Padgett, and Paultre Citation2012; Liel et al. Citation2009).
Given the properties of the log-normal distribution, the median seismic capacity is obtained by Equation (9).
and
are the mean () and COV, respectively, of C for different LSs.
Table 8. Mean value of the correlation coefficients.
Table 9. Correlation coefficients of the fitting curves for different .
,
(9)
4. Probabilistic seismic demand analysis (PSDA) and performance level
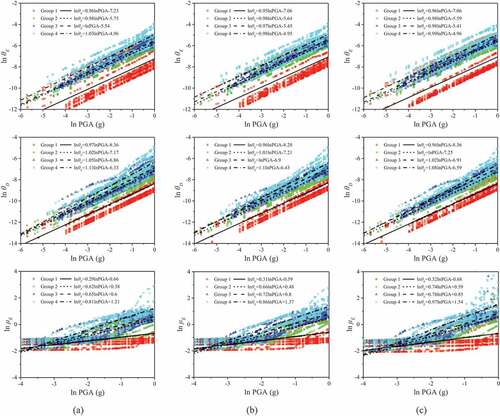
To investigate the seismic demands of structures with different connection types, it is necessary to evaluate the corresponding EDPs based on the number of storeys and and to establish their PSDMs with cloud analysis (Lombardi and Flavia Citation2020). Numerous finite element time history analyses are performed, and the resulting data are subjected to log-linear regression analysis. gives the fitted results based on different IMs employing PGA and Sa(T1). These values demonstrate that the PSDM adopting the PGA as the IM for
has higher correlation coefficients, while the PSDM for considering the number of storeys has lower correlation coefficients. As a result,
and the numbers of storeys are analysed with PSDMs considering only the PGA and Sa(T1), respectively.
A pulse earthquake with longer-period ground motion has a larger mean period value, and PGA has obvious advantages in describing the fragility curves with different mean periods, which effectively shows the changing regularity of the damage indices under ordinary and pulse earthquakes. Sa(T1) is suitable to reflect the influence of the number of storeys on the damage indices because the approximate values of T1 decrease the fitting errors of the fragility curves.
show the average values of the correlation coefficients corresponding to . The correlation coefficients of the IDR and critical IDR are close to 1, which indicates an appropriate fitting effect. However, the fitting curves based on storey ductility have lower correlation coefficients. Large errors generally appear in the elastic phase of the structure, but the fitting curves in the elastoplastic phase conform to the tendency of the data distribution, reflecting the ductility demand, as shown in . In the seismic design of the structure, the seismic performance of the structure in the elastic-plastic phase must meet engineering needs.
Table 10. Correlation coefficients of the fitting curves for different numbers of storeys.
4.1. PSDM based on the mean period
The maximum IDR , maximum critical IDR
, and maximum storey ductility
are accordingly employed as EDPs, and shows their PSDMs for the three structural models and displays the small error in the regression analysis.
The trend of the variation in is similar to that of
for each
. The larger the value of
is, the larger the values of
and
. In comparison to
, the types of connections have little influence on
and
. Under medium-period and long-period ground motions, the values of
are more stable and less affected by
than those of
.
During low-period ground motions with a PGA less than 1 g (), the structures are still in the elastic stage since the values of
are less than 1, meaning that almost no plastic deformation occurs. However, under the impact of long-period ground motions, the demand on
increases rapidly with increasing PGA. Therefore, when the structure is subjected to intense long-period ground motions,
should be strictly controlled by seismic measures to ensure that the structural members have sufficient ductility.
Figure 8. Fitting curves between EDP and for different
: (a) outrigger structure; (b) rigid-connection structure; (c) hinged-connection structure.
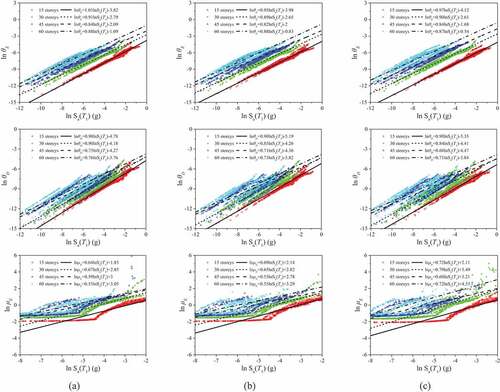
4.2. PSDM based on the number of storeys
The values of and
clearly increase with an increasing number of storeys. To facilitate the discussion, structures with 15, 30–45, and 60 storeys are referred to as sub-high-rise structures, high-rise structures, and super-high-rise structures, respectively. In comparison with the results in the previous section, the trend of
becomes markedly different from that of
with an increasing number of storeys. As shown in , the fitted curves of
are basically parallel to each other, but those of
for structures with different numbers of storeys intersect close to lnSa(T1) = 0 as Sa(T1) increases. The fact that the seismic demand on the 30-storey structure is higher than that on the 45-storey structure beyond the intersection point indicates that when subjected to ground motions with a large Sa(T1), structures with fewer storeys are susceptible to greater damage.
As seen from the variation in the seismic demand of shown in , the more storeys there are, the higher the seismic demand on
, indicating that the ductility capacity of high-rise and super-high-rise structures should be improved. In addition, as expected, the super-high-rise hinged-connection structure has the highest ductility demand; thus, the ductility capacity of the structural members should be enhanced to guarantee a greater seismic performance than those for the rigid-connection structure and outrigger structure.
Figure 9. Fitting curves between EDP and for different numbers of storeys: (a) outrigger structure; (b) rigid-connection structure; (c) hinged-connection structure.
4.3. Structural performance level
The division of the structural performance levels is determined by the thresholds of different damage LSs, and these thresholds are specific values of the quantitative measure C. Three damage LSs, namely, slight damage (LS1), moderate damage (LS2) and extensive damage (LS3), are considered in this study. A unified criterion, using the pushover analysis method, is adopted to quantify the thresholds of and
. The threshold for LS1 is defined as the elastic limit of the pushover curve, represented by the first turning point of the curve; the threshold for LS2 is defined as the equivalent yield point of the structure, and the threshold for LS3 is defined as the peak point of the pushover curve. The determination method of the equivalent yield point is shown in (Wang, Wang, and Zheng Citation2018). schematically shows the values of different LS points on the pushover curve. exhibits the distribution of LS points, which are basically located in three regions, and the average value for each region is used as the corresponding LS value, as shown in .
Table 11. EDPs corresponding to the LSs.
This lower limit of the member ductility factor estimated by EquationEquation (10)(10)
(10) from the Eurocode is selected as the corresponding LS value of the storey ductility factor listed in .
where is the global ductility factor of the structure;
is the period at the upper limit of the constant acceleration region of the spectrum in the Eurocode;
of all the structural models considered here are greater than
;
is the ductility factor of the structural member, which is regarded as the LS value of storey ductility.
Figure 10. Definition of the equivalent yield point.
Figure 11. Definitions of LSs identified from the pushover curves (15 storeys as an example).
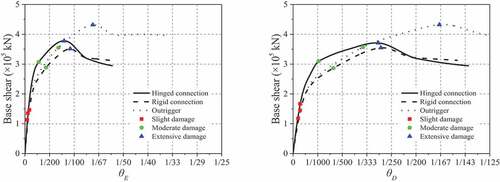
Figure 12. LS thresholds identified from the pushover curves.
The lateral force-resistant capacity of each structural model, described by the average base shear at the yield and ultimate points, is shown in . The outrigger structure has the greatest lateral force resistance, and according to the higher stiffness of the core tube, the hinged-connection structure has a slightly greater lateral force resistance than the rigid-connection structure. It can be assumed that the reasonable stiffness enhancement of the core tube accompanied by a reduction of the material of the outer frame may be a feasible way to increase the seismic performance.
Table 12. Average base shear of each structure in the pushover analysis ().
5. Seismic fragility curves
5.1. Effect of the mean period of earthquake motion
5.1.1. Damage analysis of the maximum IDR
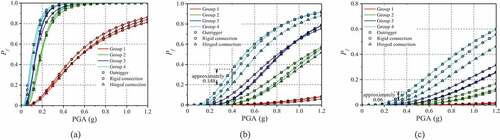
The fragility curves in show the patterns of damage (using as the index) to the hinged-connection structure, rigid-connection structure and outrigger structure at different performance levels. As shown in , most of the fragility curves of the different models are highly consistent, especially under long-period ground motions, indicating insignificant differences among the performance levels of these structures. Therefore, the different mechanical behaviours among the three types of connections cannot be distinguished well by using
as a damage index, which reflects the deformation in only the middle and upper storeys of the structures, as shown in . However, the PSDM is fitted well as a function of
, which is therefore an appropriate index for measuring structural safety. Under LS1 and LS2, the structures subjected to long-period ground motions have a greater exceedance probability of
than those subjected to low- and medium-period ground motions, as shown in the labels of
Figure 13. Damage fragility curves of for the ground motion groups: (a) slight damage; (b) moderate damage; (c) extensive damage.
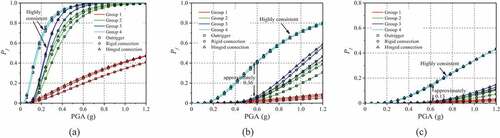
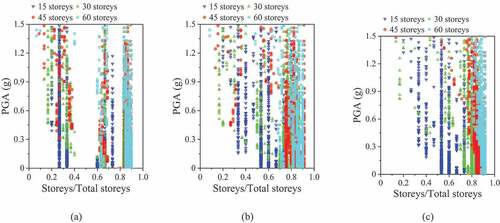
Figure 14. Storey layout of : (a) outrigger structure; (b) rigid-connection structure; (c) hinged-connection structure.
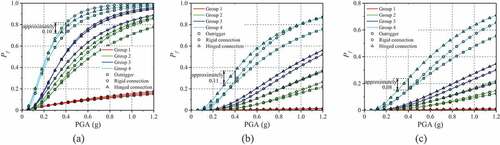
5.1.2. Damage analysis of the maximum critical IDR
Overall, the exceedance probability of is higher than that of
. As shown in ,
basically occurs in the lower storeys of the structures, which corresponds with the damage phenomena observed in actual structures. This feature explains the inherent relation between
and the lower storeys of structures.
More remarkable differences are displayed in the fragility curves of than those of
, especially under LS1 and LS2. As shown in , the hinged-connection structure is generally associated with a lower exceedance probability than other structures, and the distinctions of the fragility curves among the structures reflect the different mechanical behaviours. According to ATC-63 (Applied Technology Council Citation2008), which states that “the probability of collapse under the maximum considered earthquake must be less than 10%,” a 14.8% difference in the exceedance probability at PGA = 0.4 g cannot be ignored, and
becomes an effective index to distinguish the structures with the three types of connections, as shown in the labels of . Hence, to compensate for the deficiency of
,
should be used to control the exceedance probabilities of different structures more accurately.
Figure 15. Storey layout of : (a) outrigger structure; (b) rigid-connection structure; (c) hinged-connection structure.
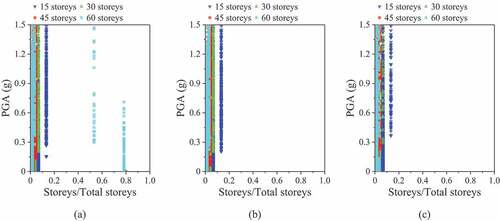
Figure 16. Damage fragility curves of for the ground motion groups: (a) slight damage; (b) moderate damage; (c) extensive damage.
5.1.3. Damage analysis of the maximum storey ductility
The hinged-connection structure usually has a higher ductility demand compared to the other structures, and as shown in , it is associated with a higher exceedance probability for ductility, which is consistent with the forecast. The value of is an ideal control index, directly reflecting the seismic energy dissipation capacity of the structure and identifying the types of connections adopted in the structures, similar to
. In particular,
has a better identification effect than
in the slight damage state. However, the thresholds for the LSs of
are difficult to determine, and the calculation of
is very complicated. Because there is no uniform definition of yielding, the structural elastic-plastic strain is difficult to simulate realistically.
Figure 17. Damage fragility curves of for the ground motion groups: (a) slight damage; (b) moderate damage; (c) extensive damage.
5.2. Effect of the number of storeys
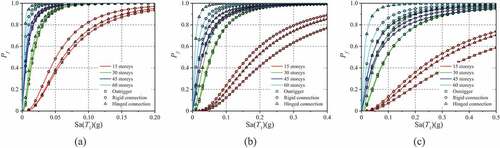
The number of storeys of a structure significantly affects the EDP. Through the establishment of seismic fragility curves as functions of the number of storeys, it is possible to estimate the structural damage and provide a basis for the structural performance index. Super-high-rise structures require stricter displacement demand under a specific ground motion, which is a basic structural response phenomenon. To decrease the displacement demand of super-high-rise structures, controlling T1 is the key for aseismic design because of the strong effect of Sa(T1) in the fragility assessment. The T1 values of super-high-rise structures are generally greater than 4 s and are in the long-period descent stage of the design response spectrum. show that a slight difference in Sa(T1) can cause a very large change in the exceedance probability, making the descent stage of the design spectrum an important basis for design. For sub-high-rise structures, the hinged-connection structure has the lowest probability of exceedance for both and
.
Figure 18. Damage fragility curves of for different numbers of storeys: (a) slight damage; (b) moderate damage; (c) extensive damage.
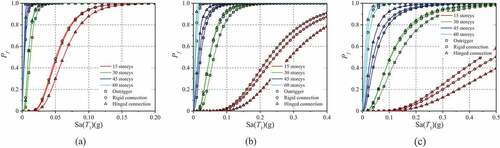
Figure 19. Damage fragility curves of for different numbers of storeys: (a) slight damage; (b) moderate damage; (c) extensive damage.
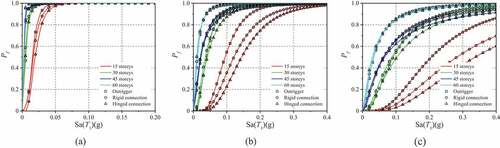
Figure 20. Damage fragility curves of for different numbers of storeys: (a) slight damage; (b) moderate damage; (c) extensive damage.
6. Conclusions
The effects of factors including the beam-end connections, number of storeys, PGA, Sa(T1), and on structural seismic fragility were studied to investigate the exceeding probabilities of the control index, considering the IDR
, critical IDR
and storey ductility
, and the conclusions are summarized as follows:
Although
is a common control index for the seismic design of structures, it is not very effective in judging the differences among the types of connections. The relevant control index should also be considered.
The parameter
The mechanical behaviours among structures with different types of beam-end connections are diverse; thus,
A structure with more storeys is more sensitive to Sa(T1), and the spectral acceleration corresponding to the fundamental period T1 of super-high-rise structures should be strictly controlled. The long-period segment of the acceleration spectrum needs to be carefully explored.
For sub-high-rise structures, the hinged beam-end connections have the lowest exceedance probabilities of
The cumulative exceedance probabilities of the structures with the three tested connection modes differ remarkably for ground motions with large IMs. Using
PGA is an appropriate IM for fragility curves based on mean periods. It can be used for damage assessment of structures under ordinary and pulsed earthquakes.
For structures with different numbers of storeys, the use of Sa(T1) can better reflect the log-linear relationship between the seismic demand and IM.
Acknowledgments
The authors gratefully acknowledge the financial support provided by the Natural Science Foundation of Guangdong Province (grant no. 2018A030313688) and the Natural Science Foundation of Hunan Province (grant no. 2020JJ4268).
Additional information
Funding
Notes on contributors
Fanliang Zeng
Fanliang Zeng is currently enrolled as a Ph.D. candidate in the Department of Civil Engineering at South China University of Technology, China. His main research interest is earthquake resistance of engineering structure.
Yansheng Huang
Yansheng Huang is a professor of Civil Engineering at South China University of Technology, China. His main research interest is earthquake resistance of engineering structure.
Jing Zhou
Jing Zhou is an associate professor of Civil Engineering at South China University of Technology, China. His main research interest is earthquake resistance of engineering structure.
References
- Applied Technology Council. 2008. Quantification of Building Seismic Performance factors[R]. America: Federal Emergency Management Agency.
- Bai, J., H. Chen, J. Zhao, M. Liu, and S. Jin. 2021. “Seismic design and subassemblage tests of buckling-restrained braced RC frames with shear connector gusset connections.„ Engineering Structures 234: 112018. doi:10.1016/j.engstruct.2021.112018
- Birzhandi, M. S., and A. M. Halabian. 2018. “Probabilistic Assessment of Plan-asymmetric Structures under the Near-fault Pulse-like Events considering Soil–structure Interaction.” Advances in Structural Engineering 22: 702–721. doi:10.1177/1369433218798305.
- Bommer, J. J., and A. MARTÍNEZ-PEREIRA. 1999. “The Effective Duration of Earthquake Strong Motion.” Journal of Earthquake Engineering: JEE 3: 127–172. doi:10.1080/13632469909350343.
- CESMD Center Management Group. (n.d.) “Center for Engineering Strong Motion data[EB/OL].” August 14. Available from https://strongmotioncenter.org/
- Chengxiang, X., J. Deng, S. Peng, and L. Chengyu. 2018. “Seismic Fragility Analysis of Steel Reinforced Concrete Frame Structures Based on Different Engineering Demand Parameters.” Journal of Building Engineering 20: 736–749. doi:10.1016/j.jobe.2018.09.019.
- Cornell, C. A., F. Jalayer, R. O. Hamburger, and D. A. Foutch. 2002. “Probabilistic Basis for 2000 SAC Federal Emergency Management Agency Steel Moment Frame Guidelines.” Journal of Structural Engineering-asce 128: 526–533. doi:10.1061/(ASCE)0733-9445(2002)128:4(526).
- Dávalos, H., and E. Miranda. 2019. “Evaluation of the Scaling Factor Bias Influence on the Probability of Collapse Using Sa(T1) as the Intensity Measure.” Earthquake Spectra 35: 679–702. doi:10.1193/011018EQS007M.
- DBJ15-92-2013. 2013. Technical Specification for Concrete Structures of Tall Building. Beijing: China Architecture & Building Press.
- Dhulipala, S. L. N., A. Rodriguez-Marek, S. Ranganathan, and M. M. Flint. 2018. “A Site-consistent Method to Quantify Sufficiency of Alternative IMs in Relation to PSDA.” Earthquake Engineering & Structural Dynamics 47: 377–396. doi:10.1002/eqe.2955.
- Ebrahimian, H., F. Jalayer, A. Lucchini, F. Mollaioli, and G. Manfredi. 2015. “Preliminary Ranking of Alternative Scalar and Vector Intensity Measures of Ground Shaking.” Bulletin of Earthquake Engineering 13: 2805–2840. doi:10.1007/s10518-015-9755-9.
- Emami, A. R., and A. M. Halabian. 2018. “Damage Index Distributions in RC Dual Lateral Load-Resistant Multi-Story Buildings considering SSI Effects under Bidirectional Earthquakes.” Journal of Earthquake and Tsunami 12: 1850004. doi:10.1142/S1793431118500045.
- Ghayeb, H. H., R. N. Hashim Abdul, and H. Ramli Sulong. 2017. “Development and Testing of Hybrid Precast Concrete Beam-to-column Connections under Cyclic Loading.” Construction and Building Materials 151: 258–278. doi:10.1016/j.conbuildmat.2017.06.073.
- Ghayoumian, G., and A. R. Emami. 2020. “A Multi-direction Pushover Procedure for Seismic Response Assessment of Low-to-medium-rise Modern Reinforced Concrete Buildings with Special Dual System Having Torsional Irregularity.” Structures 28: 1077–1107. doi:10.1016/j.istruc.2020.09.031.
- Guobin, B., F. Liu, J. Bin, and Z. Zhang. 2019. “Seismic Fragility Analysis of Strength Eccentric Structures Subjected to Pulse‐like Ground Motions.” Structural Concrete 1–14. doi:10.1002/suco.201900183.
- HAZUS-MH MR4. 2003. Multi-hazard Loss Estimation Methodology: Earthquake Model. Washington, D.C.: NIBS (National Institute of Building Sciences).
- JGJ 3-2010. 2010. Technical Specification for Concrete Structures of Tall Building. Beijing: China Architecture & Building Press.
- Li, Z., and Y. Xie. 2021. “Buckling mechanism of thin-walled arches with composite polyhedral shapes.„ Composite Structures 271: 114134. doi:10.1016/j.compstruct.2021.114134
- Liel, A. B., C. B. Haselton, G. G. Deierlein, and J. W. Baker. 2009. “Incorporating Modeling Uncertainties in the Assessment of Seismic Collapse Risk of Buildings.” Structural Safety 31: 197–211. doi:10.1016/j.strusafe.2008.06.002.
- Liu, Y., F. Paolacci, and L. Da-Gang. 2017. “Seismic Fragility of a Typical Bridge Using Extrapolated Experimental Damage Limit States.” Earthquakes and Structures 13: 599–611. doi:10.12989/eas.2017.13.6.599.
- Lombardi, L., and D. L. Flavia. 2020. “Derivation of Fragility Curves at Design Stage through Linear Time-history Analysis.” Engineering Structures 219: 110900. doi:10.1016/j.engstruct.2020.110900.
- Lu, X., D. Gu, J. Zhou, L. Bao, P. Qian, X. Lu, and Y. Lin. 2019. “Influence of Changing Shear Adjustment Strategy on Aseismic Performance of Frame-core Tube Structure.” Engineering Mechanics 36: 183–191. doi:10.6052/j.1000-4750.2017.11.0853.
- Mohammadgholibeyki, N., and S. Epackachi. 2020. “Fragility Functions for Steel-plate Concrete Composite Shear Walls.” Journal of Constructional Steel Research 167: 105776. doi:10.1016/j.jcsr.2019.105776.
- Moniri, H. 2017. “Evaluation of Seismic Performance of Reinforced Concrete (RC) Buildings under Near-field Earthquakes.” International Journal of Advanced Structural Engineering 9: 13–25. doi:10.1007/s40091-016-0145-6.
- Moradi Garoosi, A. R., M. T. Roudsari, and B. H. Hashemi. 2018. “Experimental Evaluation of Rigid Connection with Reduced Section and Replaceable Fuse.” Structures 16: 390–404. doi:10.1016/j.istruc.2018.11.010.
- Nicolas Luco, C., and A. Cornell. 2007. “Structure-specific Scalar Intensity Measures for Near-source and Ordinary Earthquake Ground Motions.” Earthquake Spectra 23: 357–392. doi:10.1193/1.2723158.
- Peng, H., O. Jinping, and S. Mahin. 2020. “Design and Numerical Analysis of a Damage-controllable Mechanical Hinge Beam-to-column Connection.” Soil Dynamics and Earthquake Engineering 133: 106149. doi:10.1016/j.soildyn.2020.106149.
- Pnevmatikos, N. G., G. A. Papagiannopoulos, and G. S. Papavasileiou. 2019. “Fragility Curves for Mixed Concrete/steel Frames Subjected to Seismic Excitation.” Soil Dynamics and Earthquake Engineering 116: 709–713. doi:10.1016/j.soildyn.2018.09.037.
- Psycharis, I. N., and H. P. Mouzakis. 2012. “Shear Resistance of Pinned Connections of Precast Members to Monotonic and Cyclic Loading.” Engineering Structures 41: 413–427. doi:10.1016/j.engstruct.2012.03.051.
- Rajeev, P., and S. Tesfamariam. 2012. “Seismic Fragilities for Reinforced Concrete Buildings with Consideration of Irregularities.” Structural Safety 39: 1–13. doi:10.1016/j.strusafe.2012.06.001.
- Rathje, E. M., N. A. Abrahamson, and J. D. Bray. 1998. “Simplified Frequency Content Estimates of Earthquake Ground Motions.” Journal of Geotechnical and Geoenvironmental Engineering 124: 150–159. doi:10.1061/(ASCE)1090-0241(1998)124:2(150).
- Sharma, V., M. K. Shrimali, S. D. Bharti, and T. K. Datta. 2021. “Seismic Fragility Evaluation of Semi-rigid Frames Subjected to Near-field Earthquakes.” Journal of Constructional Steel Research 176: 106384. doi:10.1016/j.jcsr.2020.106384.
- Skalomenos, K. A., G. D. Hatzigeorgiou, and D. E. Beskos. 2015. “Modeling Level Selection for Seismic Analysis of Concrete-filled Steel Tube/moment-resisting Frames by Using Fragility Curves.” Earthquake Engineering & Structural Dynamics 44: 199–220. doi:10.1002/eqe.2465.
- Tavares, D. H., J. E. Padgett, and P. Paultre. 2012. “Fragility Curves of Typical As-built Highway Bridges in Eastern Canada.” Engineering Structures 40: 107–118. doi:10.1016/j.engstruct.2012.02.019.
- Trautner, C., T. Hutchinson, P. Grosser, R. Piccinin, and J. Silva. 2019. “Shake Table Testing of a Miniature Steel Building with Ductile-anchor, Uplifting-column Base Connections for Improved Seismic Performance.” Earthquake Engineering & Structural Dynamics 48: 173–187. doi:10.1002/eqe.3130.
- Wang, W., Y. Wang, and L. Zheng. 2018. “Experimental Study on Seismic Behavior of Steel Plate Reinforced Concrete Composite Shear Wall.” Engineering Structures 160: 281–292. doi:10.1016/j.engstruct.2018.01.050.
- Wen, Y., B. Ellingwood, and J. Bracci. 2004. Vulnerability Function Framework for Consequence-Based Engineering, MAE Center Project DS-4 Report[R]. Champaign, IL.: Mid-America Earthquake (MAE) Center.
- Xiong, C., L. Xinzheng, and X. Lin. 2019. “Damage Assessment of Shear Wall Components for RC Frame–shear Wall Buildings Using Story Curvature as Engineering Demand Parameter.” Engineering Structures 189: 77–88. doi:10.1016/j.engstruct.2019.03.068.
- Yu, X. H., D. G. Lu, and L. Bing. 2017. “Relating Seismic Design Level and Seismic Performance: Fragility-Based Investigation of RC Moment-Resisting Frame Buildings in China.” Journal of Performance of Constructed Facilities 31: 4017075. doi:10.1061/(ASCE)CF.1943-5509.0001069.
- Zanini, M. A., and L. Hofer. 2019. “Center and Characteristic Seismic Reliability as New Indexes for Accounting Uncertainties in Seismic Reliability Analysis.” Soil Dynamics and Earthquake Engineering 123: 110–123. doi:10.1016/j.soildyn.2019.04.028.
- Zeng, F., Y. Huang, and J. Zhou. 2019. “Reliability Verification for Seismic Capacity Utilization Factors of Structure.” Journal of South China University of Technology (Natural Science Edition) 47: 56–63. doi:10.12141/j.1000-565X.170496.
- Zeng, F., Y. Huang, and J. Zhou. 2021. “Shaking Table Test of a Supertall Building with Hinged Connections Connecting a Gravity Load Resisting System to a Lateral Force Resisting System.” Journal of Asian Architecture and Building Engineering ahead-of-print: 1–24. doi:10.1080/13467581.2021.1908898.