
ABSTRACT
As alternative public spaces in vertical public realms, sky gardens have become an increasingly important spatial element and part of the urban vocabulary in high-density environments worldwide. However, the public's spatial experience, social behavior and aesthetic needs in sky gardens have not been thoroughly explained. This paper takes Singapore, which has a rich social public space in the air, as an example where studies estimating spatial perception have used networked images instead of user preference survey results. Manual image identification and image recognition were performed with a computer vision application programming interface (API) to recognize networked images. Then, we extracted the sky gardens’ main elements in Singapore’s urban environment using clustering analysis, principal component analysis and factor analysis with SPSS. Finally, we discuss the spatial distribution, role and composition of sky gardens in high-density cities and people’s emotional preferences. The study shows that sky gardens are effective alternative public spaces in Singapore's vertical city, and their physical elements occupy a dominant position in the public’s spatial perception; there is a strong tendency for different buildings’ sky gardens to have spatial demand characteristics, while public facilities and cultural activities are key factors that affect sky gardens’ quality.
Graphical Abstract
1. Introduction
Sky gardens are open green spaces that benefit both the environment and human beings and are located above ground level on intermediate floors and rooftops to integrate into high-rise buildings and high-density cities (Osmundson Citation1999; Ong Citation2003; Hadi, Heath, and Oldfield Citation2014). Earlier design for sky gardens evolved from green roofs as spaces for visual delight. Singapore promoted sky gardens as a new catalyst to create spaces for social and public use in high-rise buildings, especially in high-rise residences. As alternative public spaces, sky gardens integrate the vertical public realm, vertical landscaping, and vertical community facilities of high-rise buildings (Yeang Citation2002) and have become an increasingly important spatial element and part of the urban vocabulary in high-density environments worldwide. The sky gardens blur open space boundaries between public and private (Miao Citation2001), enhance social sustainability and the public spatial experience in buildings (Yeang Citation1999; Chan Citation2013), and become a major tool for issues related to urban sustainability (Tian, Jim, and Tao Citation2012; Raji, Tenpierik, and van den Dobbelsteen Citation2015).
Recent work has identified sky gardens’ benefits for the urban living environment in terms of their sustainability value and energy conservation capacity and especially in their creation of alternative green spaces (Haaland and van den Bosch Citation2015; Tien and Calautit Citation2019; Mohammadi and Calautit Citation2019; Yuliani, Hardiman, and Setyowati Citation2020). In addition, sky gardens are social spaces and transitional nodes in the sky that help compensate for the loss of open space potentially surrendered through urban densification (Pomeroy Citation2016). These spaces have become important places for leisure and entertainment (Tony Citation2013), providing alternative and informal recreation environments, which increase the possibility of social gatherings and encounters (Pomeroy Citation2014). In recent years, Hadi, Heath, and Oldfield (Citation2014) have paid attention to the resurgence of social public space in vertical urban space and found that dedicated function and usage restrictions have greatly impacted aerial social space. Samant (Citation2019) examines Singapore sky gardens’ effectiveness in creating urban spatial and pedestrian networks and their ability to transition from horizontal to vertical. However, the spatial experience of, social behavior found in, and aesthetic needs of sky gardens have not been thoroughly explained, which greatly affects the function and value of the social spaces in the sky. Further study on accessibility, visibility, maintenance, and security of sky gardens should be balanced with users’ social and emotional needs (Hadi, Heath, and Oldfield Citation2018).
Conforming to the public’s needs is an important research goal of perceptual evaluation. How to effectively represent public preferences is key in spatial perception research. In addition to spatial data, human behavior data also requires consideration in determining public perception preference and area of interest. Voluntary geographic information (VGI) (Goodchild Citation2007) proliferates in the Internet environment (Liu et al. Citation2015b), providing new opportunities for urban and architectural space research (Liu et al. Citation2016). Social sensing constructs individual-level spatial big data and related research frameworks and methods (Liu et al. Citation2015b; Wang et al. Citation2019) that reveal temporal and spatial distribution as well as the connections and processes of socioeconomic phenomena (Madan et al. Citation2010; Wang et al. Citation2012). Social sensing data objectively reflect people’s perceptions of the connotations and impressions of urban physical and social spaces, which help the human-scale urban form be deepened and embodied both comprehensively and at the microscale (Liu et al. Citation2015a).
In fact, cognitive factors influence participants’ specific behaviors and attitudes (Albarracin and Wyer Citation2000), and social images contain both visual and social features. Therefore, users’ social behavior can be regarded as reflecting their cognition in images (Liu et al. Citation2014), and people’s spatial aesthetic preferences and interests can be determined from their behavior on social media platforms (Cui et al. Citation2020). In other words, spatial image is the result of conscious spatial cognition through the use of, attention to, and preference for specific physical space scenes and pictures and other relevant behaviors. Photo landscape analysis based on spatial imagery has great potential in research on social perception. Specific spatial images from the Internet or uploaded and shared by individuals can convey the public’s perceptual preference for and interest in the spatial scene. As image data proliferate in the network environment and analysis technology develops, imagery content extraction of specific spatial types plays an important role in recognizing, classifying and evaluating spatial elements, especially micro living spaces (Yoshimura and Hiura Citation2017; Payntar et al. Citation2021).
Unlike previous studies on how much of high-rise buildings are visible, including in terms of visual coverage and cumulative visibility (Oh Citation1998; Stamps, Nasar, and Hanyu Citation2005; Karimimoshaver and Winkemann Citation2018), this paper pays more attention to the importance of visual perception inside privately owned public space rather than to the street viewpoint (Lotfi et al. Citation2020) or spatial images at the city scale (Zhou et al. Citation2014, Liu et al. Citation2016). The spatial image analysis of networked pictures is an active method of selecting research objects mainly through the public, which is a beneficial supplement to the previous methods of selecting research objects based on the judgment of professionals and then conducting field surveys and questionnaire surveys (passive methods). In addition, our team carried out in-depth research and visits to the sky gardens in the early stages of the research and found that most of the sky gardens were located in privately owned public spaces. Hence, due to sky gardens’ exclusivity and limited accessibility, adopting on-site field research for the sky gardens was more time-consuming and difficult than using public spaces such as streets, squares and parks.
Here, we describe the preference and spatial distribution of Singapore sky gardens in public social sensing, in which networked image content information is extracted and classified by computer visual API and manual identification, whereupon the preference features are placed within the geographic space and the surrounding environment. We propose a framework for extracting and analyzing components of sky gardens from networked imagery. This framework connects tag summarizing, data processing, preferable image clustering, and knowledge discovery. The main purpose of conducting this study was to provide a way to represent spatial images of sky gardens in high-density environments based on social sensing data, illustrating sky gardens’ social performance in vertical cities at the microlevel, and to expand the research methods and paradigms for urban spatial landscapes.
2. Data and method
2.1. Study area and data sources
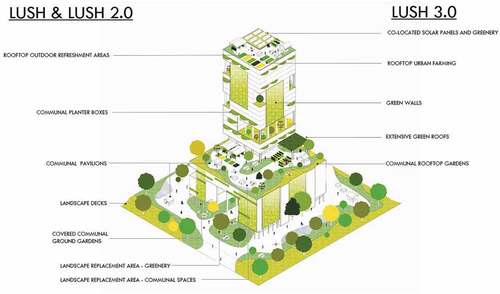
Singapore was the third most densely populated territory in the world (World Economic Forum Citation2018), and the population density was 7,810 per sq km (Department of Statistics Singapore Citation2020). Such limited land resources resulted in a high-density environment, leading the Urban Redevelopment Authority (URA) to initiate the concept of a “city in a garden” to develop citizens’ well-being and increase the livability of the city. However, on-ground greenery is not sufficient. The city-state has adopted a garden city planning model through its Green Plot Ratio (GnPR) and Landscaping for Urban Spaces and High-Rises (LUSH) program. The LUSH program comprises both Landscape Replacement Area (LRA) requirements and incentives to replace the greenery lost to development on site by greening communal areas from ground to roof. LUSH 2.0 and 3.0 build on the achievements of the earlier phases of LUSH, which seeks to further enhance the quality of greenery in developments as well as encourage more sustainable features (Urban Redevelopment Authority Citation2009, Citation2014, Citation2017). The LRA requirements are calibrated by location, GnPR and development type, with Sky Terraces, Communal Planter Boxes and Covered Communal Ground Gardens, amongst other features, counting towards meeting the LRA requirement ().
Figure 1. An overview of the LUSH program (Urban Redevelopment Authority Citation2017).
Therefore, Singapore sky gardens and sky courts in high-density urban environments have proliferated and are typical of study areas. In addition, 2,185 large and extra-large images with high pixel counts were collected, including mainly urban landscapes, city landmarks, high-rise buildings, park squares, project design schemes, and public events. According to the actual scene content, irrelevant and repeated pictures were screened and eliminated, and 1,537 sky garden images were finally obtained. It is worth noting that the preliminary search collected 1,204 images of Singapore, accounting for 78.3% of the images, reflecting Singapore’s important contributions to constructing garden cities and sky garden spaces’ popularity. Therefore, the subsequent spatial analysis was carried out based on networked image data of sky gardens in Singapore.
2.2. Method statement
In this study, the Bing search engine database was used to obtain image samples, using “vertical public space”, “skyscraper garden” and “sky garden” as keywords to search for images. By sorting and analyzing the image data, we could objectively depict people’s cognitive characteristics for sky gardens. A total of 1,204 images of Singapore were collected to research the public’s social perception of sky gardens’ spatial characteristics. Two methods were adopted to analyze the acquired image data: (1) Image recognition with a computer vision application programming interface (API) (Microsoft Cognitive Services Citation2016) and (2) manual identification. Computer vision analysis was used to interpret image content through a specific computing program and to obtain standardized and formatted analysis results, including descriptions, tags, categories, and colors. Using computer vision API analysis can greatly improve efficiency, but some differences in the spatial meaning and behavioral characteristics of the image content remain. Thus, the paper adopted two methods to analyze the image data, using the new analytical techniques and professional experience to obtain spatial images of sky gardens. The integration of the accuracy of content recognition technology and the logicality of professional knowledge can be used to obtain more complete results.
Ultimately, 1,204 pictures with sky garden spatial image data were used for computer vision API analysis, and 1121 of these pictures were valid. Identification variables with a confidence higher than 75% were extracted, and irrelevant variables and those with a frequency of less than 10 were eliminated. Finally, we obtained 26 spatial variables. A total of 1099 networked images were summarized and classified through manual identification, and a value of 1 was assigned to each variable contained in an image.
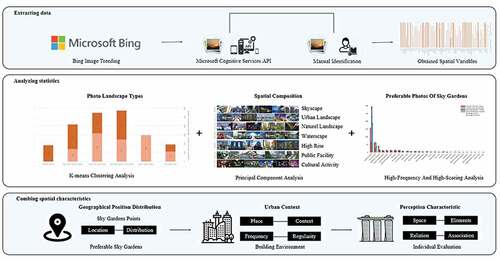
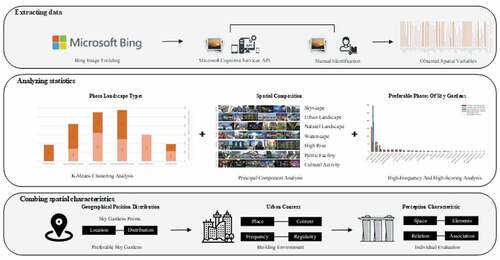
By discriminating and classifying building-level images’ features, spatial perception preference is reflected through public preferred scenes of Singapore sky gardens in the network (). The framework includes the following: (1) Extracting data. The perceptual elements of the sky gardens were extracted using a computer vision API and manual identification. (2) Analyzing statistics. The relationship among the content variables of the networked images was analyzed by the factor linear function, and the commonness and specialties of the image contents and space features were judged. (3) Combing spatial characteristics. Sky garden AOIs are extracted through high-frequency and high-scoring scenes, and the spatial attributes and social value of sky gardens in high-density urban environments are discussed.
Figure 2. Research framework.
3. Results
3.1. Photo landscape types
Sky gardens’ networked images were classified using computer vision API analysis and manual identification and clustered using SPSS analysis. We observed five clear clusters and reran the analysis to identify cluster group codings for five clusters. We found that the cluster group classification was clear and evenly distributed, and the fitting cluster mean square was much larger than the error mean square, sig. <0.05, which indicated that the clustering results were significantly different.
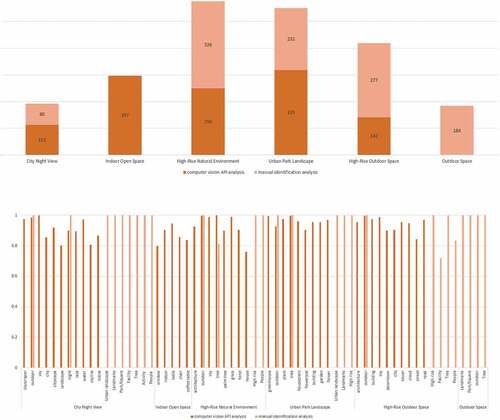
The clustering analysis results show that sky gardens in Singapore have six landscape types: city night view, high-rise natural environment, urban park landscape, high-rise outdoor space, outdoor space, and indoor open space. The first five are photo landscape types by computer vision API, containing 432 samples of urban outdoor landscapes and urban night scenes, which account for 38.54%, and 392 samples of high-rise outdoor natural environments and outdoor spaces, accounting for 34.97%. The photo landscape types analyzed by manual identification were the last five categories, containing 603 samples of high-rise outdoor natural environments and outdoor spaces, which account for 54.87%, and 312 samples of urban night scenes and urban park landscapes, accounting for 28.39% (). In summary, sky gardens in Singapore rely mainly on the urban park landscape and high-rise buildings and closely integrate into the modern high-density environment.
Figure 3. Variables and counts in each cluster of photo landscape type for sky gardens in Singapore.
3.2. Principal component analysis
Principal component analysis was performed with SPSS, and according to the correlation matrix and component matrix of the factor analysis, irrelevant variables were eliminated. The computer vision API analysis passed the Kaiser-Meyer-Olkin measure of sampling adequacy (KMO) with a result of 0.745 and Bartlett’s test of sphericity with a significance of 0.000, which showed that the remaining variables and samples were suitable for principal component analysis and accurately described the correlation between variables in the networked pictures. However, manual identification did not pass the KMO test. A factor rotation matrix examination revealed that water, sculpture, catering, advertising, and design concepts did not obviously contribute to principal component analysis. After the above five variables were removed, principal component analysis was performed again. The KMO value reached 0.661, and Bartlett’s test of sphericity significance was 0.000; thus, the tests were passed. The number of principal components extracted as initial factors was determined using the eigenvalue criterion, and seven and five principal components were selected as initial factors for computer vision API and manual identification analysis, respectively ().
Table 1. Rotated factor matrix (computer vision API analysis).
Table 2. Rotated factor matrix (manual identification analysis).
To understand each variable’s contribution to and significance for principal component analysis, the maximum variance method performed factor rotation, and the rotated factor matrix was obtained. The seven principal components of the computer vision API analysis are public facility factors, high-rise factors, waterscape factors, natural landscape factors, skyscape factors, cultural activity factors and urban landscape factors. Among the manual identification analyses, the five principal components were high-rise factors, urban landscape factors, public facility factors, cultural activity factors and natural landscape factors ().
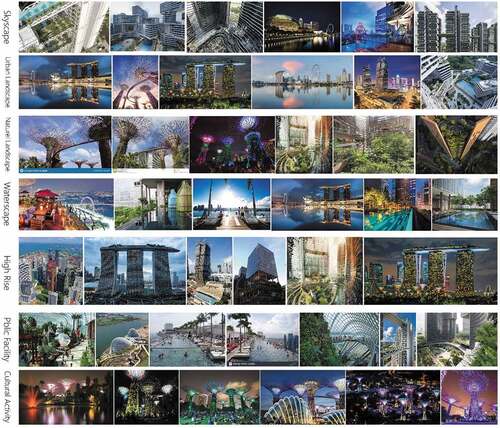
Figure 4. Spatial image features of Singapore sky gardens.
3.3. High-frequency and high-scoring scenes
According to the factors’ score coefficients and calculation formulas for each variable listed in the factor score coefficient matrix, the calculation function and total score function of each component are obtained. To ensure that the data have analytical value and spatial significance, we selected samples with a total score higher than the mean (0.098, 0.5314) and the top 25% of the total score (0.059, 0.3055) for the statistics, which resulted in 415 (37.02%) and 476 (43.31%) samples and 200 (17.84%) and 280 (25.48%) samples, respectively. Although the two types of analysis results differ, the overall trend and order of the various landmarks are approximately similar (). Gardens by the Bay accounted for 38.55% and 62.66% of the samples higher than the mean score and the top 25% of the total score in the computer vision API analysis and manual identification results; Marina Bay Sands accounted for 15.42% and 13.50%; and PARKROYAL on Pickering accounted for 10.36% and 4.22%, respectively.
Figure 5. Buildings with a high-frequency of spatial images of Singapore’s sky gardens.
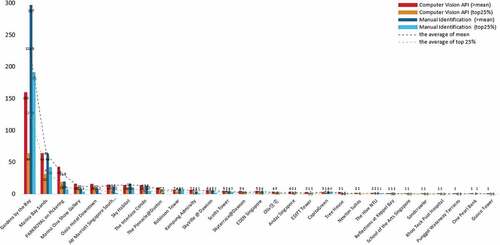
In the computer analysis results, Marina One Show Gallery (3.86% and 5.50%), Oasia Hotel Downtown (3.86% and 5.00%), JW Marriott Singapore South Beach (3.61% and 3.00%), Sky Habitat (3.37% and 4.50%), The Interlace Condo (3.37% and 3.00%), and The Pinnacle@Duxton (2.41% and 3.50%) have relatively high proportions. In the manual identification analysis results, Sky Habitat (3.38% and 3.23%), Interlace Condo (2.74% and 1.79%), JW Marriott Singapore South Beach (2.53% and 0.72%), and Robinson Tower (1.69% and 2.15%) accounted for relatively high proportions.
The total scores for each sample indicate () that Gardens by the Bay, Marina Bay Sands, and PARKROYAL on Pickering have the highest total scores in the computer vision API analysis results and are all at the top level (>0.30); Robinson Tower, Newton Suites, Marina One Show Gallery, and Scotts Tower, which are typical practical cases of garden city construction, have similar total scores (0.26–0.23). In the manual identification results, 8 samples of Gardens by the Bay appear in the top-10 networked image data, while only 1 sample is at the highest level (>1.50) of the total scores. The remaining two are Marina Bay Sands (4th) and Marina One Show Gallery (10th).
Table 3. List of the top-10 samples of sky gardens by computer vision API analysis and manual identification.
4. Discussion
4.1. Physical elements occupy the dominant position
From the perspective of landscape types, the networked images of Singapore sky gardens focus on high-rise buildings and urban landscapes, reflecting the characteristics of the garden city. The city’s composition is dominated by material elements, such as urban landscapes and the natural environment, while intangible cultural elements’ influence is relatively weak ().
Figure 6. Comparison of spatial element counts and proportions in Singapore sky gardens.
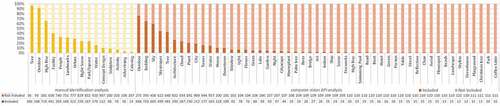
Figure 7. The composition of the spatial image of Singapore’s sky garden (left: computer vision API analysis, right: manual identification).
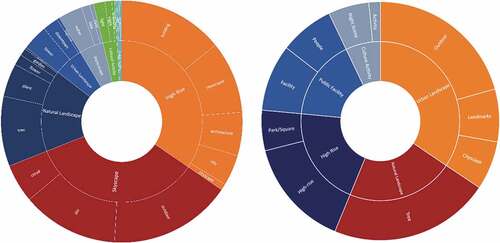
The high-rise, skyscape and urban landscape components are sky courtyards’ most important components, indicating that the spatial images in the network environment are inclined to the overall urban visual effect. Meanwhile, few factors of urban cultural activity exist, such as fireworks and other activities, which reflects the lack of more abundant activities and spatial arrangements related to the city’s local culture in the spatial images of sky gardens in Singapore.
4.2. Public facilities and cultural activities are key factors
Furthermore, networked image factor variables are classified according to the components, and the variables’ characteristics are statistically described (). The computer vision API analysis results show that sky landscape > high rise > natural landscape > public facility = cultural activity. The manual identification results show that urban landscape > natural landscape > public facility > cultural activity. The results of the high-frequency and high-scoring scenes analyzed by computer vision API analysis and manual identification analysis differ, mainly because the former prefers skyscapes and urban landscapes, while the latter tends toward urban landscapes and natural environments.
Table 4. Distribution characteristics of variables for sky gardens in Singapore.
To partially balance the impact of the missing skyscape component in manual identification analysis, sky garden pictures with high scores attached to high-rise buildings were selected. Therefore, according to the total score ranking calculated by manual identification, high-rise building samples were screened successively and were compared with the computer vision API results. The analysis indicates the following: 1) High-rise, sky landscape and water landscape scores are high and stable in the top-10 samples, which are extremely important components of sky gardens. 2) Cultural activity scores present a step-type distribution in high-rise buildings’ sky gardens. The Marina Bay Sands and PARKROYAL on Pickering have the most abundant cultural activities, which can create atmosphere and bring vitality to space. 3) Public facilities and natural landscapes differ greatly in the two types of analysis results. The reason may be that the calculation method for variables and for principal component categories are different: 1) the variables extracted by computer vision analysis are specific objects, and the confidence must be greater than 75%, while the manual analysis is empirical and contains public facilities, assigned a value of 1. 2) The manual identification analysis of the natural landscape component includes waterscapes and natural vegetation, while computer vision API analysis is calculated separately.
For the above reasons, there is some deviation between the public facilities calculated by computer API and the actual situation, so the public facilities factors classified manually are the main reference results. The cultural activities are judged by combining the results of the two methods. Comparison of the overall composition and excellent cases shows that skyscapes, high-rises and natural landscapes are essential components in the spatial perception of Singapore sky gardens, and the factors influencing the ranking were public facilities and cultural activities. In other words, the skyscape, high-rise and natural landscape are common components of Singapore sky gardens, and public facilities and cultural activities are key factors affecting the total spatial perception evaluation scores (,).
Figure 8. The top 10 spatial image characteristics of high-rise building sky gardens (left: computer vision API analysis, right: manual identification).
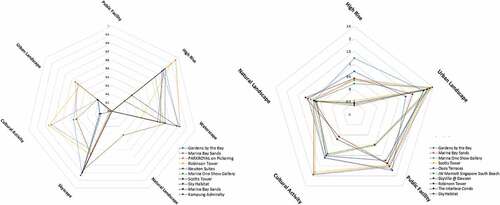
The top 10 spatial image characteristics of high-rise building sky gardens (left: computer vision API analysis, right: manual identification)
4.3. Effective alternative public space in vertical cities
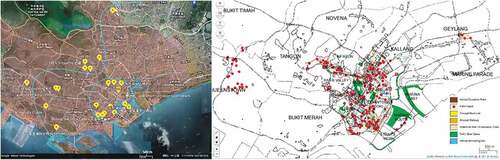
According to the spatial location information derived from high-frequency and high-scoring scenes, the distribution map of gardens in the sky was generated. The findings indicated that typical sky gardens based on social sensing data are concentrated in the central region and show obvious spatial agglomeration characteristics in the high-density urban center. Sky courtyards appear in groups near the Marina Bay area and the central region around the central business district in a hub-and-spoke distribution, reflecting that they generally exist in an urban center with compact space and limited land.
According to UN data published by the World Economic Forum, Singapore was the third most densely populated territory in the world, and the population density was 7,810 people per square kilometer in 2020. Moreover, Singapore’s urbanization is mostly along the southern coast, with relatively dense population clusters in the central areas. The distribution of sky gardens is closely aligned with open/public spaces (), which indicates that sky gardens are an alternative public space that effectively compensates for the lack of public space and natural environment in a dense city.
Figure 9. Spatial distribution map of sky gardens based on high-frequency and high-scoring scenes and distribution diagram of urban public space in Singapore (Urban Redevelopment Authority & Singapore Government Citation2019).
Buildings with attached sky gardens accounted for approximately 90% of buildings over 100 meters and built later than 2010, and approximately 60% of buildings over 100 meters tall and built later than 2015. These percentages roughly reflect that the breeding ground for Singapore sky gardens includes a dense urban environment and high-rise buildings, which have developed rapidly since 2010. Furthermore, sky gardens have become a popular design element of open space in high-rise buildings since 2015. Singapore’s LUSH program can be seen as an important impetus for the construction of sky gardens in high-rises and as providing practical experience for similar high-density urban areas lacking in public space. Outdoor activities in public spaces demand different physical environments (Gehl Citation2011), and sky gardens also have different alternative public space attributes in high-rise buildings (). They provide necessary/functional activities, optional/recreational activities, and social activities intertwined in every conceivable combination. According to statistics, the spatial structure of sky gardens is usually dispersed over several levels in high-rise buildings, which includes the spatial characteristics of openness, microscale, and intermediate floors.
Table 5. Building information for spatial images of Singapore sky gardens.
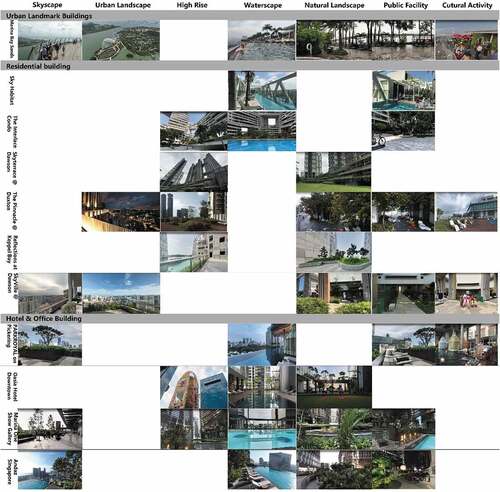
Regarding the statistical distribution area of human visual attention elements, the spatial perception of sky gardens is affected by the morphological characteristics of their internal and external environment (). To verify the difference between spatial images of typical sky gardens in the network and the physical environment, this paper uses Google Street View and combines the characteristics of sky gardens with the analysis results. Different buildings’ sky gardens exhibit primary characteristics that reveal the interactive mechanism between affordance and influencers, such as urban location, natural environment, landscape, building function and attributes. 1) For urban landmark buildings, the perception features of sky gardens are relatively rich and varied, and each component of the spatial image has strong characteristics, such as Marina Bay Sands’ roof garden. 2) For residential buildings, sky gardens are mainly spatial images characterized by high rise, natural landscape, and public facility. Additionally, some residential buildings’ sky gardens, such as Pinnacle@Duxton and SkyVille@Dawson, reveal rich cultural activity in Google Street View. 3) For hotel and office buildings, skyscapes, the natural environment, and public facilities are the main characteristics of sky garden spatial images ().
Figure 10. The human visual perception of sky gardens is affected by the morphological characteristics of their internal and external environment.
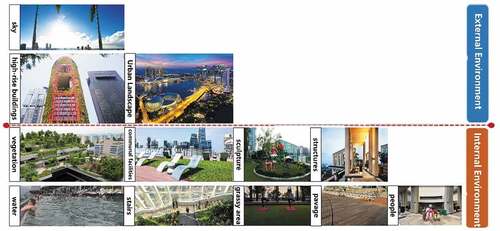
Figure 11. Spatial image components of Singapore sky gardens from Google Street View.
5. Conclusion
The main purpose of conducting this study was to provide a way to represent the spatial images of sky gardens in a high-density environment based on social sensing data. In this research, the sky garden areas of interest in the urban environment of Singapore are combed through the extraction and classification of networked image content of sky gardens, sorting out the spatial image components of sky gardens in the public. Then, the spatial distribution, the role and the components of sky gardens in high-density cities and people’s emotional preferences are described. The results show that physical elements such as high-rises, skyscapes and urban landscapes are the most important in terms of their influence on the spatial image of sky gardens, and public facilities and cultural activities are the key factors affecting the total scores of sky gardens.
It was discovered that since the LUSH program was implemented in 2009, sky gardens in high-rise buildings have increased rapidly and have been a popular design element of the open space in high-rise buildings since 2015. According to the distribution map of sky gardens, it is confirmed that sky gardens are alternative public spaces that effectively compensate for the lack of public space and natural environments in a dense city. In addition, sky gardens’ attribution, vertical position, structural configuration and characteristic elements as alternative public spaces are related to the function of high-rise buildings, the urban location, and the surrounding environment.
This paper is a preliminary study of sky gardens’ spatial composition based on networked image data. The findings show that as alternative public spaces, sky gardens have been widely involved in the urban environment to balance public life within private developments, thus strengthening urban habitats’ spatial hierarchy (Pomeroy Citation2014). However, the limitation of this work is twofold. First, spatial elements and perceptual preferences in picture content information have been extensively studied in recent years. The spatial perception of sky gardens may feature multiple methods, and the networked images might not catalog the complete perception characteristics of sky gardens. Second, the networked images of sky gardens include the most positive public perceptions toward the identity environment, while specific spatial problems are deliberately avoided. Third, the networked picture analysis relies solely on the data statistics of the picture content information, and the discussion of individual behavior, willingness and feedback with respect to the sky gardens is insufficient. Finally, most of the subjects uploading networked pictures are young people and their individual characteristics, such as gender, age and educational background, are not clear. In addition, the research results are reasonable deductions based on existing data, but the deep influencing factors behind spatial preference have not been sufficiently explored. Therefore, future studies should utilize an in-depth understanding of the public’s use and evaluation of sky gardens and research the mechanism of high-density urban life and human behaviors.
Disclosure statement
No potential conflict of interest was reported by the author(s).
Additional information
Funding
Notes on contributors
Hongwu Du
Dr. DU Hongwu is a professor of the School of Architecture of the South China University of Technology and a fixed member of the State Key Laboratory of Subtropical Building Science. He is also a first-class registered architect as well as a registered urban planner of the Architectural Design and Research Institute of SCUT. His research focuses include residential neighborhood planning and architectural design, historical environment renewal design, high-density urban environment, and regional design. He insists on exploring the appropriate patterns of high-density urban settlements in China, and the creative ways for urban historical environment renewal with regional cultural characteristics. Dr. DU tends to conduct research from the perspective of humanities and environment behavior with scientific methods, and also pays attention to the application of new technical tools, such as GIS, spatial syntax, and visual analysis tools. These attempts try to closely integrate physical environment analysis and environmental behavior research.
References
- Albarracin, D., and R. S. Wyer. 2000. “The Cognitive Impact of past Behavior: Influences on Beliefs, Attitudes, and Future Behavioral Decisions.” Journal of Personality and Social Psychology 79 (1): 5–22. doi:10.1037/0022-3514.79.1.5.
- Chan, S. 2013. Social Performance of Communal Sky Garden in a Dense Urban City - Hong Kong. The University of Hong Kong.
- Cui, C., W. Yang, C. Shi, M. Wang, X. Nie, and Y. Yin. 2020. “Personalized Image Quality Assessment with Social-Sensed Aesthetic Preference.” Information Sciences 512: 780–794.
- Department of Statistics Singapore. 2020. “Population and Population Structure.”
- Gehl, J. 2011. Life Between Buildings: Using Public Space. Washington, DC: Island Press.
- Goodchild, M. F. 2007. “Citizens as Sensors: The World of Volunteered Geography.” GeoJournal 69 (4): 211–221. doi:10.1007/s10708-007-9111-y.
- Haaland, C., and C. K. van den Bosch. 2015. “Challenges and Strategies for Urban Green-space Planning in Cities Undergoing Densification: A Review.” Urban Forestry & Urban Greening 14 (4): 760–771. doi:10.1016/j.ufug.2015.07.009.
- Hadi, Y., T. Heath, and P. Oldfield. 2014. “Vertical Public Realms: Creating Urban Spaces in the Sky.” CTBUH 2014 Shanghai Conference Proceedings, Shanghai.
- Hadi, Y., T. Heath, and P. Oldfield. 2018. “Gardens in the Sky: Emotional Experiences in the Communal Spaces at Height in the Pinnacle@Duxton, Singapore.” Emotion Space and Society 28: 104–113.
- Karimimoshaver, M., and P. Winkemann. 2018. “A Framework for Assessing Tall Buildings’ Impact on the City Skyline: Aesthetic, Visibility, and Meaning Dimensions.” Environmental Impact Assessment Review 73: 164–176.
- Liu, L., B. Zhou, J. Zhao, and B. D. Ryan. 2016. “C-IMAGE: City Cognitive Mapping through Geo-tagged Photos.” GeoJournal 81 (6): 817–861. doi:10.1007/s10708-016-9739-6.
- Liu, S., P. Cui, W. Zhu, S. Yang, and Q. Tian. 2014. “Social Embedding Image Distance Learning.” 617–626.
- Liu, X., Y. Song, K. Wu, J. Wang, D. Li, and Y. Long. 2015a. “Understanding Urban China with Open Data.” Cities 47: 4753–4761.
- Liu, Y., X. Liu, S. Gao, L. Gong, C. Kang, Y. Zhi, G. Chi, and L. Shi. 2015b. “Social Sensing: A New Approach to Understanding Our Socioeconomic Environments.” Annals of the Association of American Geographers 105 (3): 512–530. doi:10.1080/00045608.2015.1018773.
- Lotfi, Y. A., M. Refaat, M. El Attar, and A. Abdel Salam. 2020. “Vertical Gardens as a Restorative Tool in Urban Spaces of New Cairo.” Ain Shams Engineering Journal 11 (3): 839–848. doi:10.1016/j.asej.2019.12.004.
- Madan, A., M. Cebrian, D. Lazer, and A. Pentland. 2010. “Social Sensing for Epidemiological Behavior Change.” 291–300.
- Miao, P. 2001. Public Places in Asia Pacific Cities. Honolulu, USA: Springer-Science+Business Media, B.V.
- Microsoft Cognitive Services. 2016. “Computer Vision: An AI Service that Analyses Content in Images and Video.” https://azure.microsoft.com/zh-cn/services/cognitive-services/computer-vision/#features
- Mohammadi, M., and J. K. Calautit. 2019. “Numerical Investigation of the Wind and Thermal Conditions in Sky Gardens in High-Rise Buildings.” Energies 12 (7): 1380. doi:10.3390/en12071380.
- Oh, K. 1998. “Visual Threshold Carrying Capacity (VTCC) in Urban Landscape Management: A Case Study of Seoul, Korea.” Landscape and Urban Planning 39 (4): 283–294. doi:10.1016/S0169-2046(97)00085-6.
- Ong, B. L. 2003. “Green Plot Ratio: An Ecological Measure for Architecture and Urban Planning.” Landscape and Urban Planning 63 (4): 197–211. doi:10.1016/S0169-2046(02)00191-3.
- Osmundson, T. 1999. Roof Garden: History Design and Construction. New York: W.W. Norton.
- Payntar, N. D., W. Hsiao, R. A. Covey, and K. Grauman. 2021. “Learning Patterns of Tourist Movement and Photography from Geotagged Photos at Archaeological Heritage Sites in Cuzco, Peru.” Tourism Management 82: 104165.
- Pomeroy, J. 2014. The Skycourt and Skygarden: Greening the Urban Habitat. Routledge: Taylor & Francis Group.
- Pomeroy, J. 2016. Skycourts and Skygardens: Towards a Vertical Urban Theory. University of Westminster.
- Raji, B., M. J. Tenpierik, and A. van den Dobbelsteen. 2015. “The Impact of Greening Systems on Building Energy Performance: A Literature Review.” Renewable and Sustainable Energy Reviews 45: 610–623.
- Samant, S. 2019. “Cities in the Sky: Elevating Singapore’s Urban Spaces.” International Journal of High-Rise Buildings 2 (8): 137–154.
- Stamps, A. I., J. L. Nasar, and K. Hanyu. 2005. “Using Pre-construction Validation to Regulate Urban Skylines.” Journal of the American Planning Association 71 (1): 73–91. doi:10.1080/01944360508976406.
- Tian, Y., C. Y. Jim, and Y. Tao. 2012. “Challenges and Strategies for Greening the Compact City of Hong Kong.” Journal of Urban Planning and Development-ASCE 138 (2): 101–109. doi:10.1061/(ASCE)UP.1943-5444.0000076.
- Tien, P. W., and J. K. Calautit. 2019. “Numerical Analysis of the Wind and Thermal Comfort in Courtyards “Skycourts” in High Rise Buildings.” Journal of Building Engineering 24: 100735. doi:10.1016/j.jobe.2019.100735.
- Tony, I. 2013. “Sky Garden Design in High-density High-rise Residential Development.” Sustainable Building 2013 Hong Kong Regional Conference, Hong Kong.
- Urban Redevelopment Authority. 2009. “Circular Package: LUSH Programme - Landscaping for Urban Spaces and High Rises.”
- Urban Redevelopment Authority. 2014. “Landscaping for Urban Spaces and High-Rises (LUSH) 2.0 Programme: Landscape Replacement Policy for Strategic Areas.”
- Urban Redevelopment Authority. 2017. “Updates to the Landscaping for Urban Spaces and High-Rises (LUSH) Programme: LUSH 3.0.”
- Urban Redevelopment Authority & Singapore Government. 2019. “Singapore Master Plan 2019.”
- Wang, D., B. K. Szymanski, T. Abdelzaher, H. Ji, and L. Kaplan. 2019. “The Age of Social Sensing.” Computer 52 (1): 36–45. doi:10.1109/MC.2018.2890173.
- Wang, D., L. Kaplan, H. Le, and T. Abdelzaher. 2012. “On Truth Discovery in Social Sensing: A Maximum Likelihood Estimation Approach.” 233–244.
- World Economic Forum. 2018. These are the World’s Most Densely Populated Places. Cologny, Geneva Canton, Switzerland.
- Yeang, K. 1999. The Green Skyscraper: The Basis for Designing Sustainable Intensive Buildings. New York: Prestel.
- Yeang, K. 2002. Reinventing the Skyscraper: A Vertical Theory of Urban Design. Chichester, West Sussex: Wiley-Academy.
- Yoshimura, N., and T. Hiura. 2017. “Demand and Supply of Cultural Ecosystem Services: Use of Geotagged Photos to Map the Aesthetic Value of Landscapes in Hokkaido.” Ecosystem Services 24: 68–78.
- Yuliani, S., G. Hardiman, and E. Setyowati. 2020. “Green-Roof: The Role of Community in the Substitution of Green-Space toward Sustainable Development.” Sustainability 12 (4): 1429. doi:10.3390/su12041429.
- ZHOU, B., L. LIU, A. OLIVA, and A. TORRALBA. 2014. “Recognizing City Identity via Attribute Analysis of Geo-tagged Images”. Champ: Springer International Publishing. pp. 519–534.