
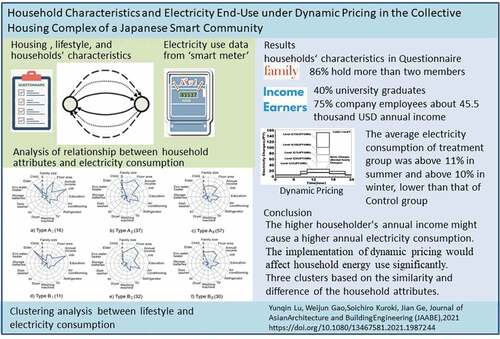
ABSTRACT
In this study, we focused on electricity consumption and household characteristics with Dynamic Pricing(DP) experiment in the collective housing complex of a Japanese Smart Community, which had been divided into two groups, Treatment group (110 households) and Control group (65 households). We collected and analyzed a questionnaire survey on the family attributes of residents and all housing electrical appliances to understand the actual conditions of household characteristics. The annual energy consumption by smart meters had been aggregated and analyzed to understand the actual conditions of electricity end-use of the households. The results showed the main factors of household, which affect the electricity consumption, were floor area, family number, income of households, and the number of air conditioner. During dynamic pricing experiment in summer and winter, we found that the implementation of Dynamic Pricing would affect household users' habits of using electrical equipment and had a contribution to energy peak cut. Through the hierarchical cluster analysis, we divided both group into three types of household characteristics respectively. The result has revealed that the family structure would affect the electricity consumption during Dynamic Pricing implement.In this study, we focus on energy consumption and household characteristics with dynamic pricing experiment in the collective housing complex of a Japanese Smart Community. we collected and analyzed a questionnaire survey on the family attributes of residents and the lifestyle of all housing equipment to understand the actual conditions such as the attributes of the resident generation. The annual energy consumption by smart meters will be aggregated and analyzed to understand the actual conditions of electricity consumption of the resident generation. Based on the aggregated results, a database of lifestyle patterns and energy consumption is constructed, and the relationship between each factor and energy consumption, and each lifestyle pattern has been analyzed.
GRAPHICAL ABSTRACT
1. Introduction
In the recent years, with population increase and environmental problems, urbanization has become a big problem, and the topic of sustainable low-carbon urban development has spread all over the world (Smart Cities World Citation2020). Therefore, new words such as smart cities and smart communities, which were also called eco-friendly cities, were born, and many demonstration projects have been in underway in the world. In 2010, a 5-year-plan demonstration experiment was proposed by Japanese Ministry of Economy, Trade, and Industry (METI) (Ministry of Economy Citation2011). Kitakyushu city had been selected as one of model cities to execute a new environmental model city project called Higashida Smart Community, based on the concept of compact city development that is friendly to people and the environment (Kitakyushu Smart Community Promotion Organization Citation2013). In the Higashida Smart Community, energy savings of 30% has been requested in 2030, which compared to present districts by improving environmental facilities and introducing various new energy resources. CO2 has been requested to reduce by more than 50% compared to present situation in 2050 by introducing renewable energy, introducing energy-saving systems for buildings, improving efficiency with grids, improving social systems such as transportation and community systems. For that purpose, the consciousness of the people who lived and worked in the town was important. Here, a demonstration of “Dynamic Pricing” has been introduced, which aimed to decrease peak power consumption with the participation of citizens who were the consumers of energy. This epoch-making effort to introduce electricity price fluctuations had attracted people’s attention. This was a bold challenge that was unique in Japan and the world.
Estiri (Citation2014) analyzed the direct, indirect, and total impacts of household and building characteristics on the annual energy consumption of US residential buildings. Results demonstrate that the direct impact of household characteristics on residential energy consumption is significantly smaller than the corresponding impact from the buildings. Wang et al. (Citation2018) simulated Chinese household’s 24-h electricity demand profile, and analyzed how households adjust their electricity use activities under the dynamic real-time pricing scheme. Their results showed that real-time pricing had the potential to shift residential electricity load from peak to off-peak periods and reduced total electricity consumption. Mizutani, Tanaka, and Nakamura (Citation2018) investigated the effect of demand response on households “electricity consumption under the existence of the reference price effect. The reference price effect was observed in peak and shoulder hours. Consistent with reference price theory predictions, their results showed that the reduction of electricity consumption was greater in the case where the current price was higher than the previous price. (Krishnendranath Mitra,Goutam Dutta (Citation2018) proposed an optimization model for scheduling electrical appliances for an individual household under dynamic prices which were a function of that household’s planned consumption and forecasted grid load. Kaygusuz (Citation2019) indicated that broadcasting of dynamic energy price signals for consumer’s demand response programs (agents) was an effective and feasible way for demand side load management in future smart grids and presented a control theoretic energy market management approach based on closed loop elastic demand control scheme by means of dynamic price signal broadcasting. Fahim and Sillitti (Citation2019) analyzed the energy consumption to infer household characteristics automatically by analyzing the smart meter energy consumption logs with less 20 households in Innopolis, Russia, in which number of inhabitants, employment status, electrical appliances and bed rooms had been investigated with energy consumption. Kim, Jung, and Baek (Citation2019), examined the relationships between the characteristics and energy consumption of single-person households in Korea. Yoo, Eom, and Han (Citation2020), tried to seek the multifaceted influences that shape energy-related behavior in residential buildings and offered new tools to help utility regulators, and improve the cost-effectiveness of their programs. Karlsena, Hamdya, and Attia (Citation2020) introduced energy and cost oriented methodology that provided informative support for utility companies and electric-grid customers including households” occupants to assess the economic incentives of different energy and power dynamic pricing tariffs. Ren, Sunikka-Blank, and Zhang (Citation2020) focused on the characteristics of energy use in urban households, the demographics of high energy consumers, and attitudes towards energy saving and smart meters and the survey results revealed a great variety within the target group of urban young household. Lu et al. (Citation2020) developed a model of household energy management based on smart residential energy hub (SREH) to minimize both the energy consumption expense and comfort deviation. In the Lu’s study, a control strategy was proposed through the physical characteristics and household users’ preferences. Suna, Zhoua, and Yanga (Citation2020) used data which were publicly released by Irish Social Science Data Archive (ISSDA, 2012) to logistic regression model to consider the dwelling characteristics, family characteristics and household appliances. Trott (Citation2020) investigated household characteristics that had an influence on electricity load patterns by employing multinomial probit regression in Danish households. Mao et al. (Citation2020) studied household energy use pattern, types of household energy and its impacts in rural area, Chongqing. Son and Yoon (Citation2020) used micro data from Vietnam to study how a national grid expansion was translated into households’ electricity use over time and revealed that household income was an important determinant of electricity consumption, and that this relationship was highly nonlinear with respect to income. Zhao et al. (Citation2021) presented a short-term household load forecasting model based on the users’ electricity consumption behavior under the three pricing schemes. Ofetotse, Essah, and Yao (Citation2021) developed distinct household typologies by using questionnaire data of 310 households collected in a locality in Botswana with dwelling type, tenure, the number of rooms, the number of bedrooms, annualized electricity consumption and the number of appliances. About the Japan house study, Tran et al. (Citation2021) characterized the Japanese household properties and investigated the electricity consumption by end-use of 12 households in electric-only apartments in Japan. In Tran, Gao, and Ge (Citation2021) new study, a multi-dimensional hybrid approach that combines multiple interactions between observation-based and simulation-based data using energy modeling’s graphical interface software had been introduced with the consideration of household factors such as family size, housing design, and occupancy ratio. Wang et al. (Citation2021) analyzed the effects of electricity prices and habits on electricity consumption behavior, and found that the effect of electricity prices on residential electricity consumption is not significant, which needed to discuss furtherly. Ryu, Kim, and Kim (Citation2021) investigated the impact of rapid demographic changes in Korea on residential electricity use, and suggested stakeholders and industry analysts should consider household differentiation to prepare the long-run electricity provision policy as well as the proper billing system. Bohlmann and Inglesi-Lotz (Citation2021) examined the determinants of the residential electricity demand in South Africa for the period 1975–2016, including disposable income, electricity prices, food prices as well as the impact of the 2007/08 load-shedding wave and the 2008 electricity price restructuring. Goyal and Vadhera (Citation2021) implemented a proposed algorithm for residential consumers of different categories with real time pricing data to minimize the monthly electricity bill cost as well as peak demand under uncertain electricity prices.
Figure 1. Dynamic pricing charge table.
Figure 2. Research objective: LIVIO Higashida Ville Court.
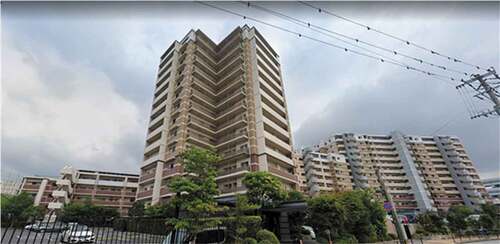
Figure 3. Research flow.
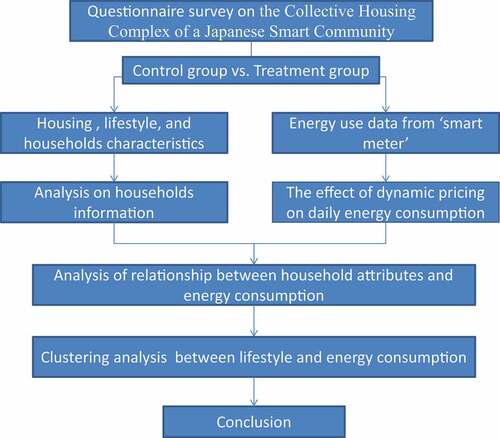
Figure 4. Percentage of household members.
Although there were many studies on the energy consumption in residential house, a very few of research had plenty of data from the surveys that can clarify the relation between energy use and household characteristics. In the demonstration project of Smart Community, a detail questionnaire survey on the household attributes, the lifestyle of all housing and equipment of residents had been carried out. In this study, we used the detail questionnaire survey to try understanding of the relation between the energy use and household characteristics on the collective housing complex of Higashida Smart Community, Kitakyushu, Japan. Based on the aggregated results, a database of lifestyle patterns and energy consumption is constructed, and the relationship between energy consumption, and lifestyle pattern had been analyzed. The characteristics and actual conditions of each energy consumption were grasped, and the factors affecting the energy consumption were clarified. The results of this research were intended to contribute to energy-saving projects by helping to make new efforts to create environmental model cities in the future.
Dynamic pricing, also called real-time pricing, was an approach to setting the cost for a product or service that is highly flexible. In this study, the activation time of dynamic pricing was divided into two patterns, summer, and winter. showed the price tables for summer and winter respectively (Ministry of Economy Citation2011). In summer, when the expected maximum temperature of the next day was 30 degrees or more, it would be activated at the peak time of 13:00–16:00 the next day. There were five levels for peak charges, 15 JPY/kWh (1USD = 110JPY,0.14USD/kWh) for level 1, 50 JPY/kWh (0.45USD/kWh) for level 2, 75 JPY/kWh (0.45USD/kWh) for level 3, 100 JPY/kWh (0.90 USD/kWh) for level 4, and 150 JPY/kWh (1.36USD/kWh) for maximum level 5. Each level is up to 12 days, total up to 48 days. In winter, when the expected minimum temperature of the next day is below 5°C, it would be activated at two peak times from 8:00 am to 10:00 am in the morning and from 18:00 to 20:00 pm at night. Peak charges were set to be the same as during summer.
2. Research objective and study method
This study targeted the householders who have been living in a collective housing complex, called LIVIO Higashida Ville Court, in Higashida Smart Community (). LIVIO Higashida Ville Court included two buildings, which were all-electric home. One had 79 households with 14th floor built in 2008 and the other had 139 household with 13th floor built in 2009. The floor area varied from 60 m2 to 140 m2,
10% for 60–70 m2, 10% for 70–80 m2, 30% for 80–90 m2, 20% for 90–100 m2, and 30% for above 100 m2.
At the design stage of dynamic pricing experiment, we want to gather 70 households for three groups, two treatment groups and one control group. For one treatment group, the smart meter would notify the customer the charges of electricity price at “around 15:00 the day before“ and ”the morning of the day” with Dynamic Pricing Implementation. For another treatment group the smart meter would not notify the customer the charges of electricity price, which would cause the customers additional charges in electricity consumption because of no action against DP implementation. After careful discussion, Kitakyushu city decided to treat two treatment group as the same condition. In this paper, therefore, we combined two treatment group to Treatment Group A with 110 households and changed control group to Control Group B with 65 households, shown in . In Treatment group, the number of participants for all 120 households in the housing complex was 114, and the participation rate was 95%. In addition, the number of valid responses excluding omissions was 110, and the valid response rate of the collected questionnaires was 96.5%. Control group had 66 participants for all 70 households, and the participation rate was 94.3%. In addition, the number of valid responses excluding omissions was 65, and the valid response rate of the collected questionnaire was 98.5%. Totally, about 80.3% households in the LIVIO Higashida Ville Court, had participated in these important experiments.
Table 1. Group survey information.
The research flow had been shown in . Firstly, we carried out questionnaire on all the households. The information of the questionnaire survey was shown in . The housing plan, floor plan, area and orientation had been surveyed. For family characteristics, family size, gender, age of each family member, occupation of householder, education background of householder, and annual income of householder had been investigated. The householders also infilled the information about electrical appliances including air conditioner, TV, washing machine, dryer, IH, dishwasher, storage batteries, refrigerator, and water heater.
Table 2. Contents of questionnaire survey.
The data of electricity use would be recorded in smart meter and were sent to the Community Energy Management System (CEMS), which was a control center in Higashida area.
Secondly, we separately analyzed the relation between energy consumption and household attributes, including family size, annual income of householder, and appliances to clear the effects of household attributes and electricity consumption. At the same time, we studied the effect of dynamic pricing on the daily energy consumption in summer and winter during the “Dynamic Pricing” implementation period.
At last, we used hierarchical cluster analysis (HCA) (Kaufman and Rousseeuw Citation1990) to classify household attributes into different group and to find the relationship between the lifestyle and energy consumption of different group.
3. Results and discussion
3.1. Family size
showed the ratio of the number of household members in each group. In Treatment Group A, most households had three family members. Households with more than two family members accounted for 86% of the total households. In Control Group B, most households had three family members as well. Households with more than two family members accounted for 89% of the total households. The situation was similar with Treatment Group A.
The structure of each household was shown in . Many households in Treatment Group A were mainly composed of a couple (14%), a couple and one child (33%), and a couple and two children (25%), which shared more than 77% of households if a couple and three children were included. In addition, the proportion of elderly household (age>65 years old) was about 17%, and the proportion of elderly couples was about 7%. Control Group B was basically the same as Treatment Group A, but the elderly households accounted for 21%, among which the elderly couples shared a half.
In addition, from the information of primary income earners collected in this survey, as shown in , many primary income earners were university graduates, accounting for over 40% of the total households. Followed by high school graduation, accounting for 37% of the total households. The proportion of households with final education in Control Group B was similar as that in Treatment Group A. Many primary income earners were university graduates, followed by high school graduates.
Figure 5. Family structure of each group.
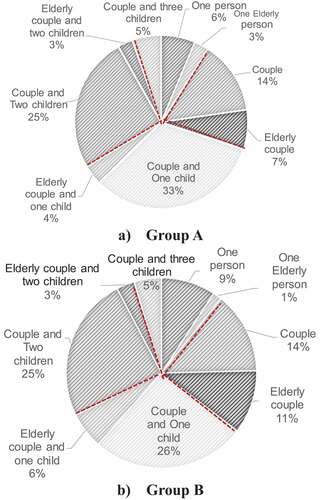
Figure 6. Percentage of final educational background of primary income earner.
Figure 7. Percentage of primary income earner.
The job occupation status of the head of the household was shown in , and the occupation status of the Treatment Group A was most company employees, which was 75%. In addition, managers, civil servants, and unemployed persons each accounted for 10% of the total households. Although primary income earners were “unemployed“, “unemployed” here was regarded as ”retired” if family members over the age of 60. The occupation of primary income earners in Control Group B was the same as that in Treatment Group A, but the proportion of other occupations was slightly higher than that in Treatment Group A. Similarly, the “unemployed” status in Control Group B was considered to be ‘retired’.
The results of the primary income earners’ annual income survey were shown in . Households with an annual income of more than 5 million JPY (about 45.5 thousands USD) accounted for 69% of the total households, surpassing the results of the Private Salary Actual Statistical Survey in 2012 issued by National Tax Agency of the Japanese government, in which the average annual salary of employees, who work throughout the year in Japan, was 4.68 million JPY (about 42.5 thousands USD) (National Tax Agency Citation2013). About 65% of Control Group B households with an annual income of 5 million JPY (about 45.5 thousands USD) or more.
Figure 8. Percentage of household annual income.
Figure 9. Percentage of housing equipment owned in the Group.
Figure 10. Annual household power consumption and floor area.
Figure 11. Electricity consumption and family size.
Figure 12. Electricity consumption and incomes.
Figure 13. Electricity consumption and number of air conditioner.
3.2. Housing equipment information
showed the proportion of housing equipment owned by Treatment Group A and Control Group B, respectively. In Higashida houses, various energy-saving devices were introduced to reduce electricity consumption, for example, using EcoCute instead of using an electric water heater. Instead of the more conventional ammonia or haloalkane gases, EcoCute uses supercritical carbon dioxide as a refrigerant. The technology offers a means of energy conservation and reduces the emission of greenhouse gas. As shown in , all households in Treatment Group A and Control Group used EcoCute. Some households had dishwashers and dryers with above 28% or more in both groups. Almost households were equipped with induction heating (IH) for cooking, washing machine and refrigerator. On the other hand, some households had two to three refrigerators (around 4%) and two to five TVs (about 50%) for both groups, while 84% of households had two or more air conditioners for both groups.
4. Relationship between household attributes and energy consumption
LIVIO Higashida Ville Court was adopted as a symbiotic housing by the Ministry of the Environment in December 2006 for the “Whole city block with 20% CO2 reduction project”. In April 2010, Higashida was selected as a model area for the Kitakyushu Smart Community Project, and in August of the same year, the Kitakyushu Smart Community Project started (Ministry of Economy Citation2011). In April 2010, we installed smart meters in each home and started collecting data on electricity consumption and usage. The experiment of dynamic pricing began in April 2012.
4.1. Floor area and annual energy consumption
showed the ratio of the total floor area of both groups and the annual electricity consumption. With the increase of the house floor area, the annual electricity consumption would increase. Compared with the two group, the annual electricity consumption of Control Group B seemed higher than that of Treatment Group A when the floor area was lower than 70 m2 or larger than 100 m2. During 70–90 m2 of floor area, the consumption of Treatment Group A was higher than that of Control Group B.
4.2. Family size and annual energy consumption
The relation between the family size and the annual electricity consumption was shown in . The more the family people, the higher the annual electricity consumption. Additionally, it was found that the larger the family number, the lower the annual power consumption per capita.
Furthermore, looking at the relationship between annual income of primary income earner surveyed (), it was found that the higher the householder’s annual income, the higher the annual electricity consumption.
4.3. Number of air conditioner and annual energy consumption
The relationship between annual electricity consumption and number of air conditionings was shown in . From the results, as the number of air conditionings they own, increased, the annual electricity consumption of these two groups tended to increase. Households with three or four air conditionings in Control Group B had higher annual electricity consumption than Treatment Group A. The reason might be that treatment Group A was subject to demand response verification, so it was conceivable that user of Treatment Group A would care more energy saving than Control Group B. And the air conditioners were the main equipment that we can turn on or off for energy saving in a home.
5. The effect of dynamic pricing on daily energy consumption
In summer, when the expected maximum temperature of the next day is 30 degrees or more, Dynamic Pricing would be activated at the peak time of 13:00–16:00 the next day. showed the day number of DP implement and real maximum air temperature during the summer of 2012. There were totally 40 days for 2012 summer, 15 days for July, 20 days for August, and 5 for September to implement dynamic pricing with different levels.
showed the average daily electricity consumption between Treatment and control group on the day with DP in summer. During 13:00–16:00. Electricity consumption of control group was higher than that of treatment group. Even after 16:00, there was still the same tendency until 18:00. On the other time, the two group almost had the same consumption curve, although during 4:00–6:00, electricity consumption of treatment group was higher than that of control group. All the households used EcoCute for hot water supply, which was an energy efficient electric heat pump by using supercritical carbon dioxide as a refrigerant. EcoCute generally had used the night cheap electricity to produce the hot water for the whole day use, in this case around 4:00–6:00 . The reason was not determined, and it seemed that treatment group spent more electricity in night than the daytime.
showed the average electricity consumption during DP time (13:00–16:00) in July, August, and September. With comparison between treatment and control group, the average electricity consumption of Treatment group A was 11.3% in July, 13.0% in August and 0.8% in September lower than that of Control group B. The result showed that the implementation of dynamic pricing would affect household energy use significantly.
Figure 14. DP implement and maximum air temperature in summer.
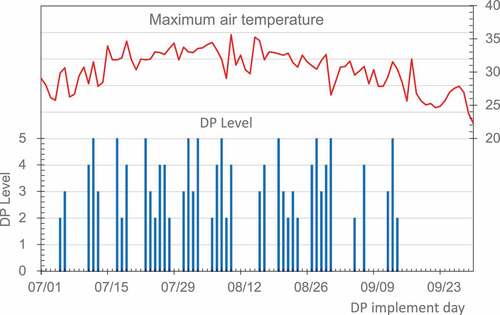
Figure 15. Average daily power consumption on the day with DP in the summer.
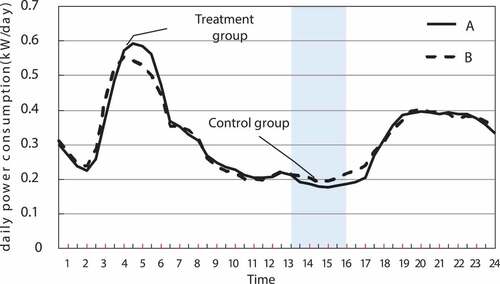
Figure 16. Average electricity consumption during DP time (13:00–16:00) in July, August, and September.
Figure 17. DP implement and maximum air temperature in winter.
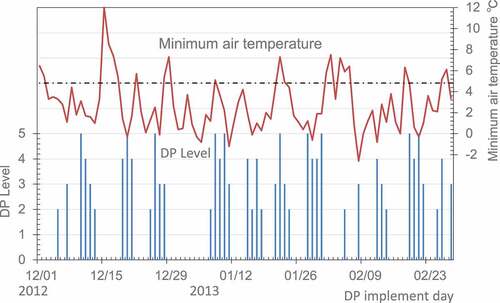
Figure 18. Average daily power consumption on the day with DP in the winter.
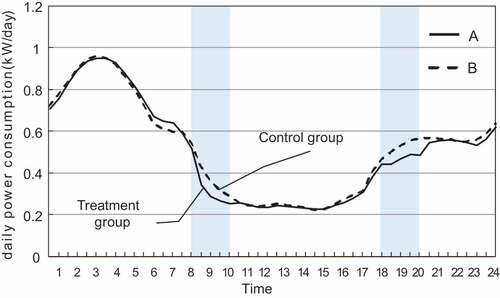
Figure 19. Average electricity consumption during DP time (8:00–10:00 and 18:00–20:00) in December, January, and February.
In winter, when the expected minimum temperature on the second day was below 5°C, it would be activated during two peak hours, 8:00 am to 10:00 pm and 18:00–20:00 pm. showed the day number of DP implement and real maximum air temperature in the winter, when DP was activated. There were totally 42 days for winter, 13 days for December, 17 days for January, and 12 for February to implement dynamic pricing with different levels.
showed the average daily electricity consumption between Treatment and Control Group on the day with DP in winter. During 8:00–10:00 and 18:00–20:00, electricity consumption of control group was higher than that of treatment group. On the other time, the two group almost had the same consumption curve.
showed the average electricity consumption during DP time (8:00–10:00 and 18:00–20:00) in December, January, and February. With comparison between treatment and control group, the average electricity consumption of Treatment group A is from 7.8 to 16.2% lower than that of Control group B. The result showed that the implementation of dynamic pricing will affect household energy use significantly in winter, too.
6. Relationship between lifestyle and energy consumption
The analysis so far had clarified to some extent the relationship between some influencing factors of lifestyle (such as household attributes and family member) and the average annual electricity consumption. In this part, we used hierarchical cluster analysis (HCA) to analyze the relationship between household characteristics and electricity consumption for the treatment and control groups.
As shown in , The data of household characteristics was divided into 6 grades from grade 1 (G1 represent value 0) to grade 6 (G6 represent value 6). The factors included family size, Floor area, annual income, occupation, educational background, and electrical appliances. We also included family structure which consider whether the elderly people or child include in the family. And electrical appliances covered air conditioner, refrigerator, TV, dryer, and so on.
Table 3. Classification of household characteristics.
We used cluster regression method to analyze more than 3000 data shown in . The result of cluster analysis, as shown in for Treatment Group A, could create three clusters (red line) based on the similarity and difference of the variable attributes. We could get the same structure for Group B divided into three clusters. The household characteristics of group A and B were shown in .
From the , we could find that (AI, BI), (AII, BII), (AIII,BIII) almost had the same figure structure. Besides the number of air conditioner, Japanese households had all electrical appliances such as refrigerator, TV, dryer, and washing machine, which reflected those collective housings studied here, almost had the same living standard.
In Type (AI, BI), most of them were households with elderly people over 60 years’ old and retired, which could be called “elder” type. In those type, annual income was lower than that of other types. Floor area of this type was around 90–100 m2 for type AI, and 70–80 m2 for type BI.
In Type (AII, BII), family size, floor area, and annual income had been shown as high value. Those households had three or more air conditioner. We could call this type of families a “high-index” type.
In Type (AIII,BIII), floor area was smaller than that of Type (AII, BII).The other factors were almost in the middle values compared with other types, which we called as a “middle-index” type.
Figure 20. Tree diagram of hierarchical clustering analysis (Ward method, for A type).
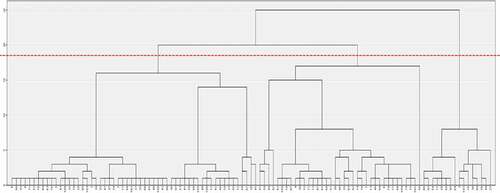
Figure 21. Cluster analysis of household characteristics.
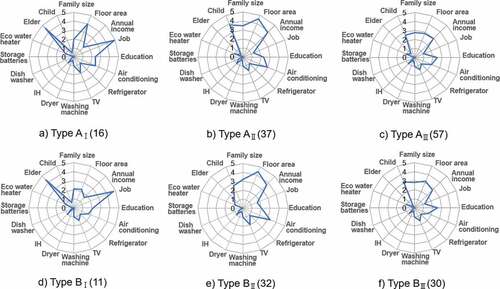
Figure 22. Annual total power consumption of households for different types.
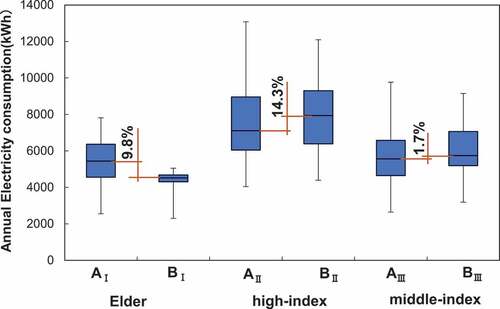
The average annual total electricity consumption by Treatment group A and Control group B was shown in . Generally, “high-index” types had a higher electricity consumption than that of other types. Besides “elder” type, electricity consumption of Treatment group A was 14.3% for high-index, 1.7% for middle-index lower than that of Control group B, which might reflect the effects of dynamic pricing system.
Although “elder” type had a less electricity consumption than other types due to less people lived in the house, the electricity consumption of Type AI is 9.8% higher than that of Type BI. The reason was maybe explained by that floor area of Type AI was larger than that of Type BI in ). And almost families in “elder” type did not do a response for DP implement announcement. In other words, demand response demonstrations did not affect the lifestyle of “elder” type.
7. Conclusions
In this study, we focused on electricity consumption and household characteristics with dynamic pricing experiment in the collective housing complex of a Japanese Smart Community, which had been divided into two groups, Treatment group (110 households) and Control group (65 households). The results obtained in this study were summarized below.
In the surveyed buildings, households with more than two family members accounted above 86%., which reflected the surveyed houses belonged to the family type home. Many primary income earners were university graduates, accounting for 40% of the total households, followed by high school graduation. 75% of households were company employees and their annual income was more than 5 million JPY (about 45.5 thousand USD), which was higher than average income 4.68 million JPY (about
42.5 thousand USD) of Japanese employees.
All households in Treatment Group A and Control Group B used EcoCute. Almost households were equipped with induction heating (IH) for cooking, washing machine and refrigerator. On the other hand, some households had two to three refrigerators (around 4%) and two to five TVs (about 50%) for both groups, while 84% of households had two or more air conditioners for both groups.
Compared with the two group, the annual electricity consumption of Control Group B seemed higher than that of Treatment Group A when the floor area was lower than 70 m2 or larger than 100 m2. During 70–90 m2 of floor area, the consumption of Treatment Group A was higher than that of Control Group B.
The more the family people, the higher the annual electricity consumption. Additionally, it was also found that the larger the family number, the lower the annual power consumption per capita. The higher householder’s annual income might cause a higher annual electricity consumption.
Households with three or four air conditionings in Control Group B had higher annual electricity consumption than Treatment Group A. The reason might be that Treatment Group A was subject to demand response verification.
With comparison between treatment and control group in summer, the average electricity consumption of Treatment group A is 11.3% in July, 13.0% in August, and 0.8% in September, lower than that of Control group B. In winter, the average electricity consumption of Treatment group A is from 7.8 to 16.2% lower than that of Control group B. The results showed that the implementation of dynamic pricing would affect household energy use significantly.
Cluster analysis for both groups, could create three clusters based on the similarity and difference of the household attributes. The three types of the cluster can be defined “elder” type (AI, BI.), “high-index” type (AII, BII), and “middle-index” type (AIII,BIII). Generally, “high-index” types had a higher electricity consumption than that of other types. Besides “elder” type, electricity consumption of Treatment group A was 14.3% for high-index, 1.7% for middle-index lower than that of Control group B, which might reflect the effects of dynamic pricing system. Although “elder” type had a less electricity consumption than other types due to less people lived in the house, the electricity consumption of Type AI was 9.8% higher than that of Type BI. The reason might be explained by that floor area of Type AI was larger than that of Type BI. And almost families in “elder” type did not do a response for DP implement announcement. In other words, demand response demonstrations did not affect the lifestyle of “elder” type.
This study could have a contribution to understand the relationship between the household characteristics and energy use and to certificate the effects of dynamic pricing on the energy saving and peak cutting.
Disclosure statement
No potential conflict of interest was reported by the author(s).
Additional information
Funding
Notes on contributors
Yunqin Lu
Ms. Yunqin Lu is a PhD candidate at the Department of Architecture, The University of Kitakyushu, Japan with the study of energy and environment issue in residential houses.
Weijun Gao
Dr. Weijun Gao is a tenured professor at the University of Kitakyushu, Japan and Academia Professor, Qingdao University of Technology, China. He has been a visiting professor at many universities including China and USA, such as Xi'an Jiaotong University, Zhejiang University, and Lawrence Berkeley National Laboratory, USA. Professor Gao's research interests include: the science, engineering, management, and dissemination of city environment planning, distributed energy system, building material recycle, health and environmental impacts of energy generation and use, geographic information system, climate change, especially in urban area, and energy forecasting
Soichiro Kuroki
Dr. Soichiro Kuroki is an emeritus professor at the Department of Architecture, The University of Kitakyushu, Japan. He has more than 40 years’ experience in the study of architecture environment planning also is an expert of architectural acoustics
Jian Ge
Dr. Jian Ge is the deputy dean of the Department of Architecture, and a professor at the Institute of Building Technology, Zhejiang University She also serves as the deputy dean of the International Design and Research Institute of Zhejiang University. She is engaged in research in the field of building technology science.
References
- Bohlmann, J. A., and R. Inglesi-Lotz. 2021. “Examining the Determinants of Electricity Demand by South African Households per Income Level.” Energy Policy 148:111901. January. Part A. doi:10.1016/j.enpol.2020.111901.
- Estiri, H. 2014. “Building and Household X-factors and Energy Consumption at the Residential Sector: A Structural Equation Analysis of the Effects of Household and Building Characteristics on the Annual Energy Consumption of US Residential Buildings.” Energy Economics 43: 178–184. doi:10.1016/j.eneco.2014.02.013.
- Fahim, M., and A. Sillitti. 2019. “Analyzing Load Profiles of Energy Consumption to Infer Household Characteristics Using Smart Meters.” Energies 12: 773. doi:10.3390/en12050773.
- Goyal, G. R., and S. Vadhera. 2021. “Multi-interval Programming Based Scheduling of Appliances with User Preferences and Dynamic Pricing in Residential Area.” Sustainable Energy, Grids and Networks 27 (July): 100511. doi:10.1016/j.segan.2021.100511.
- Karlsena, S. S., M. Hamdya, and S. Attia 2020. “Methodology to Assess Business Models of Dynamic Pricing Tariffs in All-electric Houses.” Energy and Buildings 207: 109586. doi:10.1016/j.enbuild.2019.109586.
- Kaufman, L., and P. J. Rousseeuw. 1990. Finding Groups in Data: An Introduction to Cluster Analysis. 1 ed. New York: John Wiley.
- Kaygusuz, A. 2019. “Closed Loop Elastic Demand Control by Dynamic Energy Pricing in Smart Grids.” Energy 176 (1, June): 596–603. doi:10.1016/j.energy.2019.04.036.
- Kim, S., S. Jung, and S.-M. Baek. 2019. “A Model for Predicting Energy Usage Pattern Types with Energy Consumption Information according to the Behaviors of Single-Person Households in South Korea.” Sustainability 11: 245. doi:10.3390/su11010245.
- Kitakyushu Smart Community Promotion Organization. 2013. “Kitakyushu Smart Community Creation Business Overview.”
- Krishnendranath Mitra,Goutam Dutta. 2018. “A Two-part Dynamic Pricing Policy for Household Electricity Consumption Scheduling with Minimized Expenditure.” International Journal of Electrical Power & Energy Systems 100:29–41. September. doi: 10.1016/j.ijepes.2018.01.028.
- Lu, Q., S. Lü, Y. Leng, and Z. Zhang. 2020. “Optimal Household Energy Management Based on Smart Residential Energy Hub considering Uncertain Behaviors.” Energy 195: 117052. doi:10.1016/j.energy.2020.117052.
- Mao, S., S. Qiu, L. Tao, M. Tang, H. Deng, and H. Zheng. 2020. “Using Characteristic Energy to Study Rural Ethnic Minorities’ Household Energy Consumption and Its Impact Factors in Chongqing, China.” Sustainability 12: 6898. doi:10.3390/su12176898.
- Ministry of Economy. 2011. “Trade and Industry of Japan, toward the Construction of Next-Generation Energy/Social Systems-What We See from Demonstrations.”
- Mizutani, F., T. Tanaka, and E. Nakamura. 2018. “The Effect of Demand Response on Electricity Consumption under the Existence of the Reference Price Effect: Evidence from a Dynamic Pricing Experiment in Japan.” The Electricity Journal 31 (1): 16–2217. doi:10.1016/j.tej.2018.01.004.
- National Tax Agency. 2013. “Private Salary Actual Statistical Survey in 2012.” 6. September.
- Ofetotse, E. L., E. A. Essah, and R. Yao. 2021. “Evaluating the Determinants of Household Electricity Consumption Using Cluster Analysis.” Journal of Building Engineering 43 (November): 102487. doi:10.1016/j.jobe.2021.102487.
- Ren, G., M. Sunikka-Blank, and X. Zhang. 2020. “Young Urban Households in Shanghai, China: Characteristics of Energy Use and Attitudes.” Sustainable Cities and Society 60: 102174. doi:10.1016/j.scs.2020.102174.
- Ryu, J.-Y., D.-W. Kim, and M.-K. Kim. 2021. “Household Differentiation and Residential Electricity Demand in Korea.” Energy Economics 95 (March): 105090. doi:10.1016/j.eneco.2020.105090.
- Smart Cities World. 2020. “Open and Interoperable Smart Cities: Closing the Gap.” White Paper.
- Son, H., and S. Yoon. 2020. “Reducing Energy Poverty: Characteristics of Household Electricity Use in Vietnam.” Energy for Sustainable Development 59 (December): 62–70. doi:10.1016/j.esd.2020.08.007.
- Suna, L., K. Zhoua, and S. Yanga. 2020. “An Ensemble Clustering Based Framework for Household Load Profiling and Driven Factors Identification.” Sustainable Cities and Society 53 (February): 101958. doi:10.1016/j.scs.2019.101958.
- Tran, L., W. Gao, and J. Ge. 2021. “Sensitivity Analysis of Household Factors and Energy Consumption in Residential Houses: A Multi-dimensional Hybrid Approach Using Energy Monitoring and Modeling.” Energy & Buildings 239: 110864. doi:10.1016/j.enbuild.2021.110864.
- Tran, L., W. Gao, D. Novianto, D. Novianto, Y. Ushifusa, and H. Fukuda. 2021. “Relationships between Household Characteristics and Electricity End-use in Japanese Residential Apartments.” Sustainable Cities and Society 64 (January): 102534. doi:10.1016/j.scs.2020.102534.
- Trott, G. 2020. “An Empirical Analysis of Domestic Electricity Load Profiles: Who Consumes How Much and When?” Applied Energy 275: 115399. doi:10.1016/j.apenergy.2020.115399.
- Wang, B., Z. Yuan, X. Liu, Y. Sun, B. Zhang, and Z. Wang 2021. “Electricity Price and Habits: Which Would Affect Household Electricity Consumption?” Energy and Buildings 240: 110888. doi:10.1016/j.enbuild.2021.110888.
- Wang, H., H. Fang, X. Yu, and S. Liang. 2018. “How Real Time Pricing Modifies Chinese Households’ Electricity Consumption.” Journal of Cleaner Production 178 (20, March): 776–790. doi:10.1016/j.jclepro.2017.12.251.
- Yoo, S., J. Eom, and I. Han. 2020. “Factors Driving Consumer Involvement in Energy Consumption and Energy-Efficient Purchasing Behavior: Evidence from Korean Residential Buildings.” Sustainability 12: 5573. doi:10.3390/su12145573.
- Zhao, X., W. Gao, F. Qian, and J. Ge 2021. “Electricity Cost Comparison of Dynamic Pricing Model Based on Load Forecasting in Home Energy Management System.” Energy 229: 120538. doi:10.1016/j.energy.2021.120538.