
 ?Mathematical formulae have been encoded as MathML and are displayed in this HTML version using MathJax in order to improve their display. Uncheck the box to turn MathJax off. This feature requires Javascript. Click on a formula to zoom.
ABSTRACT
A time-controlled solar assisted air source heat pump (SAHP) system was proposed in accordance with the climate characteristics of Xinjiang. Combined with an actual project of rural office building in Xinjiang, the time-controlled SAHP system test study was carried out . Test results showed that, on a typical day in the slightly cold period (SCP), the heat collection efficiency of the solar collectors was 68.12%, the solar energy utilization rate was 84.22%, and the indoor temperature increased by 5.2°C. On a typical day in the bitter cold period (BCP), the time-controlled SAHP system could provide more than 70% of the heating consumption. Furthermore, the feasibility of the time-controlled SAHP system was evaluated based on the data of the SAHP system and the traditional coal-fired boiler system in the same period. In comfort, the indoor temperature maintained at 14–20.2°C, and the average temperature was 18°C. In economy, the coal consumption of the time-controlled SAHP system was 18.34 kg/m2 during the heating period, which was 25.0% of that of the traditional heating method. In environmental protection, the time-controlled SAHP system could reduce CO2 emissions by 149.10 kg/m2, NOx emissions by 4.47 kg/m2, and SO2 emissions by 2.24 kg/m2 during the heating period.
Highlights
A feasible SAHP system for rural areas in Xinjiang has been clarified
An experimental study was carried out to verify comfort and economy.
Operating characteristics of the various parts have been analyzed.
The influence of climate on the system has been discussed.
Curves fitted by statistical data show a better prediction performance.
1. Introduction
Indoor air pollution caused by civil combustion of solid fuels is a major health hazard in China’s rural environment (Li et al. Citation2016a). The inefficient operation of a large number of indoor civil boilers has caused air pollution and respiratory diseases for users (Chen et al. Citation2016). Household combustion of solid fuels, as the second most essential environmental risk factor for premature deaths in China, has caused about 605 thousand premature deaths in 2016 (Chen et al. Citation2018). The traditional heating methods need to be changed in China’s Xinjiang province. There are about 80,000 people relying on coal-fired boilers for heating in the suburbs and rural areas. Questionnaires showed that each household in Shihezi city of Xinjiang burned up to 10 tons of coal in winter. That caused a large amount of coal consumption and air pollution.
Recently, a number of renewable technologies have been proposed to address the current environmental challenge (Johansson et al. Citation1993), including solar thermal electric technology (Duffie, Beckman, and Worek Citation1994), biomass conversion technology (Heidari et al. Citation2018), purified coal technology (Melikoglu Citation2018) and heat pump technology (Shi et al. Citation2019). The solar assisted air source heat pump (SAHP) system has been extensively investigated and applied to develop novel heating systems (Ni et al. Citation2016). Since the air source heat pump (ASHP) is a renewable and energy-efficient device in the sector of sanitary hot water production, the SAHP system can provide stable, continuous heating for buildings even the efficiency of solar collectors is reduced due to the unstable sunshine hours and seasonal fluctuations (Tangwe, Simon, and Meyer Citation2016; Morrison, Anderson, and Behnia Citation2004; Cansino et al. Citation2011). Typical SAHP systems can be divided into three categories based on their structure: series system, parallel system, and complex system (Day and Karayiannis Citation1994). Precious study, evaluated the performance and correlation of different integrated systems using solar thermal and heat pumps (Hadorn Citation2012; Stark, Loose, and Drück Citation2014). The results showed that 70% of SAHP systems were parallel systems, 7% were series systems, and 21% were complex systems. In general, the solar thermal system and the ASHP system operate as a unit in the series system (Hatheway and Converse Citation1981). Nuntaphan, Chansena, and Kiatsiriroat (Citation2009) proved that the coefficient of performance (COP) of a typical series system in Thailand was between 2.5 and 5.0. Moreover, Li and Yang (Citation2010) investigated the application of series SAHP systems in Hong Kong and found that the COP of the system was decreased over the heating process. In contrast to series system, the solar collector system and ASHP system operated independently in the parallel system (Kuang, Wang, and Yu Citation2003). Panaras, Mathioulakis, and Belessiotis (Citation2013) found that the parallel SAHP system for space heating had a monthly energy-savings ratio of approximately 52% and the ASHP unit has a dead-band temperature of −7°C. Huan et al. (Citation2019) evaluated the performance of different SAHP systems in the bathroom of colleges in Xi’An and test result showed that the parallel system outperformed the serial system. Similarly, Du et al. (Citation2019) speculated that the average COP of a parallel system was 2.77 in China’s Shandong, by building a model in TRNSYS, which was higher than that of the series system. Ahmad et al. (Citation2013) pointed out that designing a reasonable control center management parallel system could maintain better thermal comfort and less temperature fluctuations, and would save more than 9% of energy.
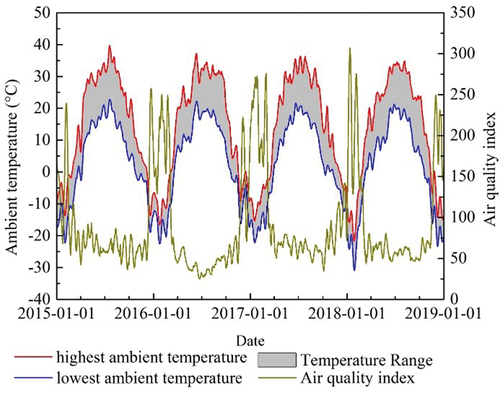
The annual solar total radiation in Xinjiang is about 5500 MJ·m−2, and the annual sunshine duration is over 3200 hours (Ke and Fanneng Citation2010). So the SAHP systems have great potential to be used in the heating of rural buildings in Xinjiang. The heating season generally lasted from October to April, in Shihezi city of Xinjiang (Khodakarami and Ghobadi Citation2016). However, the air quality index (AQI) in the heating season was higher than that of other seasons (See ), and the AQI increased significantly with a decrease in the ambient temperature. Previous studies showed that solar energy could be used as a clean power source to reduce the impacts of air pollutants, but the efficiency of solar energy was affected by the levels of air pollution.
Figure 1. Ambient temperature and air quality fluctuations with time in Shihezi in recent four years. All data are summarized from China national meteorological information center.
So far, numerous studies on SAHP have been carried out in cold regions. However, few researches focus on SAHP in severe cold region due to the low heat collection efficiency caused by low outdoor temperature, large heating load, and long heating period. Therefore, the time-controlled operation mode for SAHP was proposed in severe cold region. And the time-controlled operation mode consisted of work time mode and leave time mode. The system composition, operation characteristics, system benefits and other factors of the SAHP were analyzed. The relation between environment parameters and operation parameters was investigated and discussed. Furthermore, the performance of the time-controlled SAHP system was evaluated by comparing with the conventional coal-fired heating system.
2. Experiments
2.1. System design
The proposed SAHP heating system in this study was driven by solar and air source and designed for small public buildings in Xinjiang. As shown in , the fully integrated system consisted of solar collectors, an ASHP system, a water storage tank, a control center and three water pumps. In addition, radiant floor heating (RFH) system was installed in the test room.
Figure 2. Schematic layout of the experimental set-up for the SAHP system. Supply fluids was painted red and flow back fluids was painted blue.
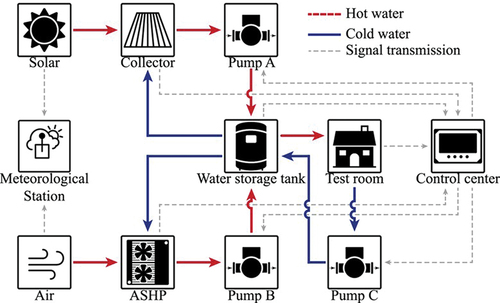
Three water pumps without relying on solenoid valves were designed for the system in rural areas, and each device was controlled by the temperature change of each measuring point. The heating period was divided into two periods depending on the ambient temperature and the levels of air pollution. The first period was a slightly cold period (SCP) (Xue et al. Citation2017), and the ambient temperature was above −5°C in October, November, March, and April. The second period was a bitter cold period (BCP), and the ambient temperature was below −5°C in December, January, and February.
2.2. Experimental equipment
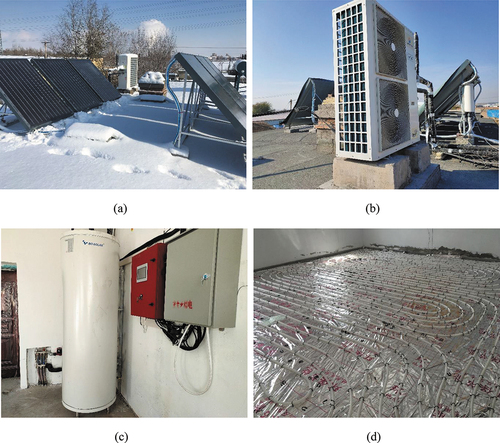
As shown in ), six flat-plate collectors with a total area of 12.72 m2 were installed on the roof of the test house. The weight of the ASHP ()) was 145 kg and the rated electric power was 4.2 kW. A water storage tank with the volume of 500 L was used ()). Considering that the outdoor temperature was often lower than 0°C during the experiment, 70% mass ethylene glycol anti-icing agent was used in the outdoor pipeline of the system, and the indoor pipeline was filled with demineralized water. The heat transfer between the anti-icing fluid and the demineralized water was obtained by a small copper tube of more than 40 m in the water storage tank. The experimental RFH system, with double spiral tubing, was made of three groups of ground heating pipes with the outer diameter of 20 mm, using polypropylene fixed to the office floor, as shown in ). The interval distance between the ground heating pipes was 150 mm and the total length was approximately 285 m.
Figure 3. The main composition of SAHP system. (a) Solar collectors. (b) ASHP system. (c) The water storage tank (d) RFH system.
2.3. The test house
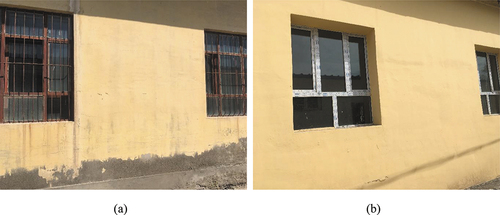
As shown in , the SAHP system was tested in a small isolated, and single office with an area of 54.66 m2 in Shihezi city of Xinjiang (44°24ʹN,86°00ʹE). The building refurbishment project completed before the installation of the SAHP system, as shown in . The south and west walls of the experimental room were the external facades consisting of the original 370 mm brickwork and an additional 120 mm expanded Polystyrene (EPS) insulation. The heat transfer coefficient (U-value) of the external walls was 0.302 W·m−2·K−1. The north and east walls connected to other adjacent rooms were the internal walls. The U-value of the internal walls, including the original 240 mm brickwork and an additional 120 mm EPS insulation, were 0.319 W·m−2·K−1. In addition, on the basis of the original 130 mm concrete roof, 100 mm extruded polystyrene (XPS) insulation and 200 mm concrete were added. The final U-value of the roof was 0.235 W·m−2·K−1. The windows were converted into double glazed windows with a U-value of 2.82 W·m−2·K−1.
Figure 4. Details of the experimental room.
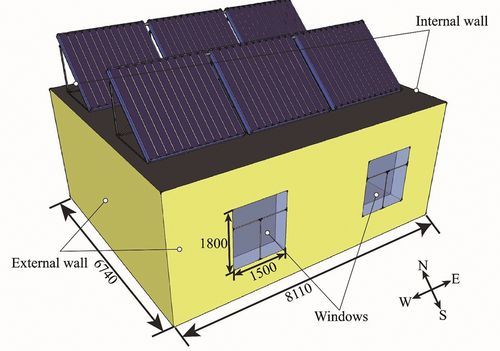
Figure 5. Photo of the experimental office room. (a) Pre-renovation test building in August 2018. (b) Testing building after renovation in April 2019.
2.4. The control center and measuring system
presents the control logic diagram of the control center. The control center allowed users to select manual or automatic mode through the touch screen according to their heating requirements. In this study, the time-controlled operating mode was divided into two parts, work time and leave time. During the work time (from 7:00 to 19:30), the primary goal of the SAHP system was to ensure that indoor temperature was around 18°C by using solar energy preferentially. Additionally, indoor temperature was controlled between 16°C and 20°C by the RFH system. When the solar collectors’ temperature was higher than 35°C and the water storage tank temperature, the solar system started to heating. Then, the collectors stopped working until the temperature met the conditions. When the water storage tank temperature was lower than 30°C, the ASHP was turned on until the temperature of the water storage tank reached 40°C. During the leave time (from 19:30 to 7:00), the system needed to prevent the ground heating tube from freezing, and keep the equipment operating normally when the indoor temperature was below 14°C.
Figure 6. Control logic diagram of control center. Control program was written by GX-Works2 software. USB/485 Converter was used to connect computers and read secure digital memory cards.
Figure 7. Indoor instrument arrangement.
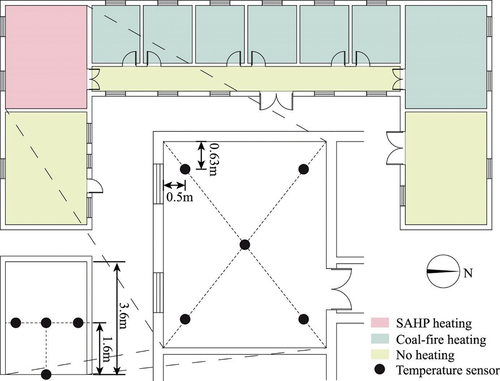
Table 1. Test instruments and parameter accuracy.
3. Results
3.1. Operating characteristics of the solar collectors
The fluctuations of the ambient temperature and the indoor temperature are shown in , as well as the inlet and outlet temperature of the solar collectors during SCP and BCP periods.
Figure 8. Operating variations of the solar collectors from SCP and BCP. (a) Temperature on October 25th, 2018 of SCP. (b) Temperature on December 7th, 2018 of BCP. (c) Solar power on October 25th, 2018 of SCP. (d) Solar power on December 7th, 2018 of BCP.
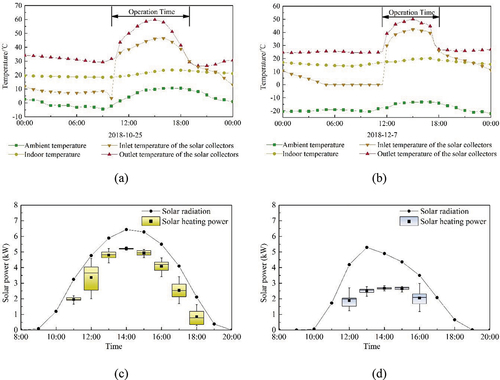
) shows the operation of solar collectors in the SCP on October 25th, 2018. Specifically, the solar radiation recorded by the Vantage Pro2 weather station was 11.32 MJ m−2 on that day. The ambient average temperature was about 3.11°C. During the operation of the solar collectors (from 11:00 to 18:30), the temperature increased rapidly from 11:30 to 15:00. Meanwhile, the heat collection efficiency reached the peak at 13:30 with an instantaneous solar heating rate of 5.22 kW ()). The RFH system, which worked from 9:30 to 19:00, increased the indoor temperature by 5.2°C using the solar energy as the only heat source. During the test, the total heat gains of the solar collectors reached 98.08 MJ, the heat collection efficiency of the solar collectors maintained at a high level of 68.12%, and the solar fraction of the day reached 84.22%. Furthermore, in sunny weather with sufficient solar radiation, the requirement of warm water for indoor RFH system was ensured by the solar collectors from the beginning to the end of heating. The excess heat was stored in the water storage tank to meet the heating needs of the next day.
) reveals that the operation of solar collectors in the BCP is an example on December 7th, 2018. The total solar radiation was 7.58 MJ·m−2 on that day and the ambient average temperature was around −18.08°C. The low ambient temperature caused the solar collector to collect heat only between 12:30 and 15:30. As shown in ), the solar collector had relatively low heat collection capacity, and the average heating rate hovered around 2.56 kW. When the indoor floor heating worked from 8:00 to 19:00, the running heat by solar collectors was not enough for warming the test office room. On that day, the total heat gain of solar collectors was 38.41 MJ, the collection efficiency of solar collectors maintained at 39.85%, and the solar fraction was only 27.31%. In the BCP period, the efficiency of solar collectors dramatically reduced due to the low solar radiation and the extremely low outdoor ambient temperature. In this case, the heat needed for indoor heating was supplemented by the ASHP system.
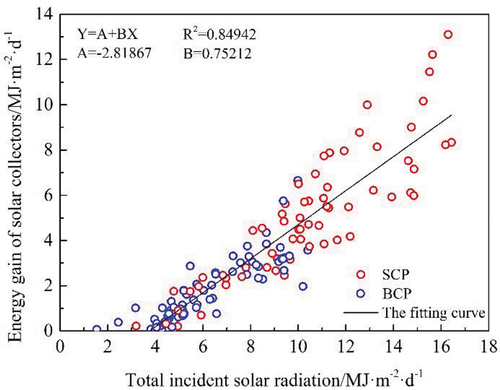
The different performance of solar collectors in SCP and BCP was mainly caused by the change of environmental parameters. In steady-state, the performance of a solar collector was described by an energy balance and the useful energy gain was an important parameter reflecting energy balance (Duffie, Beckman, and Worek Citation1994). Typically, the average energy gain per unit per day of solar collectors is given as:
where is the average energy gain (MJ·m−2·d−1),
is the collection efficiency of solar collectors (%) and
is the total incident solar radiation (MJ·m−2·d−1).
According to the EquationEquation (1)(1)
(1) , 145 valid sample data were analyzed to study the relationship between
and
. As shown in , there was a highly linear relationship between the incident solar radiation and the energy gain of solar collectors when the area of solar collectors was a constant (Hussain, Dincer, and Zubair Citation2004). So the average energy gain is shown in EquationEquation (2)
(2)
(2) :
Figure 9. Energy gain of solar collectors with the change of horizontal radiation
3.2. Operating characteristics of the ASHP system
The typical rainy weather during SCP and BCP was selected for analysis of the ASHP system. Taking November 12th, 2018 during SCP as an example, the ambient average temperature of the day was 0.69°C, as shown ). In addition, the heating capacity was 131.91 MJ and the power consumption was 17.0 kW·h ()). In fact, the actual power consumption of the ASHP system was lower than that of the rated electric power. Furthermore, the calculated average daily COP was 2.15. The average temperature difference was 8.1°C for between supply water and return water during the operation, with 7.5 h running time. The heating power of the ASHP system decreased with the increasing running time, while the power consumption was relatively stable. It was also observed that the COP of the ASHP system decreased over the running time.
Figure 10. Operating variations of the ASHP system from SCP and BCP. (a) Temperature on November 12th, 2018 of SCP. (b) Temperature on December 13th, 2018 of BCP. (c) Power on November 12th, 2018 of SCP. (d) Power on December 13th, 2018 of BCP.
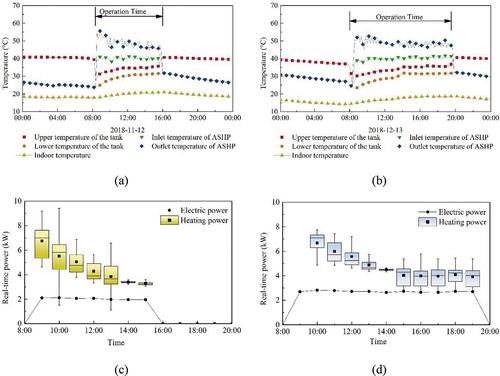
In contrast, ) summaries the operating characteristics of the ASHP system on December 13th, 2018 during the BCP. The average ambient temperature of the day was −15.07°C. Moreover, ) shows that the heat load was 189.32 MJ, the power consumption was 32.2 kW·h, and the average daily COP was 1.63. The average temperature difference was 8.2°C between the supply water and return water of the ASHP system during the operation, which was similar to the operating performance in the SCP. The running time of the system was 11.5 h, which was larger than that in the SCP. This was mainly due to the decrease of ambient temperature that led to the increase of heat consumption of building envelope and longer running time of the ASHP system.
A mathematical model was established to describe the operation of the ASHP, as shown in . Briefly, heat was pumped from the air source at lower temperature to the water at higher temperature through the vapor compression cycle during the operation of the ASHP system (Ahmad et al. Citation2013). And, COP is generally associated with ambient temperature and the temperature of the water storage tank (Rahman, Smith, and Fumo Citation2016; Karsli Citation2007). The temperature of the water storage tank was very stable; however, the tank temperature changed sharply when the water was used by the RFH system at the beginning of the working hours (Banister et al., Citation2014). Therefore, the COP of the ASHP system was determined by ambient temperature (Lloyd and Kerr Citation2008). According to the data collected during the heating period, a linear relationship between the COP and the ambient temperature was obtained with the temperature ranging from −25°C to 15°C, the linear regression equation was given as
Figure 11. COP of the ASHP system with the change of ambient temperature
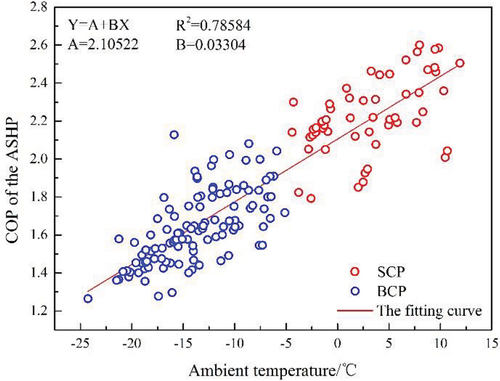
where is the coefficient of performance of ASHP and
is the ambient temperature (°C).
3.3. Impact of energy consumption of the experimental office room
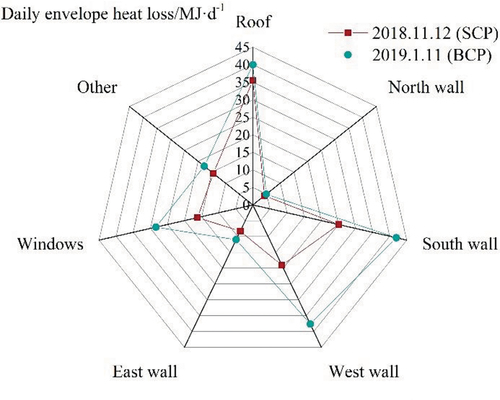
In order to compare the daily envelope heat loss of the experimental office during the SCP and BCP, a heat flux meter was used to test the indoor heat dissipation. And a typical day from each period was selected as shown in . For the roof, the thermal losses were not increased because of thermal insulation and the snow. Compared with SCP, the thermal losses of the south wall, the west wall, and the window in BCP increased by 67.4%, 97.4%, and 75%, respectively. Compared with the external walls, the thermal losses of internal walls were less affected by ambient temperature, such as the north wall and east wall. The heat consumptions of buildings from the SCP to the BCP was affected by the temperature change those parts of the buildings that were in direct contact with the surrounding environment. Therefore, the ambient temperature was the key factor in building heat consumption (Lei, Tan, and Wang Citation2017).
Figure 12. Heat consumption data in experimental room of November 12th, 2018 and January 11th, 2019.
The sensible energy demand of the zine was measured by the Ultrasonic heat meter. According to the collected data, a linear correlation between the sensible energy demand of the zine and the ambient temperature was obtained, as shown in . The linear regression equation is given as:
Figure 13. Sensible energy demands of zone with the change of ambient temperature
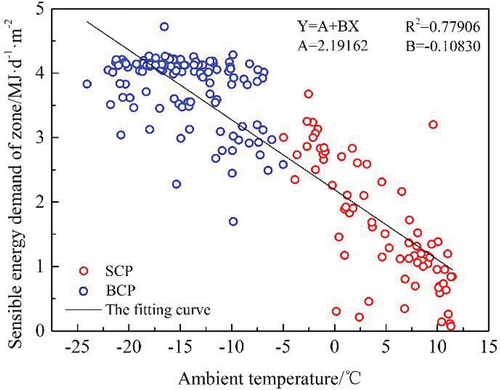
where is the sensible energy demand of zone.
3.4. Contrast with the local traditional coal-fired heating
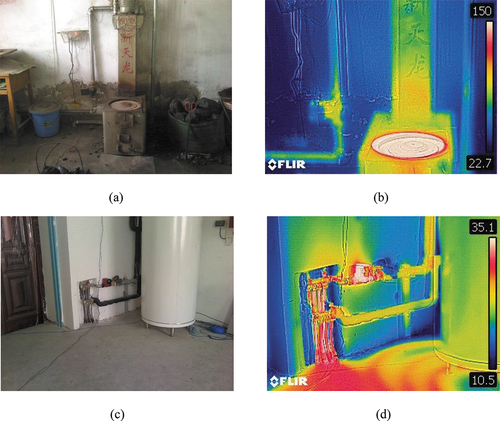
In order to verify the feasibility of using the SAHP system to replace local traditional coal-fired boilers in local building heating, a series of data were collected for analysis, such as indoor temperature, relative humidity, and energy consumption. The experiment was conducted during the normal working hours of the office building. As shown in ), traditional coal-fired boilers needed manual addition of coal stored in a separate room hourly. And the large amount of coal dust caused serious pollution to the surrounding environment. Through thermal imaging, the heat distribution of the SAHP system in the vertical direction ()) was more uniform than the coal-fired heating system ()).
Figure 14. Photos and thermal imaging of different systems. (a) Photo of the room with coal-fire heating boiler. (b) Thermal imaging of the room with coal-fire heating boiler. (c) Photo of the room with the SAHP system. (d) Thermal imaging of the room with the SAHP system.
) depicts the change of indoor temperature and relative humidity in test room heated by a coal-fired boiler. The indoor average temperature was 16.8°C, while the highest temperature was 25.5°C and the lowest temperature was only 9.5°C. The extremely high heating and cooling rates of this coal-fired boiler directly affected the indoor air temperature and it had very limited effect on the thermal storage of building envelope, so the indoor temperature difference as high as 9.7°C. In contrast, the variation range of indoor relative humidity was small, with fluctuation between 20% and 44% and an average humidity of 32.2%. The frequency of indoor relative humidity fluctuation, was relatively high, and the indoor relative humidity was low because the heat source was dry when the coal was burned for heating.
Figure 15. Indoor temperature and relative humidity in test room. (a) Heating by a coal-fired boiler. (b) Heating by the SAHP system.
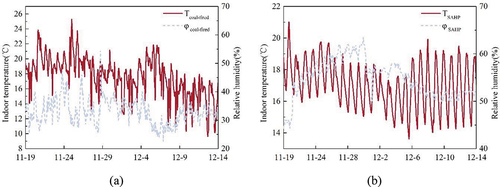
When the SAHP system was used for the heating, as shown in ), the average indoor temperature was 18.0°C with the temperature peaked at around 18:00 and the lowest temperature occurred around 8:00. The RFH system, controlled by the automatic control system, heated the building’s envelope firstly, and then increased the indoor air temperature. Therefore, the indoor temperature was relatively stable. The highest temperature was 20.8°C, the lowest temperature was 13.8°C, and the highest difference in temperature was 7°C. Considering the working hours of office buildings, the indoor temperature difference during working hours should be lower than that in the whole day. In addition, the indoor average humidity was 50.5%. The highest and lowest values of humidity were 56% and 43%, respectively, it indicated the humidity fluctuation was mild. In the second half of the test period, the relative humidity fluctuated with temperature, and the minimum humidity usually occurred at the highest indoor temperature.
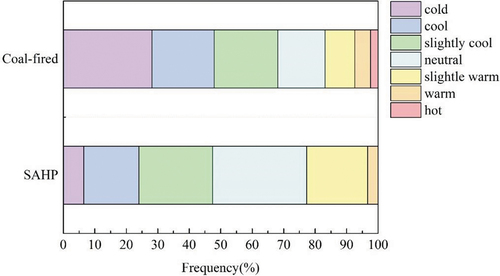
presents the schematic diagram of human thermal sensation based on predicted mean vote (PMV) model (Wang et al. Citation2010, Citation2018b). The model described people’s voting on the thermal sensation scale and the prediction of the percentage of dissatisfaction with heat by incorporating a few parameters including metabolic rate, clothing insulation, air temperature, radiant temperature, airspeed, and humidity (Enescu Citation2017). A total of 4363 valid sample data were collected in working hours during the heating period in the test rooms, and analyzed under metabolic rate of 1.2 met and a clothing thermal resistance of 1.0 clo. The average PMV of the test room heated by a coal-fired boiler was −1.6 and the corresponding thermal sensation was from cold to cool (see ). In contrast, the average PMV of the test room heated by the SAHP system was −0.5 and the corresponding thermal sensation was between slightly cool and neutral, and it followed the Poisson distribution. The PMV of the SAHP-heated room was affected by the auto start and stop of the control center, and the thermal comfort of the room was better.
Figure 16. Schematic diagram of human thermal sensation
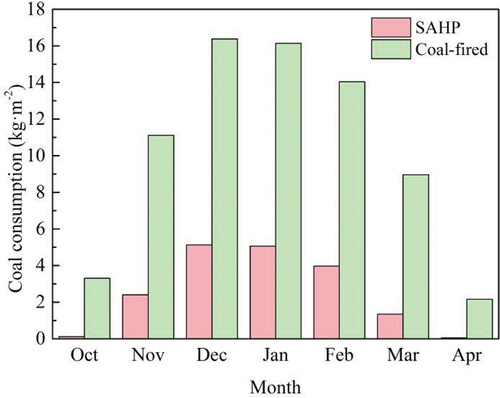
The traditional coal-fired boilers were selected as the benchmark when the energy-saving benefits of SAHP was evaluated. The energy consumption of the heat-engine plants in this region was at 292 g·(kW·h)−1 (Li et al. Citation2016b), and it could be converted into coal consumption according to calculations. The coal consumption of the test room was calculated based on the building energy consumption. The lower heating value of standard coal was 29,307 kJ·kgce−1, and the efficiency of traditional residential coal-fired boilers was 25% (Huang et al. Citation2017). The SAHP system mainly consumed electric energy. shows the consumption of coal-fired system and SAHP system. It can be seen that the coal consumption of the SAHP system was much lower than that of the coal-fired boiler during the SCP, and it was equivalent to 10.8% of the coal consumption of coal-fired system. During the BCP, ASHP undertook the entire heating demand for test room, and the power consumption increased with the decrease of the ambient temperature. The coal consumption of the SAHP system was equivalent to 29.2% of that using the coal-fired boiler. Throughout the heating period, the heating coal consumption index of the rest room actually reduced to 18.34 kg/m2, saving 55.02 kg of coal per unit area. The SAHP system in one heating period reduced CO2 emissions by 149.10 kg/m2, NOX emissions by 4.47 kg/m2, SO2 emissions by 2.24 kg/m2, and reducing air pollution caused by burning in winter.
Figure 17. Consumption of standard coal with different months.
3.5. Financial analysis
Compared with traditional coal-fired heating, the time-controlled SAHP system proposed in this paper had a benefit of CNY 2 546. After the system was installed, no additional investment was required except for routine maintenance. In addition, the traditional heating and SAHP systems were evaluated by calculating the net present value (NPV). NPV was defined as the difference between the present value of cash inflows and the present value of cash outflows (Baptista, Melo, and Rolim Citation2014). A detailed description of NPV was proposed by Ma et al. (Citation2016). The specific cost of a typical system for rural building was CNY 12000 and the specific cost of RFH was CNY 50 m−2. In addition, the construction cost of traditional coal-fired system was CNY 4 000. The electricity cost and Coal cost of the region were CNY 0.39 (kW·h)−1 and CNY 0.7 kg−1, respectively. The financial analysis and the SAHP system were summed (see ).
Table 2. Financial data the SAHP system.
Meanwhile, a comparison of SAHP heating system and traditional coal-fired boiler heating was gained (see ). It can be seen that the use of SAHP system for heating improved the thermal comfort of the room, reduced coal consumption, and thereby reduced polluting gas emissions. In addition, the payback period of the system investment is 8.1 years. In summary, the SAHP system had great feasibility to replace traditional coal-fired boilers.
Table 3. Comparison of SAHP heating and traditional coal-fired boiler heating.
4. Discussion
4.1. SAHP application in severe cold area
The COP of the SAHP system was lower than the photovoltaic air source heat pump (PV/T-ASHP) system (Wang et al. Citation2020, Citation2018a). Therefore, SAHP systems were more popular in rural areas due to its economic considerations (Li et al. Citation2019). Meanwhile, several simulation studies were carried out to investigate the system performance of the cryogenic environment, and the result provided reference for long-term operation of outdoor systems (Qiu, Xu, and Cai Citation2018; Panagiotidou, Aye, and Rismanchi Citation2019). And our result indicated that the heating efficiency of the time-controlled SAHP system reduced firstly and then stabilized during SCP or BCP. The heating efficiency fluctuation of the ASHP was often neglected in long-term operation under bitterly cold conditions.
However, the obstacle to application of time-controlled SAHP system was the low cost of traditional coal-fired boilers. But the indoor air pollution was obvious. To reduce air pollution from traditional coal-fired boilers, it was reasonable for us to believe that the time-controlled SAHP could be an optional way to improve the living conditions of residents
4.2. Impacts of season change on the system
In this study, we determined the operating parameters of the time-controlled SAHP system and the parameters impacts on the overall system energy consumption. Particularly, test result showed that the environmental parameters were closely related to the operating parameters of the system, and it could be used to predict the energy consumption of similar systems (Li and Kao Citation2017). For the solar part, the days of high solar radiation in SCP significantly outnumbered the BCP, which was consistent with the trend of ambient temperature change. Therefore, the solar collector could provide most of the room heating during SCP, but the solar collector could not meet the heating demand during BCP. The COP of the ASHP system was highly correlated with ambient temperature (R = 0.786), and it was greatly affected by seasonal changes (Lu et al. Citation2010; Mehla and Yadav Citation2018). The linear model was also consistent with the experimental data this time-controlled SAHP system, demonstrating great potential for future applications.
4.3. Future developments
There were some limitations in this study. Firstly, only environmental temperature was considered when studying the influence of environmental factors on COP of ASHP system. Therefore, the regression equation obtained could not be used for accurate prediction and design, although there was a high correlation between climate parameters and COP of the ASHP system. Secondly, the enclosure of the experimental room had been renovated to satisfy the requirements of China’s Design Standard (GB 50189-2015), however, it still faced high heat consumption costs because of the bitter cold climates (China MoHaU-RCotPsRo Citation2015). Finally, the solar fraction was also far lower than the predicted value in BCP. Therefore, when ambient temperature decreased, higher heat consumption cost was required to obtain an indoor temperature of 18°C in BCP. And it led to a decrease of COP for the ASHP system.
It is expected that the pre-stored energy technologies can be adopted to reduce the burden of the ASHP system in BCP; therefore, future work should focus on reducing the cost of the system and developing new solar seasonal heat storage technologies suitable for cold regions.
5. Conclusions
The time-controlled SAHP system was investigated in an office building in the cold and dry climate of Xinjiang to assess its ability and stability. The main conclusions of this paper are summarized below:
Solar collectors have undertaken 80% of the consumption for the heating room during SCP (October, November, March, and April). And the total heat collection of solar collectors could reach 98.08 MJ in one day. The heat collection efficiency of the collectors could reach 68.12%, and the solar energy utilization rate could reach 84.22%. Meanwhile, the indoor temperature increased by 5.2°C relying on solar collectors.
The ASHP system provided more than 70% of heating consumption for the building heating during BCP (December, January, and February). And the total heat collection of solar collectors was 38.41 MJ in one day. The heat collection efficiency of the collectors was 39.85%, and the solar energy utilization rate was 27.31%. At this time, the heating needed to be supplemented by ASHP system, because the solar collector did not meet the heating demand.
The building energy consumption increased and the COP of the system decreases with the decrease of ambient temperature. Therefore, it took longer time for the room to warm up. The daily power consumption of ASHP system was 32.2 kWh during BCP, and it was about twice of that during SCP. The average daily COP of ASHP during BCP was 75.81% of that during SBP. In addition, through the analysis of ASHP system, the linear regression equation between ASHP system performance coefficient and ambient temperature was obtained, which provided calculation reference for predicting ASHP system electricity consumption.
The SAHP system provided steadily higher indoor thermal comfort index compared with the traditional coal-fired boiler. In comfort, the indoor temperature fluctuated between 14°C and 20.2°C, and the average temperature was 18°C. In environmental protection, the coal consumption reduced to 18.34 kg/m2 using the SAHP system, and it was 75.0% lower than that of traditional coal-fired boiler heating. Meanwhile, CO2, NO2, and SO2 emissions were reduced by 149.10 kg/m2, 4.47 kg/m2, and 2.42 kg/m2, respectively. In economy, the payback period of SAHP was 8.1 years, and the traditional coal-fired boilers could be replaced by the SAHP.
Disclosure statement
No potential conflict of interest was reported by the author(s).
Correction Statement
This article has been republished with minor changes. These changes do not impact the academic content of the article.
Additional information
Funding
Notes on contributors
Jie Li
Jie Li, Associate professor. Mainly engaged in research on green buildings and building energy efficiency.
Mingkang Wang
Mingkang Wang, Mainly engaged in research on renewable energy and building energy conservation.
Xin Xu
Xin Xu, Research fields: Architectural thermal engineering
References
- Ahmad, M. W., M. Eftekhari, T. Steffen, and A. M. Danjuma. 2013. “Investigating the Performance of a Combined Solar System with Heat Pump for Houses.” Energy and Buildings 63: 138–146. doi:10.1016/j.enbuild.2013.03.055.
- Banister, C. J., W. R. Wagar, and M. R. Collins. 2014. “Validation of a Single Tank, Multi-mode Solar-Assisted Heat Pump TRNSYS Model.” Energy Procedia 48: 499–504. doi:10.1016/j.egypro.2014.02.059.
- Baptista, P., S. Melo, and C. Rolim. 2014. “Energy, Environmental and Mobility Impacts of Car-Sharing Systems. Empirical Results from Lisbon, Portugal.” Procedia-Social and Behavioral Sciences 111: 28–37. doi:10.1016/j.sbspro.2014.01.035.
- Cansino, J. M., M. D. P. Pablo-Romero, R. Román, and R. Yñiguez. 2011. “Promoting Renewable Energy Sources for Heating and Cooling in EU-27 Countries.” Energy Policy 39 (6): 3803–3812. doi:10.1016/j.enpol.2011.04.010.
- Chen, Y., G. Shen, Y. Huang, Y. Zhang, Y. Han, R. Wang, H. Shen, et al. 2016. “Household Air Pollution and Personal Exposure Risk of Polycyclic Aromatic Hydrocarbons among Rural Residents in Shanxi, China.” Indoor Air 26 (2): 246–258. doi:10.1111/ina.12204.
- Chen, Y., H. Shen, K. R. Smith, D. Guan, Y. Chen, G. Shen, J. Liu. 2018. “Estimating Household Air Pollution Exposures and Health Impacts from Space Heating in Rural China”. Environment International 119: 117–124. doi:10.1016/j.envint.2018.04.054.
- China MoHaU-RCotPsRo. 2015. “Design Standard for Energy Efficiency of Public Buildings.” GB50189-2015. Beijing: Standardization Administration of China (SAC).
- Day, A., and T. Karayiannis. 1994. “Solar-assisted Heat Pump Research and Development.” Building Services Engineering Research and Technology 15 (2): 71–80. doi:10.1177/014362449401500201.
- Du, H., X. Zhou, L. He, D. Zhao, S. Wang, N. Liu, and P. Cui, eds. 2019. “Performance Analysis of Solar and Air Source Heat Pump Hybrid Heating Systems Applied in Shandong Rural Area.” In IOP Conference Series: Earth and Environmental Science. IOP Publishing doi:10.1088/1755-1315/238/1/012075.
- Duffie, J. A., W. A. Beckman, and W. Worek. 1994. Solar Engineering of Thermal Processes. American Society of Mechanical Engineers Digital Collection.
- Enescu, D. 2017. “A Review of Thermal Comfort Models and Indicators for Indoor Environments.” Renewable and Sustainable Energy Reviews 79: 1353–1379. doi:10.1016/j.rser.2017.05.175.
- Hadorn, J. -C. 2012. “IEA Solar and Heat Pump Systems Solar Heating and Cooling Task 44 & Heat Pump Programme Annex 38.” Energy Procedia 30: 125–133. doi:10.1016/j.egypro.2012.11.016.
- Hatheway, F. M., and A. O. Converse. 1981. “Economic Comparison of Solar-assisted Heat Pumps.” Solar Energy 27 (6): 561–569. doi:10.1016/0038-092X(81)90052-9.
- Heidari, M., A. Dutta, B. Acharya, and S. Mahmud. 2018. “A Review of the Current Knowledge and Challenges of Hydrothermal Carbonization for Biomass Conversion.” Journal of the Energy Institute.
- Huan, C., F. Wang, S. Li, Y. Zhao, L. Liu, Z. Wang, C. Ji. 2019. “A Performance Comparison of Serial and Parallel Solar‐assisted Heat Pump Heating Systems in Xi’an, China”. Energy Science and Engineering 7: 1379–1393. doi:10.1002/ese3.357.
- Huang, L., G. Liu, C. Yan, and P. Xu, eds. 2017. “Study on the Evolution of Building Energy Conservation Standards in China.” In Proceedings of the 20th International Symposium on Advancement of Construction Management and Real Estate (6) . Springer doi:10.1016/j.joei.2018.12.003.
- Hussain, M., I. Dincer, and S. Zubair. 2004. “A Feasibility Study of Using Thermal Energy Storage in a Conventional Air‐conditioning System.” International Journal of Energy Research 28 (11): 955–967. doi:10.1002/er.1006.
- Johansson, T. B., H. Kelly, A. K. Reddy, and R. H. Williams. 1993. Renewable Energy: Sources for Fuels and Electricity. Washington, DC: Island Press.
- Karsli, S. 2007. “Performance Analysis of New-design Solar Air Collectors for Drying Applications.” Renewable Energy 32 (10): 1645–1660. doi:10.1016/j.renene.2006.08.005.
- Ke, L., and H. Fanneng. 2010. “Analysis on Mainland China’s Solar Energy Distribution and Potential to Utilize Solar Energy as an Alternative Energy Source.” Progress in Geography 29 (9): 1049–1054.
- Khodakarami, J., and P. Ghobadi. 2016. “Urban Pollution and Solar Radiation Impacts.” Renewable and Sustainable Energy Reviews 57: 965–976. doi:10.1016/j.rser.2015.12.166.
- Kuang, Y., R. Wang, and L. Yu. 2003. “Experimental Study on Solar Assisted Heat Pump System for Heat Supply.” Energy Conversion and Management 44 (7): 1089–1098. doi:10.1016/S0196-8904(02)00110-3.
- Lei, Y., H. Tan, and L. Wang, eds. 2017. “Post-evaluation of a Ground Source Heat Pump System for Residential Space Heating in Shanghai China.” In IOP Conference Series: Earth and Environmental Science (1) . IOP Publishing doi:10.1088/1755-1315/93/1/012053.
- Li, H., and H. Yang. 2010. “Study on Performance of Solar Assisted Air Source Heat Pump Systems for Hot Water Production in Hong Kong.” Applied Energy 87 (9): 2818–2825. doi:10.1016/j.apenergy.2009.06.023.
- Li, T., S. Cao, D. Fan, Y. Zhang, B. Wang, X. Zhao, B. P. Leaderer, et al. 2016a. “Household Concentrations and Personal Exposure of PM2. 5 Among Urban Residents Using Different Cooking Fuels”. Science of the Total Environment 548: 6–12. doi:10.1016/j.scitotenv.2016.01.038.
- Li, X., A. Lin, C. -H. Young, Y. Dai, and C. -H. Wang. 2019. “Energetic and Economic Evaluation of Hybrid Solar Energy Systems in a Residential Net-zero Energy Building.” Applied Energy 254: 113709. doi:10.1016/j.apenergy.2019.113709.
- Li, X., N. Wang, Y. Zhang, and Y. Yang, eds. 2016b. “Performance Analyze of Ultra-low Emission of Thermal Power Generation Based on Multi-objective Optimization.” In ASME 2016 Power Conference Collocated with the ASME 2016 10th International Conference on Energy Sustainability and the ASME 2016 14th International Conference on Fuel Cell Science, Engineering and Technology. American Society of Mechanical Engineers Digital Collection.
- Li, Y. -H., and W. -C. Kao. 2017. “Performance Analysis and Economic Assessment of Solar Thermal and Heat Pump Combisystems for Subtropical and Tropical Region.” Solar Energy 153: 301–316. doi:10.1016/j.solener.2017.05.067.
- Lloyd, C., and A. Kerr. 2008. “Performance of Commercially Available Solar and Heat Pump Water Heaters.” Energy Policy 36 (10): 3807–3813. doi:10.1016/j.enpol.2008.07.009.
- Lu J., Y. Fan, J. Song, H. Tang, and C. Yu. 2010. “Application of Hydroturbine Pump in Water Source Heat Pump Drainage Gravitational Potential Energy Recovery System.” Indoor Built Environment 19 (5): 546–554. doi:10.1177/1420326X10378808.
- Ma, H., C. Li, W. Lu, Z. Zhang, S. Yu, and N. Du. 2016. “Experimental Study of a Multi-energy Complementary Heating System Based on a Solar-groundwater Heat Pump Unit.” Applied Thermal Engineering 109: 718–726. doi:10.1016/j.applthermaleng.2016.08.136.
- Mehla, N., and A. Yadav. 2018. “Thermal Analysis on Charging and Discharging Behaviour of a Phase Change Material-based Evacuated Tube Solar Air Collector.” Indoor and Built Environment 27 (2): 156–172. doi:10.1177/1420326X16667626.
- Melikoglu, M. J. E. S. R. 2018. “Clean Coal Technologies: A Global to Local Review for Turkey.” Energy Strategy Reviews 22: 313–319. doi:10.1016/j.esr.2018.10.011.
- Morrison, G., T. Anderson, and M. Behnia. 2004. “Seasonal Performance Rating of Heat Pump Water Heaters.” Solar Energy 76 (1–3): 147–152. doi:10.1016/j.solener.2003.08.007.
- Ni, L., D. Qv, Y. Yao, F. Niu, and W. Hu. 2016. “An Experimental Study on Performance Enhancement of a PCM Based Solar-assisted Air Source Heat Pump System under Cooling Modes.” Applied Thermal Engineering 100: 434–452. doi:10.1016/j.applthermaleng.2016.02.001.
- Nuntaphan, A., C. Chansena, and T. Kiatsiriroat. 2009. “Performance Analysis of Solar Water Heater Combined with Heat Pump Using Refrigerant Mixture.” Applied Energy 86 (5): 748–756. doi:10.1016/j.apenergy.2008.05.014.
- Panagiotidou, M., L. Aye, and B. Rismanchi. 2019. “Solar Driven Water Heating Systems for Medium-rise Residential Buildings in Urban Mediterranean Areas.” Renewable Energy 147: 556–569. doi:10.1016/j.renene.2019.09.020.
- Panaras, G., E. Mathioulakis, and V. Belessiotis. 2013. “Investigation of the Performance of a Combined Solar Thermal Heat Pump Hot Water System.” Solar Energy 93: 169–182. doi:10.1016/j.solener.2013.03.027.
- Qiu, G., Z. Xu, and W. Cai. 2018. “A Novel Integrated Heating System of Solar Energy and Air Source Heat Pumps and Its Optimal Working Condition Range in Cold Regions.” Energy Conversion and Management 174: 922–931. doi:10.1016/j.enconman.2018.08.072.
- Rahman, A., A. D. Smith, and N. Fumo. 2016. “Performance Modeling and Parametric Study of a Stratified Water Thermal Storage Tank.” Applied Thermal Engineering 100: 668–679. doi:10.1016/j.applthermaleng.2016.01.163.
- Shi, G. -H., L. Aye, D. Li, and X. -J. Du. 2019. “Recent Advances in Direct Expansion Solar Assisted Heat Pump Systems: A Review.” Renewable and Sustainable Energy Reviews 109: 349–366. doi:10.1016/j.rser.2019.04.044.
- Stark, S., A. Loose, and H. Drück. 2014. “Field Test Results from Combined Solar Thermal and Air-source Heat Pump Systems with a Special Focus on Defrosting.” Energy Procedia 48: 654–663. doi:10.1016/j.egypro.2014.02.076.
- Tangwe, S. L., M. Simon, and E. L. Meyer. 2016. “Design of a Heat Pump Water Heater Performance Monitoring System: To Determine Performance of a Split Type System.” Journal of Engineering, Design and Technology 14 (4): 739–751. doi:10.1108/JEDT-08-2014-0055.
- Wang, G., Y. Zhao, Z. Quan, and J. Tong. 2018a. “Application of a Multi-function Solar-heat Pump System in Residential Buildings.” Applied Thermal Engineering 130: 922–937. doi:10.1016/j.applthermaleng.2017.10.046.
- Wang, X., L. Xia, C. Bales, X. Zhang, B. Copertaro, S. Pan, J. Wu. 2020. “A Systematic Review of Recent Air Source Heat Pump (ASHP) Systems Assisted by Solar Thermal, Photovoltaic and Photovoltaic/thermal Sources”. Renewable Energy 146: 2472–2487. doi:10.1016/j.renene.2019.08.096.
- Wang, Z., L. Zhang, J. Zhao, and Y. He. 2010. “Thermal Comfort for Naturally Ventilated Residential Buildings in Harbin.” Energy and Buildings 42 (12): 2406–2415. doi:10.1016/j.enbuild.2010.08.010.
- Wang, Z., Q. Xue, Y. Ji, and Z. Yu. 2018b. “Indoor Environment Quality in a Low-energy Residential Building in Winter in Harbin.” Building and Environment 135: 194–201. doi:10.1016/j.buildenv.2018.03.012.
- Xue, P., Z. Zhou, X. Fang, X. Chen, L. Liu, Y. Liu, J. Liu. 2017. “Fault Detection and Operation Optimization in District Heating Substations Based on Data Mining Techniques”. Applied Energy 205: 926–940. doi:10.1016/j.apenergy.2017.08.035.