
ABSTRACT
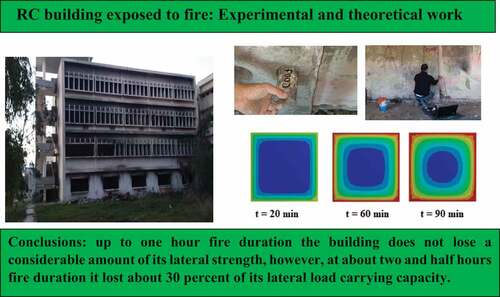
Fire damaged reinforced concrete buildings are often made usable by performing non-structural and cosmetic repairs. These types of repairs do not guarantee the safety of such buildings under the effect of future lateral loads, such as earthquakes. In this paper, an evaluation of the lateral load response of an RC fire damaged – building in Libya is presented. The building was used as a courtyard for the public and the fire visibly damaged some of its columns and beams. Material tests were conducted in situ and in the laboratory to evaluate the material strength of the building after the fire. Then, lateral load carrying capacity of the building before and after the fire was evaluated. Analysis results show that up to one-hour fire duration the building does not lose a considerable amount of its lateral strength; however, at about two and half hours fire duration, it lost about 30 percent of its lateral load carrying capacity. Lastly, analytically predicted residual strength material properties are in good agreement with material test results.
GRAPHICAL ABSTRACT
1. Introduction
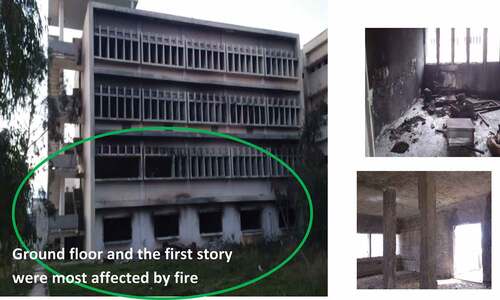
Buildings in urban regions need to be designed in a way that provides a “safe and sound” environment for the inhabitants, for the design life of the building. Whilst almost all codes guarantee safety under load combinations representing the extreme loading possibilities, pre and post earthquake fire loadings have not received adequate attention in the available codes. The occurrence of fire inside a reinforced concrete building is an unexpected phenomenon and can break out at any time due to various reasons. Although reinforced concrete is high fire resistance compared with other building materials, when exposed to fire, concrete degraded, and its strength decrease. Heat also causes the concrete to crack, which further degrades its stiffness. In general, the strength of concrete and reinforcement steel decrease with increase of heating temperature (Arioz Citation2007; Raut and Venkatesh Citation2012; Tao and Wang Citation2013). Restoration of fire-damaged reinforced concrete buildings is of great interest both for the owners and insurance company in terms of both reducing the capital cost and restarting the business due to earlier reoccupation of the buildings. Columns are the primary structural elements that transfer the loads of a building vertically to the foundation. Several studies and experimental works in the literatures show that when RC columns are exposed to fire, the material properties of concrete and the reinforcing steel change as a result of the temperature increases. The decreases in yield strength and modulus of elasticity reduce the overall strength of the column. A study on the Effect of fire on in-plane and out-of-plane behavior of reinforced concrete frames with and without masonry infills was conducted by P. Kumar, and G. Srivastava. They develop a finite element-based numerical model to compute the fire response of RC frames and infill-frames. It was found that the maximum degradation in in-plane stiffness of the frame with infill was about 17% lower than that of the frame without infill (Kumar and Srivastava Citation2018). Fire-damaged reinforced concrete buildings are often made usable by performing non-structural and cosmetic repairs without proper seismic evaluation and retrofitting. Prediction of lateral load-carrying capacity of a fire-damaged RC building is an important step in seismic performance evaluation of the building under future earthquakes effects. To investigate the effect of fire on a RC structure, modeling strategies typically have three components: the fire model, the heat transfer model, and the structural model (Kumar and Srivastava Citation2017). The fire model provides the temperature–time relationship of the fire to which a given structure is exposed to. Typically, the fire model is derived from one of the following: standard fire curves, realistic fire curves, and equivalent fire severity curves. In this study standard fire curve was used. The heat transfer model is utilized for the estimation of the thermal gradients or temperature profiles within the structural members corresponding to the given fire exposure. It is an essential component of the analysis, as the load-carrying capacity of the structural elements depends upon the internal temperatures. Researchers have developed empirical relations to facilitate quick estimation of temperatures within the structural members under certain conditions. One such method is the 500 isotherm method prescribed by the Euro code (EN Citation1992-1-2 2004). When greater accuracy is desired, FE software such as ANSYS Inc (2013), ABAQUS (2011), and OpenSees can be utilized. In this study ANSYS Inc software was used. The structural model is used to gauge the effect of a rise in internal temperature on the load-carrying capacity or strength of the structure. The temperature profile obtained from the heat transfer model along with applied loads and temperature-dependent material properties are given as input, and corresponding stresses and serviceability limit states are determined to evaluate the failure criteria. The residual load-carrying capacity computed from the structural model is compared with the required load capacity during the fire, to assess whether the design is safe and is performing satisfactorily. In this paper an evaluation of the seismic performance of a RC building subjected to pre-earthquake fire is presented. The building was used as a central court building of Al-Baida city in Libya. The fire occurred in the right wing of the ground floor of the building, and as reported by witnesses, it lasted approximately for an equivalent continuous time of 2–3 hours, involving a lot of paper documents, furniture, and other materials. More reliable information about temperatures was obtained during on-site surveys. All furniture, windows, doors, infrastructure are severely affected by fire. Most of the structural elements are grey to black in color. Examinations of rubble show all floor tiles are dismantled and burned, window glass is shattered but not melted. The electric wires are burned however the copper in electric wires had not been softened. These observations indicate that the temperature is in the range of 400 to 600°C (Fire Safety of Concrete Buildings Citation2010; Bernard, William, and William Citation1972). This is also assured by the grey to black color of the structural concrete elements surfaces. Concrete color provides a broad, general guide of temperatures (Yüzer, Akӧz, and Ӧzturk Citation2004). The fire caused readily visible surface damage, as shown in . According to fib bulletin 46, 2008 fire damage can be classified as Class 3 (FIB Task Group 4.3 Citation2008). Material tests were conducted in situ and in the laboratory to evaluate the material strength of the building after the fire. Furthermore, a finite element model was developed to evaluate the distribution of temperature within the cross-section of each structural member during a fire. Then the results were used to estimate the residual strength of each fire- damaged structural member in the building. For each different fire exposed time, the lateral load-carrying capacity of the building was predicted using nonlinear pushover analysis that takes into account the reduction in the strength of each fire-affected member. The seismic performance of the building before and after the fire was evaluated according to the Turkish earthquake code TERDC-2007 (Ministry of Publicworks and Settlement Citation2007). The following sections of this paper elaborate on the details of building description, material tests, heat transfer analysis, residual strength prediction, nonlinear pushover analysis, and seismic performance results.
Figure 1. General view of the building after the fire.
2. Architectural plans and structural system
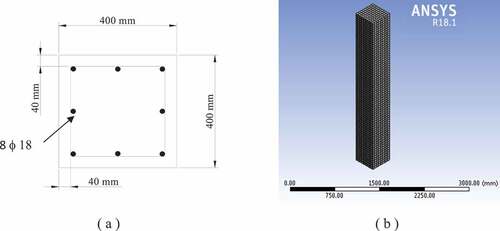
The building consists of a ground floor and upper three typical floors, built in the early 1970s; each story is 3 m clear height and 1460 m2 plan area. The structural framing is made of conventional cast in-situ reinforced concrete as it is shown in . The framing system consists of a grid of columns, mainly of a 40 cm square size, as shown . The columns are reinforced with 8 ϕ18 longitudinal mild steel plain bars and ϕ 8 lateral reinforcement spaced at 15 cm center to center. The maximum spacing between the columns is 6 m center to center in short direction and 4.5 m spacing in long direction. The slabs of the building floors are hollow block type with total thickness of 25 cm comprising (approximately) 5 cm topping and 20 cm thickness hollow block. The ribs are of 15 cm thickness and spaced at 55 cm center to center with 2 ϕ18 mm bars to resist negative and positive bending moments. The ribs are mainly constructed continuously in 3 spans 6 m, 2 m and 6 m long, respectively, except at entrance lobbies where it is 6 m long single spans. The main beams supporting the ribs are embedded beams with a 25 cm thickness and 10 mild steel plain bars combination of ϕ 18 and ϕ 20 top and bottom provided with ϕ 8 double stirrups spaced at 15 cm center to center. Conventional local type hollow block of 20 cm thickness is used for partitions.
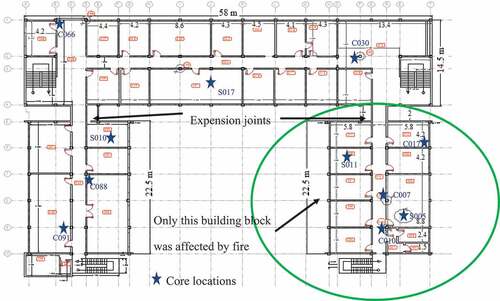
Figure 2. Plan view of the ground floor of the building’s blocks.
3. Material tests
Tests were conducted in situ and in the laboratory to determine concrete material properties. The nondestructive rebound hammer and pulse velocity tests were conducted in situ according to the recommendation given in ACI 228-R10 and ASTM C 805 (ACI Committee 228.1R-03 Citation1994). In the rebound hammer test, all affected structural members are divided into grids with designation numbers and labels, then the hammer test is performed, and the rebound number is recorded. An average of at least ten rebound readings are taken for one test, see ). In the pulse velocity test method, the estimation of the compressive strength of concrete is based on measuring the time it takes for a pulse of vibration energy to travel through a concrete member. The tests were performed according to ASTM C 597 standard (ASTM C597 Citation2009). Some test results are shown in and . Twenty core samples have been extracted from the different structural elements affected by the fire. Locations of the concrete core samples are established based on results of nondestructive tests and visual inspection of the structure. The strength of the concrete cores taken from the structural elements is determined in accordance with ASTM C 42 (ASTM C42/C42M Citation2004). For core length-to-diameter ratios different than 2.0, the appropriate strength correction factors given in ASTM C 42 were applied (ASTM C42/C42M Citation2004). Two types of concrete cores are extracted, full core length diameter 70 mm and smaller size of diameter 25 mm. The small size cores are used to depict the concrete strength along the structural member from the near-surface to fire and the far surface to estimate the extent of fire damage to the cross-section. The equivalent specified concrete strength is calculated according to ACI 562-12 (ACI Committee 562-12 Citation2012). Typical results are shown in . And rebound hammer test results on fire-exposed and non-fire exposed concrete elements are shown in . Test results show that the average compressive strength of fire unaffected concrete is about 17 MPa. However, the most fire-affected structural element (i.e. Column C007 of the ground floor) has an average compressive strength of 9.6 MPa. Furthermore, tests on core samples taken from different depths of a fire-affected column indicate that the concrete strength near the column surface is about 11.8 MPa, and at the center of the column’s cross-section is about 15.3 MPa.
Figure 3. Some photos during testing (a) core sampling, (b) ultrasonic test, (c) rebound hammer.
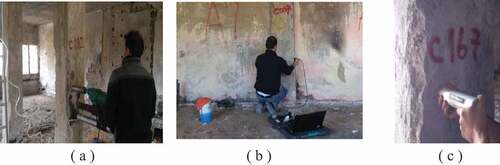
Table 1. Typical results of ultrasonic testing.
Table 2. Typical result of compressive strength testing.
Table 3. Rebound values versus core compressive strength values.
4. Thermal analysis and residual strength prediction
All the columns in the case study building have the same dimensions and steel reinforcement details as it is shown in ). During the fire, some of these columns were exposed to fire from four sides, and the rest were exposed to fire from three or two sides. The finite element analysis program ANSYS was used to carry out a 3-D transient thermal analysis on all the fire-affected columns and beams (CitationANSYS software). As an example, here only the finite element model of one of the building’s columns is presented. The concrete column was modeled using 8-node linear heat transfer brick elements as shown in ). Modeling of reinforcement bars is neglected, and it is assumed that the reinforcement bar temperature is equal to the surrounding concrete temperature. The developed FE model takes into account the nonlinear temperature dependent on concrete material properties, such as specific heat, and thermal conductivity. The variation of concrete thermal conductivity with temperature specified by EN 1992-1-2:Citation2004 code was used in the model (see ; CitationXTRACT software). The concrete density is assumed to be constant and equal to 2300 kg/m3. The analysis results of a column exposed to ISO834 standard fire curve from four sides are shown in .
Figure 4. (a) Column section details, (b) FE model.
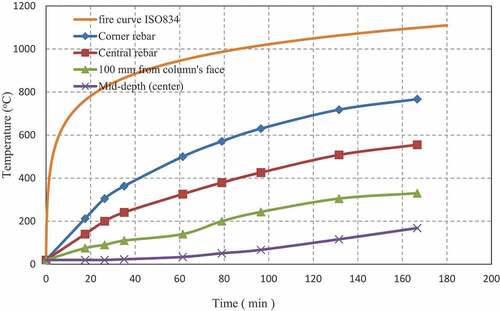
To illustrate the thermal predictions from the model, the temperature variation is plotted as a function of fire exposure time at various locations of the column cross-section in . The temperature at various depths of concrete, as well as in reinforcement bar locations, increases with fire exposure time. As expected, the predicted temperature decreases with increasing distance from the fire-exposed side.
Figure 5. Variation of concrete conductivity with temperature (EN 1992 standard).
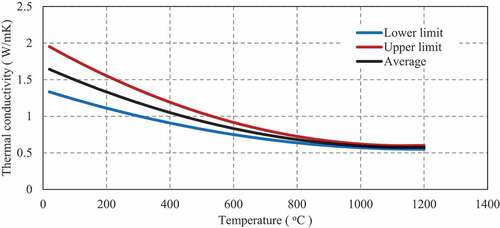
Figure 6. Temperature distribution.
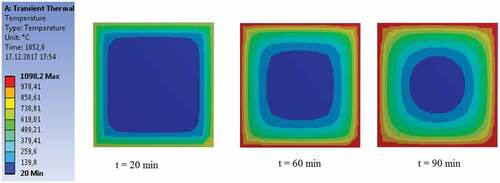
Figure 7. Temperature as a function of time at different locations of column cross section.
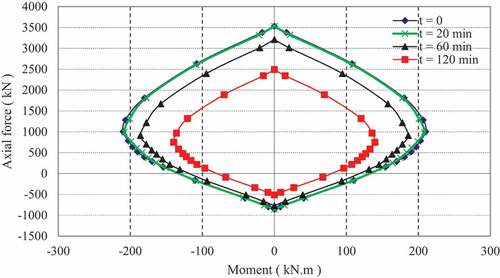
The cross-sectional temperatures generated from thermal analysis are used as input to the strength analysis (i.e. generation of moment–curvature relationship and axial force–moment interaction diagram). In the strength analysis, a finite element model was developed using XTRACT software as shown in ) (CitationXTRACT software). In the analysis, it is assumed that plane sections before bending remain plane after bending and there is no bond-slip between steel reinforcement and concrete. The fire unaffected concrete compressive strength of 17 MPa which is obtained from material tests was used as initial value. The initial value of reinforcement bars yield strength was taken to be equal to 420 MPa. As the fire duration increases, the temperature will increase inside the column cross-section, causing a reduction in the compressive strength of each concrete layer of the XTRACT model and also causing a reduction in the reinforcement bars stress–strain relationship. The reduction in the material properties of concrete and reinforcement steel due to elevated temperatures was taken into account using reduction factors proposed by the Eurocode (see ); EN Citation1992-1-2 2004). The proposed reduction factors are in good agreement with the experimental material test results. This can be shown from the results in and 8(b) as follows: it is shown from that at 120 min fire duration and at a depth of 100 mm from the face of the column, the concrete temperature was equal to 300°C; and at this temperature according to ), the reduction factor of concrete strength is about 0.8; that is the concrete strength becomes (17 × 0.8 = 13.8 MPa) and this value are in good agreement with the experimental results given in . The axial force-moment capacity diagrams for the column at various time durations were obtained and presented in . From the figures, it is clear that both the moment and axial load carrying capacities of the column decrease with increasing time of fire exposure. This is due to the deterioration in the material strength and stiffness as a result of increased temperatures in concrete and steel. Furthermore, the analysis results show that up to 60 min of fire duration the column does not lose a considerable amount of its strength, however at 120 min fire duration it will lose about 35 percent of its axial load and moment carrying capacities.
Figure 8. (a) XTRACT FE model, (b) Strength reduction factor according to Euro code (Kumar and Srivastava Citation2018).
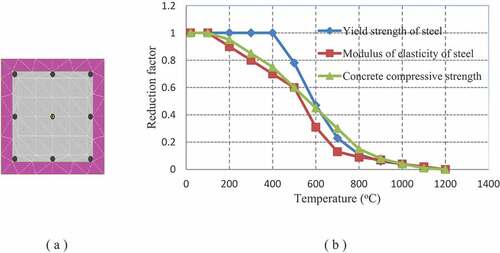
Figure 9. Axial force–moment interaction diagrams at various times for the RC column under fire exposure.
5. Earthquake hazard
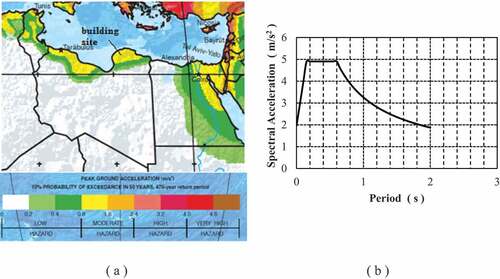
Soil boring and laboratory tests were conducted to determine the geotechnical soil properties at the building site. From these tests, the allowable bearing strength was 1.14 kg/cm2,and the soil type according to the Turkish Earthquake Resistant Design Code (TERDC-2007) was Z3. While no definitive probabilistic seismic hazard assessments (PSHAs) have been undertaken for Libya, several studies investigating the seismicity and the seismotectonic do exist. Early seismic zonation maps were presented by Mallick & Morghem and Kebeasy. More recent studies by Suleiman & Doser, Al-Heety & Eshwehdi and Al-Heety provide a more comprehensive account of the seismicity and seismotectonic and benefit from locally obtained strong-ground motion data from the Libyan Digital Seismological Network (LDSN) (Al-Heety and Eshwehdi Citation2006; Al-Heety Citation2013). According to these studies and the seismic map of the world shown in ), the maximum peak ground acceleration at the building site can be taken as 2 m/s2. And according to the Turkish earthquake code and the site soil conditions, a 5% damped elastic response spectrum was obtained and plotted in ).
Figure 10. Building site: (a) seismicity and, (b) design response spectrum.
6. Seismic performance evaluation
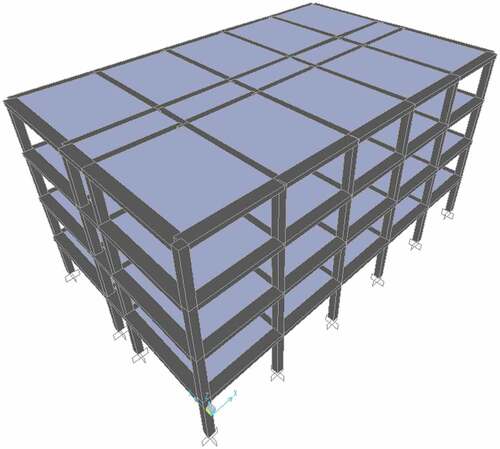
To predict analytically the seismic performance of the case study building before and after the fire, a finite element model was established using SAPCitation2000software. In the beginning, the structures were modeled without considering the fire effects, that is, the model represents the original state of the structure. Frame elements were used to model the beams, and columns and floor slabs were modeled by shell elements. Only the building block that affected by fire was modeled (i.e. the right-side block only, see ). The finite element model is shown in . The total weight of the structure is 13,254 kN. The fire unaffected concrete compressive strength and yield strength of the reinforcement steel used in the analysis were 17 MPa and 420 MPa, respectively. These values were obtained from destructive and non-destructive material test results. To include the reinforcement details of each structural element in the model, reinforcement numbers, diameters, and stirrup spacing for each structural member were measured using a reinforcement radar device. These measured values were compared to the existing data of the project drawing details. At the end of this long process, the reinforcement details of each beam and column were included in the model.
Figure 11. Finite element model of the building block.
The nonlinear static analysis procedure defined in the Turkish earthquake code TERDC-2007 was used to estimate the seismic performance of the building. This procedure is similar to the nonlinear static analyses procedure defined in FEMA356 standard. The procedure uses the philosophy of earthquake design based on performance, structural members are normally designed to satisfy various levels of performance, some of which are operational (O), immediate occupancy (IO), life safety (LS), and collapse prevention (CP). The procedure is based on a pushover analysis in which the inelastic variation of the base shear with respect to the top-story displacement (i.e. the pushover-curve) is obtained considering monotonic increments in the adaptive load patterns, such as the equivalent seismic loads or first mode shape. Then, the inelastic demand spectrum for the structure and the capacity spectrum, which is transformed from the pushover-curve, are compared, and inelastic demands are obtained from the intersection of the two curves. Based on the procedure of TERDC-2007, the capacity curve is established from the pushover curve by transforming the coordinates into modal displacement and modal acceleration (Ministry of Publicworks and Settlement Citation2007). The pushover curves of the fire unaffected building were obtained in X and Y directions. The X direction denotes the deformed shape of the building associated with its first vibration mode, and the Y direction denotes the deformed shape of the building associated with its second vibration mode.
Figure 12. Pushover curves before and during fire (a) X direction, (b) Y direction.
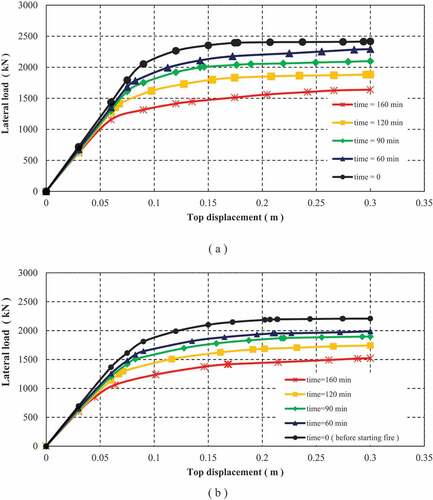
To predict analytically the lateral load response of the building during different fire durations, the residual strength of each column and beam in the structure was calculated using the procedure presented in Section 4. And for each fire duration the calculated residual strengths were used to modify the finite element model of the building, and a pushover analysis was performed. The pushover curves for the building at different fire durations were obtained in the X and Y directions. Analysis results before the fire and at different fire durations are shown in .
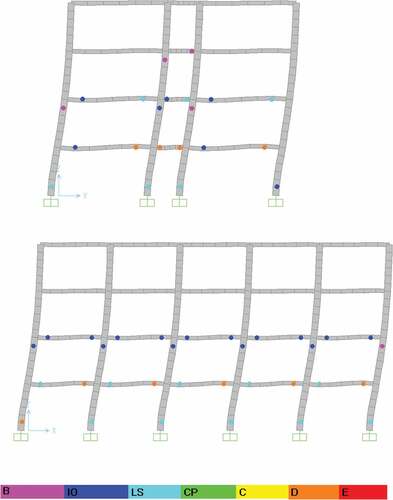
The seismic performance point of the building before and after the fire (i.e. at about two and half hours fire duration) in the Y direction was obtained using the TERDC-2007 code procedure and presented in . At the performance point, the top displacement of the building before and afterthe fire was about 0.105 m and 0.13 m, respectively. To evaluate the plastic hinge rotations in the structural elements, plastic rotation limits defined by FEMA356 were used. For immediate occupancy (IO), life safety (LS), and collapse prevention (CP) the plastic rotation limits are 0.003, 0.012, and 0.015 rad, respectively (FEMA356 Citation2000). Analysis results show that before the fire, most of the columns and beams rotations lie below the life safety (LS) limit state, while after the fire, some columns and beams form plastic hinges that exceed life safety (LS) and collapse prevention (CP) limit states as it is shown in . Furthermore, modal analysis results show that pre-fire vibration periods of the first, second and third modes are 1.04, 1.028, and 0.92 sec, respectively. And after the fire, the vibration periods of the first, second and third modes are 1.29, 1.27, and 1.15 sec, respectively.
Figure 13. Performance point of the building before and after fire.
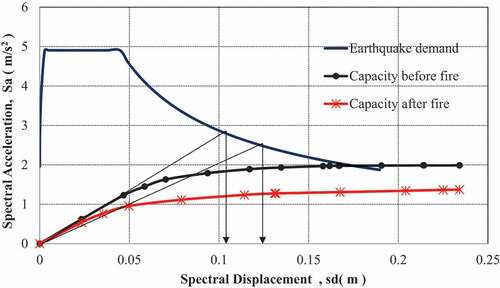
Figure 14. Columns and beams rotations before fire.
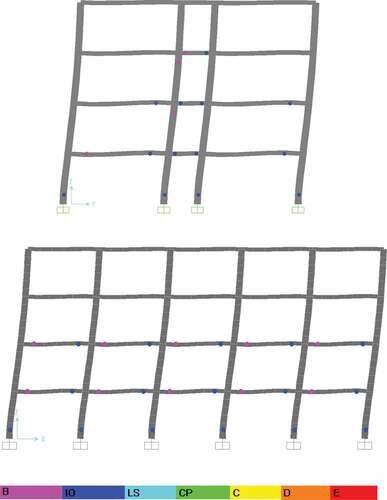
Figure 15. Columns and beams rotations after fire.
7. Conclusions
Based on the experimental and analytical results of this study, the following conclusions can be drawn:
The lateral load-carrying capacity of the case study building decreases with increasing fire-exposed time. Analysis results show that up to one-hour fire duration the building does not lose a considerable amount of its lateral strength, however at about two and half hour fire duration it will lose about 30 percent of its lateral load-carrying capacity. According to these results, it can be said that: if the building was exposed to fire for more than one hour, cosmetic repairs may not be suitable, and the building should be investigated for possible strengthening.
The seismic performance of the building before the fire was acceptable because at the performance point all beams and columns rotations were at the immediate occupancy (IO) limit state.
According to material test results, thermal analysis results and witnesses report it is expected that the building was exposed to fire for up to 2.5 hours. Furthermore, analysis results on the fire-affected building that exposed to fire up to 2.5 hours show that the rotations of some columns and beams exceeded life safety (LS) and collapse prevention (CP) limit states. And this will form plastic hinges and the building needs to be strengthened.
Based on transient thermal analysis results shown in , it is clear that the reinforcement bars at the column corners are more affected by fire than the central reinforcement bars.
At 120 min fire duration and at a depth of 100 mm from the face of the column, the concrete temperature was equal to 300°C; and according to Euro code this will reduce the concrete strength by about 20%; that is the concrete strength becomes (17 × 0.8 = 13.8 MPa) and this value is in good agreement with the experimental test results given in .
At 120-min fire duration, the average temperature of the reinforcement bars is about 550°C and according to Euro code this will reduce the strength and elastic modulus of steel by about 32% and 40%, respectively.
Pre- and post-earthquake fire loadings have not received adequate attention in the available codes. In future, more studies need to be conducted in order to obtain code formulation that estimates the residual lateral load carrying capacities of fire affected RC buildings.
Acknowledgments
I would like to express my appreciation to Dr. Gary Chambers for his efforts in improving the grammar and the English of the text.
Disclosure statement
No potential conflict of interest was reported by the author(s).
Additional information
Notes on contributors
Vail Karakale
Vail Karakale is a professor of civil engineering at Istanbul Medeniyet University. He gets his PhD degree from ITU in 2001. He worked in several institutions such as Boğaziçi University, Marmara University, Anadolu University, and Istanbul University. His research interests focus on seismic strengthening and restoration of structures, cold formed steel structures, reinforced concrete design, and seismic isolation of structures.
Ramadan E. Suleiman
Ramadan E Suleiman is a professor of civil engineering at University in Benghazi. His research interests focus on repair and strengthening of reinforced concrete structures, composite slabs, and cold formed steel.
Fathi M. Layas
Fathi M. Layas is an emeritus professor of civil engineering at University in Benghazi. He gets his PhD from North Carolina state university in 1982. His area of special interest is stochastic analysis of buildings under random excitation, predicting dynamic response of structures under earthquake loads, and rehabilitation of structures subjected to blast loading.
References
- ACI Committee 228.1R-03. 1994. In-Place Methods to Estimate Concrete Strength. Farmington Hills, MI: American Concrete Institute.
- ACI Committee 562-12. 2012. Code Requirements for Evaluation, Repair, and Rehabilitation of Concrete Buildings and Commentary. Farmington Hills, MI: American Concrete Institute.
- Al-Heety, E. 2013. “Seismicity and Seismotectonics of Libya: As an Example of Intraplate Environment.” Arabian Journal of Geosciences 6 (1): 193–204. May 24. doi:10.1007/s12517-011-0347-y.
- Al-Heety, E., and A. Eshwehdi. 2006. “Seismicity of the Northwestern Region of Libya: An Example of Continental Seismicity.” Seismological Research Letters 77: 691–696. doi:10.1785/gssrl.77.6.691.
- “ANSYS Software.” Southpointe 275 Technology Drive Canonsburg, PA 15317.
- Arioz, O. 2007. “Effects of Elevated Temperatures on Properties of Concrete.” Fire Safety Journal 42: 516–522. doi:10.1016/j.firesaf.2007.01.003.
- ASTM C42/C42M. 2004. Standard Test Method for Obtaining and Testing Drilled Cores and Sawed Beams of Concrete. West Conshohocken, PA: American Society for Testing and Materials.
- ASTM C597. 2009. Standard Test Method for Pulse Velocity through Concrete. West Conshohocken, PA: American Society for Testing and Materials.
- Bernard, E., G. H. William, and H. K. William. 1972. “Evaluating Fire Damage to Concrete Structures” Part II of a Three-Part Series on Repair of Fire Damage. Aberdeen Group.
- EN 1992-1-2. 2004. Eurocode 2: Design of Concrete Structures- Part 1–2: General Rules- Structural Fire Design. Brussels: European Committee for Standardization.
- FEMA356. 2000. Prestandard and Commentary for the Seismic Rehabilitation of Buildings. Washington, DC: Federal Emergency Management Agency. November.
- FIB Task Group 4.3. 2008. “Fire Design of Concrete Structures - Structural Behaviour and Assessment.” FIB Bulletin 46: 63–114.
- “Fire Safety of Concrete Buildings.” 2010. Cement Concrete & Aggregate. Australia.
- Kumar, P., and G. Srivastava. 2017. “Numerical Modeling of Structural Frames with Infills Subjected to Thermal Exposure: State-of-the-Art Review.” Journal of Structural Fire Engineering 8 (3): 218–237. doi:10.1108/JSFE-05-2017-0031.
- Kumar, P., and G. Srivastava. 2018. “Effect of Fire on In-Plane and Out-of-Plane Behavior of Reinforced Concrete Frames with and without Masonry Infills.” Construction and Building Materials 167: 82–95. doi:10.1016/j.conbuildmat.2018.01.116.
- Ministry of Publicworks and Settlement. 2007. Turkish Earthquake Resistant Design Code — TEDRC. Ankara, Turkey.
- Raut, N., and K. Venkatesh. 2012. “Behavior of Circular Reinforced Concrete Columns under Fire Conditions.” Journal of Structural Fire Engineering 3 (1): 37–55. doi:10.1260/2040-2317.3.1.37.
- “SAP2000 Software.” Berkeley, CA: Computers and Structures, Inc.
- Tao, Z., and X. Wang. 2013. “Stress-strain Curves of Structural and Reinforcing Steels after Exposure to Elevated Temperatures.” Journal of Materials in Civil Engineering 25 (9): 1306–1316. doi:10.1061/(ASCE)MT.1943-5533.0000676.
- “XTRACT Software.” USA: Imbsen and Associates.
- Yüzer, N., F. Akӧz, and L. D. Ӧzturk. 2004. “Compressive Strength-Color Change Relation in Mortars at High Temperature.” Cement and Concrete Research 34 (10): 1803–1807. October. doi:10.1016/j.cemconres.2004.01.015.