
 ?Mathematical formulae have been encoded as MathML and are displayed in this HTML version using MathJax in order to improve their display. Uncheck the box to turn MathJax off. This feature requires Javascript. Click on a formula to zoom.
ABSTRACT
Building sustainability has become a major objective in architecture due to buildings’ significant contribution to the environment degradation. Like many other nations, South Korea has inaugurated the Green Standard for Energy and Environmental Design (G–SEED) to address the issue of environmental loads caused by energy inefficient buildings. Due to the additional construction cost needed to obtain G–SEED certification, building stakeholders face challenges in deciding whether to invest in green building certification. In this study, we evaluate the existence and magnitude of the G–SEED price premium in Seoul, one of most densely populated cities in South Korea. We applied the hedonic pricing model to an extensive dataset of all housing transactions made during 2018 in all 25 districts of Seoul. Our findings indicate that the average price premium for a G–SEED certified apartment is 24.3%, with the premium being 18.3%, 31.0%, and 54.6% for small, medium, and large apartment complexes, respectively. We conclude that although the additional cost required to meet G–SEED certification criteria increases with the size of the development; green investment is profitable at all scales considered in this study.
1. Introduction
Since the early 1990s, the concept of sustainable development has influenced various aspects of development and fueled a significant increase of market demand for sustainable goods and services (Gibbs, Longhurst, and Braithwaite Citation1996). The growing awareness of the importance of environmental protection is reflected in customer willingness to pay premiums for sustainable products over ordinary products. In response, industries in different business sectors have taken eco–friendly concepts into consideration in goods and service production and marketing (Berry and Rondinelli Citation1998), with a concurrent global expansion of the market for so-called “green” or “ sustainable” products.
Given the enormous environmental loads incurred during both the construction and operation phases of buildings; the role of sustainability in architecture requires an even more enforcement which lead to the development of building environmental assessment systems in different parts of the world. Like many other countries, South Korea inaugurated its first building environmental assessment system in a local context in 2000, with the aim being to harmonize the benefits of economic development and environmental protection. In South Korea, buildings are responsible for about 40% of the country’s total energy consumption, 50% of the total emitted carbon dioxide, and 20% to 50% of the total waste (Kim and Jeong Citation2018). Based on these values, it is evident that one of the most efficient ways to promote environmental conservation is through sustainable architecture designed for energy and resource conservation, greenhouse gas reduction, and high–quality built environments
Besides the energy benefits of sustainable buildings, the desirable criteria for housing are shifting from availability and functionality to quality of life in terms of livability. “Green building” has become both a blueprint for sustainable development for nations and a marketing strategy for project developers and investors. Like other eco-friendly products, the promotion of green building can only be successful if its advantages are substantial for both residents and investors. Due to the incremental costs required to acquire green certification (Kim and Kim Citation2018), developers and investors are often hesitant to make this investment without certainty as to whether the green building premium is large enough to offset the cost involved. Although many investigations of the price premium associated with green certified buildings have been conducted in various cities and nations, the spatial dependence of their findings makes the prediction of green premiums in a specified local context difficult. In addition, for a city with a highly dynamic housing market such as Seoul, potential stakeholders would be more encouraged to invest in green building only if there is enough information about existing profit associated with certified buildings compared to non–certified buildings.
Despite comprising only 10% of the total country’s size, Seoul hosts almost 50% of the country’s population, making it one of the most highly populated cities. Unlike in other developed countries, the percentage of owner–occupancy in Seoul is very low (below 50%), indicating that most of the constructed buildings are developed for investment purposes due to constant high housing demand (Hwang and Suh Citation2021). In addition, while housing price growth has been stagnant in other part of the country, it is more dynamic and highest in Seoul. In view of the special characteristics of housing market in Seoul, in this study we evaluate the benefits of investing in sustainable development in the area, focusing on apartment complexes as more than 60% of Koreans live in apartments.
Here, we present a comprehensive investigation of the price premiums associated with the green certification system in South Korea for apartment complexes in Seoul based on a data set that represents the current housing market in the capital area. Furthermore, considering the increased incremental costs for larger projects compared to small ones, in this study we investigate actual differences in green price premiums for different development sizes. Our findings can serve as decision support for stakeholders deciding whether to invest in green building. In addition, they provide insight for government officials deciding where to add incentives, if needed, for green building to be equally encouraged at all project scales.
2. Green building certification in South Korea
The start of the green building evaluation system in Korea dates back to 2000, when the Ministry of Land, Infrastructure and Transport (MOLIT) together with the Ministry of Environment (MOE) developed the Green Building Certification System (GBCS). Originally, GBCS was a voluntary scheme for new buildings with only two certification levels: Green 1 and Green 2. Given that the majority of the Korean population lives in apartment complexes and that this housing type alone is responsible for about 27.9% of total residential energy consumption, GBCS for Multi–Family Housing (GBCS–MF) was initiated in 2002. A total of four credit categories were defined in 2005: (1) Land Use and Transportation, (2) Energy, Resources and Environmental Loads, (3) Ecology, and (4) Indoor Environment. Soon after, the system was changed from recommended to required in 2006. In its early stages, GBCS faced many challenges regarding its schemes of application and evaluation. To tackle these problems, the system underwent a second upgrading stage from 2008 to 2011, during which it changed from two to four certification levels: Green 1 (74%), Green 2 (66%), Green 3 (58%), and Green 4 (50%). In addition, GBCS–MF regulations and standards were integrated into the Housing Performance System Rating System in South Korea to enforce the role of green building in sustainable development (Lee and Shepley Citation2019).
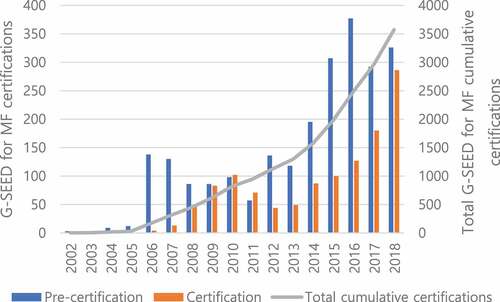
The primary objectives of a green building evaluation system are to enhance building quality while reducing environmental load, and to stimulate green building development through standardized recognition of improvements in building performance. To effectively achieve these goals, GBCS–MF was changed from four to seven credit categories in 2013 and the system’s name was changed to Green Standard Energy and Environmental Design (G–SEED). The G–SEED for MF was most recently revised in 2016 with a rating system including nine categories: (1) Land Use and Transportation, (2) Energy and Pollution, (3) Material and Resources, (4) Water, (5) Maintenance, (6) Ecology, (7) Indoor Environment, (8) Housing Performance, and (9) Innovative Design. The Innovative Design criteria were added to evaluate Green 1 and Green 2 graded buildings only. Through this continuous revision of its green evaluation system, the Korean government has succeeded in promoting sustainable building with a total of 10,000 buildings being green certified between 2002 and 2018. outlines G–SEED for MF certification status since the system’s inauguration. Notably, the total amount of green multifamily housing (commonly known as apartment complex) increased by up to 70% from 2013, reaching a total number of 3,571 G–SEED certified apartment complexes in 2018 and indicating the rising awareness of green building among building developers and investors in South Korea (Korea Environmental Industry Technology Institute Citation2021). However, there have not been investigations regarding whether the surge in Korean green apartments is reflected in current apartment transactions, especially in Seoul, the South Korean city with the highest population and lowest owner–occupancy rate.
Figure 1. Certification status of G–SEED for MF (2002–2018).
Based on the certification status of G–SEED for MF and the spatial characteristics of highly dynamic housing markets, in this study we test two hypotheses. The first hypothesis is that green certified apartments in Seoul have higher premium prices compared to previous findings from cities (nations) with relatively stagnant housing markets and housing price growth. In contrast, our second hypothesis is grounded in previous findings by Fuerst and Shimizu (Fuerst and Shimizu Citation2016) that residents living in high quality housing and from wealthier population groups are willing to pay an even greater price premium for green buildings. Therefore, the hypothesis is that the green premium price of housing units in small–scale building developments is smaller than that of housing units in larger apartment complexes, which generally offer better housing life experience, connectivity to the outside (accessibility to public transport) world and within the complex (pedestrian walkway and bicycle roads), and many other features that are considered in the G–SEED evaluation criteria.
3. Discrepancy in building green price premiums: Literature review
Early investigations of green certification impacts on housing price/rental costs have mainly focused on global leaders in building environmental assessment systems such as Energy Star and LEED in the United States, BREEAM in the United Kingdom, and the Energy Performance Certificate (EPC) in Europe (Miller, Spivey, and Florance Citation2008; Eichholtz, Kok, and Quigley Citation2010, Citation2013; Pivo and Fisher Citation2009; Wiley, Benefield, and Johnson Citation2010; Reichardt et al. Citation2012; Chegut, Eichholtz, and Kok Citation2014; Kok and Jennen Citation2012). It was not until 2010 that the topic of price premiums for local green certification systems became a subject of interest and a significant research. Below is an overview of these studies and their findings in different geographical area
In the United States, most studies evaluated the price premiums associated with LEED and Energy Star, and their findings differed according to city and the system under consideration. In New York, Seattle, Chicago, and Portland Oregon, Couch et al. (Couch, Carswell, and Zahirovic-Herbert Citation2015) reported no significant impact of LEED certification on housing price, while Bond and Devine (Bond and Devine Citation2016) found an 8.9% price premium for LEED certified buildings. Bruegge et al. (Bruegge, Carrión-Flores, and Pope Citation2016) found that residential buildings certified by Energy Star sold at prices 1.2% – 4.9% higher than non-certified buildings in Florida but highlighted that this sale premium ceases over time. Walls et al. (Walls et al. Citation2017) compared the price premium of Energy Star and local green certifications in three U.S. metropolitan areas and found that local certifications in Austin and Portland, Texas had higher price premiums than Energy Star for both older and newer residential buildings. In addition, two different studies conducted by Kok and Kahn on green building certification and real estate prices in California found a price premium of 9% for housing certified by LEED, Energy Star or the local Green Point Rating program in 2012 (Kok and Kahn Citation2012), and a lower premium of 2.1% to 3.9% in 2014 (Kahn and Kok Citation2014).
In Europe, the majority of recent studies on green certification and the housing market mainly focus on the EPC which rates the energy performance of a building on a scale from A (very efficient) to G (inefficient). Brounen and Kok (Brounen and Kok Citation2011) reported a 3.7% price premium for a residential building certified with EPC and showed that an A–graded building typically sold at a price 10.2% higher than a D–graded comparable building in The Netherlands. In Ireland, an investigation (Hyland, Lyons, and Lyons Citation2013) of EPC and real estate found that A–rated housing was typically 9% and 2% more expensive in sales and rental price, respectively, compared to D–rated housing. On the other hand, the European Commission’s 2013 final report (European Commission Citation2021) revealed that a unit change in EPC rating incurred an increase in housing price of 2.8% in Ireland, 4.0% in France, and 8.0% in Greater Vienna. In England, the results of a study by Fuerst et al. (Fuerst et al. Citation2015) indicated that compared to D–rated housing, there was a 5.0% increase in price for A- and B-rated housing and a 1.8% increase for C-rated housing. In addition, the study reported that when defining a D-rated home as the base case, there is a 0.7%, 0.9%, and 6.0% price discount for E-, F-, and G-rated housing, respectively. The same authors conducted a similar study (Fuerst et al. Citation2016) in Wales and found that A- and B-rated housing had a 12.8% price premium, C-rated had a 3.5% premium, and E- and F-rated housing had discounts of 3.6% and 6.5%, respectively. Marcelo et al. (Cajias, Fuerst, and Bienert Citation2019) investigated the variation of price premiums over time in the metropolitan housing market in Germany and found that when the price premium of A–graded housing was analyzed separately for each year, the rental premium increased from 0% in 2013 to 1.4% in 2017.
Green building is still on the rise in Asia, where most countries are developing or upgrading their own green building rating schemes with the intention to turn them into international systems in the future. Studies of the economic benefits of green certification in this region mainly focus on evaluations of domestic rating systems. One of the earliest studies in Japan (Chihiro Citation2010) indicated that a green certified condominium in Tokyo would earn a 5% price premium. In addition, residents from wealthier social economic groups were willing to pay even higher price premiums for green buildings than other population groups (Fuerst and Shimizu Citation2016). On the other hand, however, Yoshida and Sugiura (Yoshida and Sugiura Citation2015) reported contradictory results indicating that the prices of green-certified condominiums were lower than comparable non-certified ones. Nonetheless, the authors highlighted that due to the high quality and durability of the certified buildings, their price depreciation on the market was lower than that of ordinary buildings. While most investigations of the impact of Singapore’s Green Mark certification on the housing market reached similar conclusions, that a green premium exists, the discrepancies in their findings are interesting. Addae–Dapaah and Chieh (Addae-Dapaah and Chieh Citation2011) identified a 9.61–27.74% green premium through sales data analysis and a premium of 5.47–6.82% when survey data were used. Similarly, Deng et al. (Deng, Li, and Quigley Citation2012) reported a 4–6% premium for green certified buildings. By contrast, a more recent study (Dell’Anna and Bottero Citation2021) found that the price premiums of Gold and Platinum rated buildings during an economic crisis were 20.7% and 65.6%, respectively.
Regarding the Korean green certification system, G-SEED, previous investigations have mainly involved the evaluation of practices and comparisons to international green building evaluation systems such as LEED and BREEAM (Kim and Kim Citation2018; Lee Citation2014; Yun, Cho, and Chae Citation2018). There are a handful of studies related to the cost of obtaining G–SEED certification (Kim, Shin, and Hur Citation2014; Lee and Kim Citation2019) and post-occupancy evaluations of green certified buildings (Kim and Kim Citation2020b). Studies related to resident perception and willingness to buy/rent a green certified building yielded encouraging findings that reflect the Korean government’s efforts in promoting sustainable development (Lee and Shepley Citation2018; Jang, Kim, and Kim Citation2018; Park et al. Citation2013). Nevertheless, studies that concretely determine how this public awareness is reflected in the current actual housing market are lacking. Kang and Yuh (Kang and Yuh Citation2014) analyzed the impact of G-SEED on apartment sales from 2004, when the Korean green building evaluation system was inaugurated, and reported a green premium of 23%. A more recent study (Kim et al. Citation2020) conducted in non-capital areas in Korea found a 9.52% green price premium through a one sample t–test. In view of G-SEED apartment certification progress, in this study we explore the effects of green certification on apartment sale price and price variation for different development scales by analyzing apartment transactions in 2018. We believe that the findings of this study will serve as an important reference for developers and all stakeholders in the special housing markets of densely populated cities such as Seoul.
4. Data sample and study methods
Seoul, the capital of South Korea, has steadily and rapidly increasing housing prices due to high population density. In addition, as one of the earliest developed cities in South Korea, Seoul has a mixture of new and old housing, an active housing market, a comprehensive public transportation, and a large number of G–SEED certified residential buildings. Therefore, Seoul was selected for in-depth exploration in this study.
We investigate the G–SEED price premium in Seoul based on housing transactions made during 2018 in all 25 districts of the city. Information about a total of 81,605 housing transactions covering all apartment complexes in Seoul was obtained using the housing transaction price system maintained by the Korean Ministry of Land, Infrastructure and Transport. For each of the transactions, we collected information regarding housing characteristics, neighborhood characteristics, and the green certification status of the apartment for which the transaction was made. As housing characteristics, we selected independent variables based on previous studies related to apartment pricing factors in the area. According to the literature (Kim et al. Citation2020), housing unit size, floor level, age of the apartment, and size of the complex (total housing units in the apartment complex) have great influence on housing price. Hence, these factors were examined in this study. In addition, we considered neighborhood factors that influence housing price in large cities like Seoul including access to subway stations, educational facilities (elementary or middle schools), supermarkets, and hospitals. It is important to note that despite the presence of comprehensive public bus transportation in Seoul, the subway is the preferred means of transport due to traffic congestion (Kang Citation2019), hence only subway stations were considered in this study. An apartment is considered to be accessible to facilities needed in everyday life such as subways, schools, and supermarkets if the facilities were within 5 minutes walking distance (Hui, Tse, and Yu Citation2017), defined as 500 meters from the apartment. Apartment information regarding the nearest subway stations, schools, and supermarkets was obtained from retch.or.kr, the largest real estate platform for apartments in Korea. Regarding hospitals, we considered only large facilities such as general and referral hospitals, and the accessibility distance was changed to 1 km from the apartment. A total of 15 general and referral hospitals in Seoul were considered, and apartments within 1 km from each hospital were identified using EarthExplorer–USGS (EarthExplorer Citation2021). In addition, a housing price index variable was added to the neighborhood characteristics. A study of housing prices in Seoul (Kim and Kim Citation2020a) revealed that apartment prices are significantly higher in the southeastern region than the northern and southwestern parts of the city. Therefore, all transactions including apartments located in the five highest housing price districts (i.e., the southeastern region), namely Gangnam–gu, Yongsan–gu, Seocho–gu, Seongdong–gu, and Songpa–gu, were assigned a value of 1 for the dummy variable of housing price index. The green certification status of each apartment in the data set was defined by referring to a list of G–SEED certified buildings obtained from the Korea Environmental Industry Technology Institute (Miller, Spivey, and Florance Citation2008).
Prior to empirical analysis, the data set was first cleaned by removing all transactions that lack complete information and transactions involving commercial–residential mixed apartment complexes, as they are likely to have different pricing from ordinary apartments. The cleaning process produced a dataset of 64,333 housing transactions. The hedonic price model was applied to these housing transactions to evaluate the price premium of G–SEED certification. This model is primarily based on the principle that the price of a product is a function of both its own features and external attributes (Rosen Citation1974). For the purpose of this study, the dependent variable for the hedonic model is the transaction price, while the explanatory variables are grouped into housing attributes, neighborhood attributes, and G–SEED certification attributes. Although there are various forms of hedonic models, the semi–log form was selected for this study for two reasons: 1) the semi–log form takes possible non–linear correlations between dependent variables and independent variables into account, and 2) the model minimizes the problem of heteroskedasticity in the regression (Sirmans, Macpherson, and Zietz Citation2005).
As previously explained, four variables are included in the housing attributes. The first variable is the housing floor area (AREA) and our hypothesis is that a bigger house will be transacted at a higher price than a smaller house (positive relationship between floor area and transaction price). The second variable is the floor level (FL) which is defined as a categorical variable with 5 categories (1st – 10th floor, 11th – 20th floor, 21st – 30th floor, 31st – 40th floor, and above 40th floor). The assumption underlying the FL variable is that housing on higher levels is more expensive than on lower levels due to the better view, less noise and pollution, and privacy. The age of the apartment (AGE) is another variable considered in the housing attributes. The age is calculated using the building construction year to the year of transaction, under the assumption that the price of a house decreases with the age (negative relationship between age and transaction price). The fourth variable included in the housing attributes is the total number of housing units (HU) in the apartment complex. Larger complexes are more likely to have better connectivity to facilities, better environments, and convenience compared to smaller apartments. Therefore, we assume a positive relationship between total housing units and transaction price in this study.
As for the neighborhood attributes, five variables are considered. The first variable is the housing price index (PI), a dummy variable that differentiates transactions in the five most expensive districts (“1”) from others (“0”). The second, third, and fourth variables are dummy variables defining whether the apartment for which the transaction was made is within 500 meters (5 min walking distance) from elementary or middle schools (SCH), supermarkets or shopping malls (SPK), and subway stations (SBW). The last variable among the neighborhood attributes is a dummy variable distinguishing apartments located within 1 km of a hospital (HOSP) and others.
Finally, the last variable and the main focus of this study is the G–SEED certification variable, which is a dummy variable representing transactions involving G–SEED certified apartments. This variable is given a value of “1” if the apartment is green certified and “0” otherwise. A description of the variables and their definitions is provided in .
Table 1. Description of the study variables and their expected relationships.
The hedonic model built based on the above variables takes the form below:
where, and ε represent the intercept and uncorrelated error term of the function, respectively, and
is the coefficient of the explanatory variables. The RStudio software is used to estimate the contributory values for each of the explanatory variables considered in this study. The following section describes the empirical findings and analysis.
5. Results and discussion
As previously discussed, the G–SEED price premium of apartment in Seoul was analyzed in two different scenarios. One scenario (hedonic model 1) depicts the case when the price premium is evaluated for all transactions, while the other scenario illustrates a situation where the green price premium is analyzed according to building development scale (i.e., the size of the apartment complex). Therefore, in addition to model 1 for scenario 1, three more models are developed to assess the green premium for small scale apartment complexes (fewer than 1,000 housing units), medium scale apartment complexes (1,000 to 2,000 housing units), and large apartment complexes (more than 2,000 housing units). As shown using the regression results in , all four models have high explanatory power, as their adjusted R-square values are all > 0.7, meaning that the models are able to explain more than 70% of the variation in the dataset.
Table 2. Results of the four hedonic pricing models.
Significances at the 5%, and 1% levels are indicated by **, and ***, respectively.
The results of the four hedonic models of this study, as illustrated in , indicate that all explanatory variables are statistically significant at a significance level of 1%, except for school accessibility in model 2, which is within the 5% significance level.
Among housing attributes, our findings show that the housing floor area (AREA) has the greatest influence on housing price in the real estate market. This aligns with our expectations, as the unit of the dependent variable is price (Korean currency: Won) rather than price per unit size (Won/m2); hence higher sale prices for larger housing units. Another of the most influential factors among housing attributes is the total number of housing units (HU). The price of a housing unit increases for big apartment complexes because larger complexes are mostly constructed by high–ranking construction companies and provide more amenities and services. The negative sign on the apartment age (AGE) coefficient indicates that the price of a housing unit decreases as the apartment age increases. For every one year increase in the apartment age, its housing transaction price is reduced by 0.2 to 0.8%. Note, however, that price depreciation for larger apartments is less than for small apartments. This may be due to the high quality and durability of housing units in large apartment complexes.
As for neighborhood attributes, the housing price index (PI) has a significantly greater influence on housing transaction price than the other four variables. This can be explained by the special characteristics of the housing market in the area. Seoul, being one of the most densely populated cities, exhibits apartment prices that vary greatly across its 25 districts. For example, in December 2013, the average apartment price in Gangnam–gu (most expensive district) was about 912.8 USD/m2 while for lower housing price districts in northern and southwestern Seoul the average was around 435.5 USD/m2 (Kang and Yuh Citation2014). Therefore, it is not surprising for the housing price index to show the highest influence on apartment transaction in Seoul. Accessibility to schools, supermarkets, subways, and hospitals follows similar trends for all four models and our findings align with our expectations. However, it is noteworthy to highlight that school accessibility, as important as it is, has the lowest impact on housing price. This may be because in all datasets for all four models, only a small percentage of transactions (5% to 12%) involve apartment complexes with no schools (elementary or middle) within 500 meters.
Lastly, the findings for all four models indicate that G–SEED certification is a significant (within 1% significance level) predictor explaining apartment housing prices in the dataset. The relationship between G–SEED certification and housing price is positive, which signifies that a housing unit in a G–SEED certified apartment complex is typically sold at a higher price than similar housing in a non–certified apartment. Nonetheless, the G–SEED price premium varies depending on the size of the apartment complex, as illustrated in . Generally, in Korea, apartment complexes are constructed using three different methods. The first case is that a construction company buys a site and develops an apartment complex on it, hence the company becomes both the developer and the constructor. Another method is that developers appoint a construction company to design and build an apartment complex. The last method is a case in which individual residents form an association and hire a developer and a contractor to build an apartment complex. For all three cases, cost plays the most important role in choosing construction materials/methods as well as the amenities and services to be provided to the residents of the complex. Similarly, if the cost of a given G–SEED evaluation criterion is deemed too expensive, the criterion is given less attention and investment. A previous study (Kim and Kim Citation2018) of the additional cost needed to acquire green building certification indicated that cost greatly differs for different apartment sizes. According to that study, additional construction costs of around 681.8 and 1,704.5 USD per housing unit was calculated for apartment complexes of 100 and 1000 housing units, respectively. This justifies our findings in , where the G–SEED premiums for housing in a small complex (less than 1000 housing units), medium complex (between 1000 and 2000 housing units), and large complex (above 2000 housing units) are about 18.3%, 31.0%, and 54.6%, respectively. The G–SEED price premium is around 24.3% when apartment size is not considered.
6. Conclusions
In this study, we evaluate the economic benefits of G–SEED certification for apartments in Seoul, one of the most densely populated cities in South Korea. A total of 64,333 housing transactions in 2018 were analyzed using the hedonic model and the price effects of G–SEED were assessed. Our findings show that G–SEED certification is a significant (within 1% significance level) predictor explaining variation in housing transaction prices in the dataset. According to our results, a housing unit in a G–SEED certified complex is transacted at 24.3% higher price than a similar housing unit in a non-certified complex. These findings are in line with those of a previous study on the impact of G–SEED on the real estate market in Seoul (Kang and Yuh Citation2014). Nevertheless, these findings hold only if apartment complex size is not considered and similar housing units are compared regardless of the apartment complex size.
Considering that the additional cost required to acquire green certification differs according to building development scale, in this study we analyzed G–SEED price premiums for three different apartment complex scales. For small apartment complexes, having less than 1000 housing units, the transaction price of a housing unit in a G–SEED certified complex is 18.3% higher than a similar housing unit in a non–certified complex. In apartment complexes with total housing units between 1000 and 2000 housing units, medium apartment complexes, the G–SEED price premium is about 31.0%. Lastly, for large apartment complexes, having more than 2000 housing units, a housing unit in a G–SEED certified complex is transacted at 54.6% higher price than a housing unit in a non-certified complex of the same development scale.
The findings of this study support previous findings about the green premium by elucidating factors contributing to green building price premium discrepancies across different geographical locations and housing market segments. Based on an empirical analysis, our overall conclusion is that the merits of green building, such as improved building performance and enhanced quality of life, are reflected in apartment sales prices. If the purpose of introducing building environmental assessment systems in 1990s was to promote green buildings by identifying and standardizing their qualities in a way that helps potential stakeholders benefit from green building investment (through higher rents and sales), our findings indicate that G–SEED is on the right track. Our results can serve not only as a reference for various stakeholders engaged in deciding whether to invest more in green building but also for government officials debating where to add incentives, if needed, to encourage green building equally at all project scales. Base on this study, it is evident that housing in G–SEED certified apartment complexes is typically sold at a higher price, but it is equally important to determine whether the reported price premiums are related to the G–SEED certification itself or some other desired sustainable features of the apartment. Further studies will investigate the proportions of the G–SEED premium that are associated with the main evaluation criteria of G–SEED certification. We believe that such information is needed to ascertain where to focus attention and investment.
Disclosure statement
No potential conflict of interest was reported by the author(s).
References
- Addae-Dapaah, K., and S. J. Chieh. 2011. “Green Mark Certification: Does the Market Understand?” Journal of Sustainable Real Estate 3 (1): 162–191. doi:10.1080/10835547.2011.12091828.
- Berry, M. A., and D. A. Rondinelli. 1998. “Proactive Corporate Environmental Management: A New Industrial Revolution.” Academy of Management Perspectives 12 (2): 38–50. doi:10.5465/ame.1998.650515.
- Bond, S. A., and A. Devine. 2016. “Certification Matters: Is Green Talk Cheap Talk?” The Journal of Real Estate Finance and Economics 52 (2): 117–140. doi:10.1007/s11146-015-9499-y.
- Brounen, D., and N. Kok. 2011. “On the Economics of Energy Labels in the Housing Market.” Journal of Environmental Economics and Management 62 (2): 166–179. doi:10.1016/j.jeem.2010.11.006.
- Bruegge, C., C. Carrión-Flores, and J. C. Pope. 2016. “Does the Housing Market Value Energy Efficient Homes? Evidence from the Energy Star Program.” Regional Science and Urban Economics 57: 63–76. doi:10.1016/j.regsciurbeco.2015.12.001.
- Cajias, M., F. Fuerst, and S. Bienert. 2019. “Tearing down the Information Barrier: The Price Impacts of Energy Efficiency Ratings for Buildings in the German Rental Market.” Energy Research & Social Science 47: 177–191. doi:10.1016/j.erss.2018.08.014.
- Chegut, A., P. Eichholtz, and N. Kok. 2014. “Supply, Demand and the Value of Green Buildings.” Urban Studies 51 (1): 22–43. doi:10.1177/0042098013484526.
- Chihiro, S. 2010. “Will Green Buildings Be Appropriately Valued by the Market?” RIPESS Working Paper 40: 1–28.
- Couch, C., A. T. Carswell, and V. Zahirovic-Herbert. 2015. “An Examination of the Potential Relationship between Green Status of Multifamily Properties and Sale Price.” Housing and Society 42 (3): 179–192. doi:10.1080/08882746.2015.1121675.
- Dell’Anna, F., and M. Bottero. 2021. “Green Premium in Buildings: Evidence from the Real Estate Market of Singapore.” Journal of Environmental Economics and Management 286: 125327. doi:10.1016/j.jclepro.2020.125327.
- Deng, Y., Z. Li, and J. M. Quigley. 2012. “Economic Returns to energy-efficient Investments in the Housing Market: Evidence from Singapore.” Regional Science and Urban Economics 42 (3): 506–515. doi:10.1016/j.regsciurbeco.2011.04.004.
- EarthExplorer. “USGS Numbered Series.” Available online: https://pubs.er.usgs.gov/publication/gip136 ( accessed on 16 August 2021).
- Eichholtz, P., N. Kok, and J. M. Quigley. 2010. “Doing Well by Doing Good? Green Office Buildings.” American Economic Review 100 (5): 2492–2509. doi:10.1257/aer.100.5.2492.
- Eichholtz, P., N. Kok, and J. M. Quigley. 2013. “The Economics of Green Building.” Review of Economics and Statistics 95 (1): 50–63. doi:10.1162/REST_a_00291.
- European Commission. “Energy Performance Certificates in Buildings and Their Impact on Transaction Prices and Rents in Selected EU Countries.” Available online: https://ec.europa.eu/energy/sites/ener/files/documents/20130619-energy_performance_certificates_in_buildings.pdf ( accessed on 24 August 2021).
- Fuerst, F., P. McAllister, A. Nanda, and P. Wyatt. 2015. “Does Energy Efficiency Matter to home-buyers? An Investigation of EPC Ratings and Transaction Prices in England.” Energy Economics 48: 145–156. doi:10.1016/j.eneco.2014.12.012.
- Fuerst, F., P. McAllister, A. Nanda, and P. Wyatt. 2016. “Energy Performance Ratings and House Prices in Wales: An Empirical Study.” Energy Policy 92: 20–33. doi:10.1016/j.enpol.2016.01.024.
- Fuerst, F., and C. Shimizu. 2016. “Green Luxury Goods? The Economics of eco-labels in the Japanese Housing Market.” Journal of the Japanese and International Economies 39: 108–122. doi:10.1016/j.jjie.2016.01.003.
- Gibbs, D., J. Longhurst, and C. Braithwaite. 1996. “Moving Towards Sustainable Development? Integrating Economic Development and the Environment in Local Authorities.” Journal of Environmental Planning and Management 39 (3): 317–332. doi:10.1080/09640569612444.
- Hui, E. C., C. K. Tse, and K. H. Yu. 2017. “The Effect of BEAM Plus Certification on Property Price in Hong Kong.” International Journal of Strategic Property Management 21 (4): 384–400. doi:10.3846/1648715X.2017.1409290.
- Hwang, S. J., and H. Suh. 2021. “Analyzing Dynamic Connectedness in Korean Housing Markets.” Emerging Markets Finance and Trade 57 (2): 591–609. doi:10.1080/1540496X.2019.1649653.
- Hyland, M., R. C. Lyons, and S. Lyons. 2013. “The Value of Domestic Building Energy efficiency—evidence from Ireland.” Energy Economics 40: 943–952. doi:10.1016/j.eneco.2013.07.020.
- Jang, D. C., B. Kim, and S. H. Kim. 2018. “The Effect of Green Building Certification on Potential Tenants’ Willingness to Rent Space in a Building.” Journal of Cleaner Production 194: 645–655. doi:10.1016/j.jclepro.2018.05.091.
- Kahn, M. E., and N. Kok. 2014. “The Capitalization of Green Labels in the California Housing Market.” Regional Science and Urban Economics 47: 25–34. doi:10.1016/j.regsciurbeco.2013.07.001.
- Kang, B. R., and O. K. Yuh. 2014. “Analysis of the Impact of G-SEED on Real Estate Price Focused on Apartment House.” Journal Korea Institute Build Constr 48: 79–92.
- Kang, C. D. 2019. “Spatial Access to Metro Transit Villages and Housing Prices in Seoul, Korea.” Journal of Urban Planning and Development 145 (3): 05019010. doi:10.1061/(ASCE)UP.1943-5444.0000516.
- Kim, E. J., and H. Kim. 2020a. “Neighborhood Walkability and Housing Prices: A Correlation Study.” Sustainability 12 (2): 593. doi:10.3390/su12020593.
- Kim, H. G., and S. S. O. Kim. 2020b. “Awareness of and Satisfaction with Green Building Technologies in a Certified Office Building.” Sustainability 12 (5): 2109. doi:10.3390/su12052109.
- Kim, J. M., S. J. Shin, and I. Hur. 2014. “Estimate of Additional Construction Cost as Certifying G-SEED of Office Building in Korea.” KIEAE Journal 14 (5): 21–28. doi:10.12813/kieae.2014.14.5.021.
- Kim, K. H., S. S. Jeon, A. Irakoze, and K. Y. Son. 2020. “A Study of the Green Building Benefits in Apartment Buildings according to Real Estate Prices: Case of non-capital Areas in South Korea.” Sustainability 12 (6): 2206. doi:10.3390/su12062206.
- Kim, M. Y., and H. G. Kim. 2018. “Analysis of Construction Cost of Energy Performance by Apartment Size according to Seoul Green Building Design Guide and G-SEED Revision.” Journal of Korean Institute of Architectural Sustainable Environment and Building Systems 12: 1–14.
- Kim, T. H., and Y. S. Jeong. 2018. “Analysis of energy-related Greenhouse Gas Emission in the Korea’s Building Sector: Use National Energy Statistics.” Energies 11 (4): 855. doi:10.3390/en11040855.
- Kok, N., and M. Jennen. 2012. “The Impact of Energy Labels and Accessibility on Office Rents.” Energy Policy 46: 489–497. doi:10.1016/j.enpol.2012.04.015.
- Kok, N., and M. E. Kahn 2012. “The Value of Green Labels in the California Housing Market: An Economic Analysis of the Impact of Green Labeling on the Sales Price of a Home.” Available online: http://www.environment.ucla.edu/newsroom/the-value-of-greenlabels-in-the-california-housing-market (accessed on 23 August 2021).
- Korea Environmental Industry Technology Institute. “G-SEED Certification Status.” Available online: https://www.gbc.re.kr ( accessed on 17 June 2021).
- Lee, D. H., and J. M. Kim. 2019. “A Study on the Cost Impact of Additional Construction as Rating G-SEED Certification of Medium-Sized Office Buildings in Korea-Based on G-SEED 2016-2 (Effective September 1, 2018)-.” Journal of the Architectural Institute of Korea Structure & Construction 35 (10): 225–234.
- Lee, J., and M. Shepley. 2018. “Analysis of Human Factors in a Building Environmental Assessment System in Korea: Resident Perception and the G-SEED for MF Scores.” Building and Environment 142: 388–397. doi:10.1016/j.buildenv.2018.06.044.
- Lee, J., and M. Shepley. 2019. “The Green Standard for Energy and Environmental Design (g-seed) for multi-family Housing Rating System in Korea: A Review of Evaluating Practices and Suggestions for Improvement.” Journal of Green Building 14 (2): 155–175. doi:10.3992/1943-4618.14.2.155.
- Lee, J. K. 2014. “A Study on Comparing and Analyzing Domestic and Foreign Green Building Certification Criteria for School Facility-Focused on the G-SEED and LEED, BREEAM.” The Journal of Educational Environment Research 13 (3): 15–22. doi:10.7743/kiee.2014.13.3.015.
- Miller, N., J. Spivey, and A. Florance. 2008. “Does Green Pay Off?” Journal of Real Estate Portfolio Management 14 (4): 385–400. doi:10.1080/10835547.2008.12089822.
- Park, M., A. Hagishima, J. Tanimoto, and C. Chun. 2013. “Willingness to Pay for Improvements in Environmental Performance of Residential Buildings.” Building and Environment 60: 225–233. doi:10.1016/j.buildenv.2012.10.017.
- Pivo, G., and J. Fisher “Investment Returns from Responsible Property Investments: Energy Efficient, transit-oriented and Urban Regeneration Office Properties in the US from 1998-2008.” Responsible Property Investing Center, Boston College, University of Arizona, Benecki Center for Real Estate Studies, and Indiana University, Working Paper WP-08-2, rev. 2009
- Reichardt, A., F. Fuerst, N. Rottke, and J. Zietz. 2012. “Sustainable Building Certification and the Rent Premium: A Panel Data Approach.” Journal of Real Estate Research 34 (1): 99–126. doi:10.1080/10835547.2012.12091325.
- Rosen, S. 1974. “Hedonic Prices and Implicit Markets: Product Differentiation in Pure Competition.” Journal of Political Economy 82 (1): 34–55. doi:10.1086/260169.
- Sirmans, S., D. Macpherson, and E. Zietz. 2005. “The Composition of Hedonic Pricing Models.” Journal of Real Estate Literature 13 (1): 1–44. doi:10.1080/10835547.2005.12090154.
- Walls, M., T. Gerarden, K. Palmer, and X. F. Bak. 2017. “Is Energy Efficiency Capitalized into Home Prices? Evidence from Three US Cities.” Journal of Environmental Economics and Management 82: 104–124. doi:10.1016/j.jeem.2016.11.006.
- Wiley, J. A., J. D. Benefield, and K. H. Johnson. 2010. “Green Design and the Market for Commercial Office Space.” The Journal of Real Estate Finance and Economics 41 (2): 228–243. doi:10.1007/s11146-008-9142-2.
- Yoshida, J., and A. Sugiura. 2015. “The Effects of Multiple Green Factors on Condominium Prices.” The Journal of Real Estate Finance and Economics 50 (3): 412–437. doi:10.1007/s11146-014-9462-3.
- Yun, Y., D. Cho, and C. Chae. 2018. “Analysis of Green Building Certification System for Developing g-SEED.” Future Cities and Environment 4 (1). doi:10.5334/fce.37.