
 ?Mathematical formulae have been encoded as MathML and are displayed in this HTML version using MathJax in order to improve their display. Uncheck the box to turn MathJax off. This feature requires Javascript. Click on a formula to zoom.
ABSTRACT
Population change is an important indicator of city status and can guide urban planning. Based on population changes, each city is categorised as “a growing city,” “a stagnant city,” or “a shrinking city.” Although shrinking and stagnant cities are common, city planning based on the pro-growth paradigm often omits them, causing negative impacts on the performance of urban policy, especially in less-developed countries. To fulfil the limited understanding of the population changes in those countries, this study aims to investigate the population change patterns between 2010 and 2019 using provincial cities in Thailand as a case study. All the provincial cities were categorised based on their annual population change rate. Cluster analysis was performed to categorise sub-clusters based on the status of urban population concentration and its changes. The results reveal that, although Thailand is rapidly urbanising, only 7 out of 76 provincial cities are in the growing city cluster. Most provincial cities are in the stagnant or shrinking city cluster, with urban concentration decline happening as a result. This evidence indicates that several provincial cities may be shrinking. Related government organisations should shift the paradigm of urban management based on population changes.
1. Introduction
Population change is a process and output of natural increase and migration (Martinez-Fernandez et al. Citation2012, 214; National Research Council Citation2003, 89). It is a phenomenon that is closely related to the urbanisation process (Champion Citation2001, pp. 147–148; Dyson Citation2011, pp. 47–48; Kabisch and Haase Citation2011; Turok and Mykhnenko Citation2007, 167). The number of population changes is a crucial variable which urban planner usually used to determine the urban development policies because it reflects the status of the cities: growing cities, stagnant cities and shrinking cities (Turok and Mykhnenko Citation2007; Wiechmann and Wolff Citation2013).
Previously, scholars attempted to suggest that the urbanisation process of the macro-scale areas like country and continent affects the population change in the micro-scale, causing its pattern not to be homogenous; there is not just a growth pattern. It consists of the growing cities and the shrinking cities suggesting the parallel mode (Alves et al. Citation2016, 28; Hattori, Kaido, and Matsuyuki Citation2017, 131; Oswalt Citation2008, 3; Turok and Mykhnenko Citation2007, pp. 169–170; Wiechmann and Wolff Citation2013, 7). Recently, the information of the United Nations (Citation2019, 73) indicates that there were 94 shrinking cities between 2015–2020. Until 2030, 5 % of the cities worldwide will encounter a population decline. In the future, the process of growth and shrinkage will reach a balance, and the population shrinkage in the city will be a common phenomenon (Oswalt Citation2008). Thus, shrinking cities and growing cities are unavoidable, global phenomenon.
The latest study of Moreno-Monroy, Schiavina, and Veneri (Citation2021) which explored the global population changes found that despite the increase in population in the metropolitan areas between 2000–2015, about 22% of the metropolitan areas around the world shrank and stagnated. 45% of them were in the more developed countries while 26% were in Asia, especially in the less developed countries. However, the antecedent studies only focused on more developed countries such as the European countries, Australia, the United States and Japan (Alves et al. Citation2016, 21; Cunningham-Sabot & Fol, Citation2007; Hattori, Kaido, and Matsuyuki Citation2017; Mallach, Haase, and Hattori Citation2017; Martinez-Fernandez et al. Citation2012; Pallagst Citation2010; Wang, Yang, and Qian Citation2020, 2; Wiechmann and Wolff Citation2013).
There are numerous shrinking cities in Japan, especially in the small and local cities outside metropolitan areas. In contrast, the suburban cities surrounding the major cities and the cities in the new town development project have a higher rate of population growth thanks to immigration (Mallach, Haase, and Hattori Citation2017, 103; Martinez-Fernandez et al. Citation2016, pp. 13–14, 16). Wang et al. (Citation2020, pp. 4, 9–11) indicate that 503 of 790 cities between 2000–2010 were shrinking cities. The declining birth rates and the strict regulation of overseas immigration are the main driving factors affecting the pattern of population change in the cities across Japan (Martinez-Fernandez et al. Citation2016, 13).
For the European countries, there are studies classifying cities into clusters based on population changes as well. The analyses on the shrinking city distribution have been widespread since early 2000 (Martinez-Fernandez et al. Citation2016). Several studies indicate that the number of shrinking cities has risen across European countries in recent years (Turok and Mykhnenko Citation2007, pp. 168–170; Wiechmann and Wolff Citation2013). The cities in the United States were also studied like this (Fol and Cunningham-Sabot Citation2010; Morrill Citation2012). They have been classified as shrinking and growing cities. The latest data from the population division of the U.S. Census (Citation2020) revealed that between 2010–2019, 132 out of 719 cities with over 50,000 people encountered the population decline. The population change was related to suburbanisation and deindustrialisation associated with migration (Fol and Cunningham-Sabot Citation2010; Martinez-Fernandez et al. Citation2016).
The group of more developed countries mentioned earlier and some cities in the group of less developed countries were also classified as the shrinking cities (Fol and Cunningham-Sabot Citation2010, 6; Oswalt Citation2008). The examples are India (OECD Citation2020, 101), Iran (Hajian Hossein Abadi and Khavarian-Garmsir Citation2021), China (Long and Gao Citation2019), Sri Lanka, Cuba, the Republic of Korea (United Nations Citation2019, 73), and the countries in the central Asia (Restrepo Cadavid et al. Citation2017, pp. 11–12).
Although there have been indications of shrinking cities globally, most studies focused on big cities resulting in the lack of the change information in small cities which accounts for the most part of the city system. The previous studies found that the medium and small cities have also encountered the population shrinkage (Fol and Cunningham-Sabot Citation2010, 13; Hajian Hossein Abadi and Khavarian-Garmsir Citation2021; Mallach, Haase, and Hattori Citation2017, 103; Tong et al. Citation2020). Moreover, the studies about big cities may mean that the population decline in medium and small cities will be overshadowed by the rapidly growing big cities (Long and Gao Citation2019). Despite being studied widely in more developed countries, shrinking cities in more and less developed countries have both similar and different patterns and contexts as stated by several studies from less developed countries (Cunningham-Sabot et al. Citation2013; Hartt Citation2017). The differences appear in the patterns of the shrinking cities in more developed countries as well (Buhnik Citation2010, 151; Mallach, Haase, and Hattori Citation2017, 103). For example, Long and Gao (Citation2019) indicate that although the population of the biggest cities and the developed coastal cities in China showed an increase population between 2000–2010, the township population had decreased from 39,007 to 19,882. However, the proportion of depopulation is lower than the developed countries and despite the shrinking cities, the economy still is growing. For small cities, Tong et al. (Citation2020, pp. 11–12) who compared the shrinkage of the small cities in China and the developed countries found that the small cities in China are different in many aspects ranging from the causes the characteristics of the cities, the economic structure, and the policy of administrative boundary. Or in the case of Iran, Khavarian-Garmsir et al. (Citation2018) showed that a shrinking city is a consequence of the government policy, the external factor and the condition of housing sector investment.
Although there are studies about urban population change worldwide, unfortunately, The insight from small cities (Grossmann and Mallach Citation2021) and the cities in less developed countries leave a big gap for the academic circle related to urban planning. This is because different contexts between less developed countries and more developed countries need different policies to manage the cities. The study of Guan et al. (Citation2021, 15) reveals that although China has shrinking cities like the western countries, its capital transfer is slower than population transfer, so the related government office should support the traditional industries and the high-tech industry. As a result, it is essential to study about the patterns of population change phenomenon in less developed countries. That helps fulfil the background experiences related to the city patterns, which are sensitive to the time and the context of a country.
Thailand is among the less developed countries. Over the past years, due to the increasing urban population, Thailand has encountered rapid urbanisation (United Nations Citation2019, 22). The urban population is growing within the Thesaban [municipality] boundary, the urban area unit of Thailand. According to the Thesaban Organisation Act 1953, the Thesaban boundaries are divided by the population size and income. They are categorised into three types (excluding Bangkok and Pattaya city, which are the special urban settlements in Thailand): Thesaban Nakhon (City-municipality) with a population of over 50,000, Thesaban Muang (Town-municipality) with a population of over 10,000, and Thesaban Tambon (Subdistrict-municipality).
Although the laws designated Thesaban areas as urban areas of Thailand, urban areas, in general, refer to the provincial cities. They are the centres of the provinces in many aspects ranging from administrative, settlement and economic to social aspects. When the transportation and the industries were undeveloped, the population changes within the provincial cities occurred naturally due to the limitation on mobility. Later, the National Economic and Social Development Plans and the urbanisation caused the development of the transportation and the economic areas, resulting in more internal immigration into the economic or peri-urban areas (Ratniyom Citation2017, pp. 76–78). The population sprawled into other areas, both provincial cities and other types of cities, causing the population in the provincial cities to change dynamically.
Despite such a situation and just as many countries, the population changes within the provincial cities of Thailand vary; few studies on urban area classification based on population change were conducted. Like many other countries worldwide, shrinking cities have not been mentioned much in the Thai academic context and Thai urban policies (Long and Gao Citation2019; Long and Wu Citation2016; Martinez-Fernandez et al. Citation2016, 5). The city management of Thailand has only been based on a pro-growth policy, although the population of Thailand was predicted to be shrunk by 2050 (Jarzebski et al. Citation2021, 4). The prototype policy based on the pro-growth policy is not a panacea that can respond to every pattern of population change in the city and is not sustainable. The incorrespondence leads to problems in many dimensions (Heeringa Citation2020), especially infrastructure redundancy, public utilities, city-area deterioration and liquidity in a city.
Within this context, this study aims to (1) analyse the patterns of changes in population and urban concentration in the provincial cities and (2) categorise provincial cities into clusters to lay a foundation for generating sustainable provincial city management frameworks. The finding will be one of the important case studies providing insights about the cities of less developed countries which need more attention and evidence. Furthermore, this study will offer more bodies of knowledge about city patterns based on the population change at the national level. It presents the urban situations in Thailand influenced by the concept of pro-growth strategies. The influence is not limited to the growing cities; the shrinking and stagnant cities are also affected. The involved departments should adjust the paradigm used for city planning to correspond with the actual population change.
This paper is structured into five sections as follows. We will begin the next section with data and methodology. In this section, we provide information about the study area, population data, supplementary data, and the methodologies that were performed to determine the pattern of population change and classify the clusters. Followed by the first result in the section of results 1: the spatial distribution of the population in the provincial cities, in this part, we describe the patterns of population changes based on three indices by discussing the statistical data with the previous studies. The next result is then presented in results 2: the cluster profile. In this part, the characteristics of each cluster are briefly described. Then, in the section of discussion and conclusion, the patterns of population changes in this study were discussed using the previous studies to point out the characteristics of the population change patterns in the provincial city in Thailand from 2010 to 2019. In addition, the brief city management approach based on each cluster was presented here. Finally, the limitations and brief direction of the research were provided.
2. Data and methodology
2.1. Study area
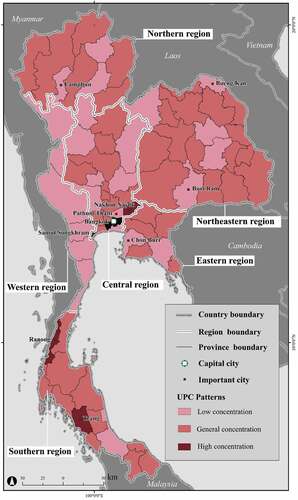
The study area covers every Thesaban that is a provincial city. Based on the number of provinces in Thailand in 2019, there are 76 provincial cities, excluding Bangkok, the capital city. The number increased from 75 provincial cities after the establishment of Bueng Kan Province in 2011. At present, there are 22 Thesaban Nakhon and 54 Thesaban Muang across the country, as shown in .
Figure 1. Map illustrating the provincial cities in 2019.
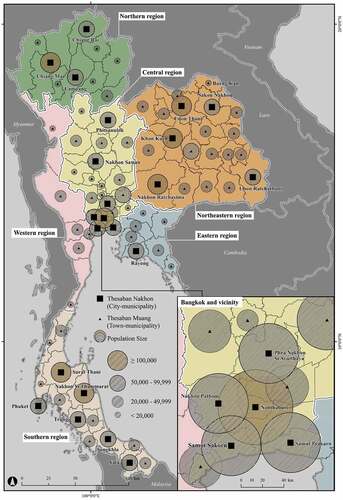
In this study, the names of the provincial cities are put after their Thesaban. We will use abbreviations for each type of Thesaban: TN is for Thesaban Nakhon; TM is for Thesaban Muang; TT is for Thesaban Tambon.
2.2. Data
The data used in this study consist of two parts.
2.2.1. Population data
Because of the limitation to access the population data about the birth, death and migration at the provincial city level, we decided to use the total population to clarify the patterns of population changes. Every piece of data was from 2010 to 2019, except the data of Bueng Kan Province, which was from 2011. The data at the provincial city level were retrieved from the Bureau of Registration Administration’s website (http://stat.dopa.go.th/stat/statnew/), and the data at the province level were from National Statistical Office’s website (http://statbbi.nso.go.th/staticreport/page/sector/th/01.aspx).
Supplementary data
We applied some socioeconomic statistics to define and describe the characteristics of the cluster profiles. The main supplementary data consists of two parts. The first part is the data of Gross Provincial Product (GPP). It was retrieved from the National Economic and Social Development Council’s website (https://www.nesdc.go.th/nesdb_en/ewt_w3c/ewt_dl_link.php?filename=national_account&nid=4317).
GPP is an index to determine the structure of economy and the function of the province based on the economic activities. It consists of 19 sub-sectors, revealing the economic activities. In this study the GPP is the major GPP among the highest GPPs of sub-sectors. As shown in Appendix Table A1, Only 5 sub-sectors were indicated as the main GPPs: accommodation and food services, agriculture activities, manufacturing, mining and electricity supplies, and wholesale and retail trade. Although GPPs were generated from the entire province, not only the provincial city, under the limitation of information at provincial city GPPs can provide the overview about the economic activities in and outside the provincial cities to support the population change pattern. In the provincial cities, GPPs usually respond to economic activities in the group of service based on the context such as wholesale and retail trade, administrative and support service activities, and education. Scholars usually indicate the relationship between the economic structure and the population change pattern. (Barreira et al. Citation2017, 865; Guan, He, and Hu Citation2021; Tong et al. Citation2020)
The second part is the number of Thesaban. It was retrieved from the Department of Local Administration’s websites (http://www.dla.go.th/upload/service/2011/9/156.pdf and http://www.dla.go.th/work/abt/). The data about the number of Thesaban in each level presents the other urban area outside the provincial cities that is related to the urban concentration and the role of an urban settlement centre.
2.3. Methodology
The methodology consists of two parts, as shown in . The first part is the content analysis. The patterns of the population changes in the provincial cities were analysed based on three indices at this step. Then, in the second part, the cluster analysis was performed to divide the groups of the provincial cities by using the characteristics of the population change patterns deriving from the first step.
Figure 2. Research methodology flow chart.
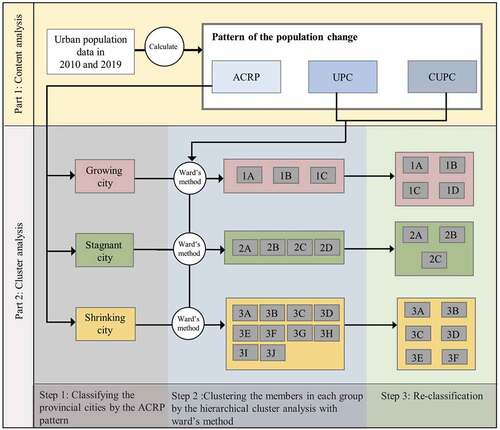
2.3.1. Content analysis
This aims to clarify the patterns of the provincial city population in the aspect of the population changes, the urban population concentration, and its changes. The content analysis with descriptive statistic consists of three parts: ACRP, UPC and CUPC.
The patterns of the annual change rate of the population (ACRP): the population changes are associated with the urbanisation stage. The population changes, both growth and depopulation, reflect the city’s character and are related to the urban services. Many methods were used to determine the change rate of population in the target area such as the change rate in exponential formula (Peterson Citation2017) and the linear growth formula (Guan, He, and Hu Citation2021; Morrill Citation2012; Sun et al. Citation2020).
In this study, ACRP was analysed based on the linear growth formula that is easy to understand and interpret. In addition, to diminish the influence of the time difference between TM. Bueng Kan and other provincial cities, ACRP was analysed as the annual change rates. It was calculated by a simple formula frequently used by previous scholars (Kabisch and Haase Citation2011), as shown below:
Where is the population in the beginning time,
is the population in the end time, and n is the number of periods.
In this study, there are three patterns of ACRP. 1) the population changes with the growth rate of (ACRP ≥ 1). 2) the population changes with the decreased rate of (ACRP ≤ −1). 3) the population changes with the static rate of (ACRP ≥ −1 and ACRP ≤ 1).
The urban population concentration (UPC): the UPC is an index of the urban population’s spatial distribution patterns at the province level. It reflects the urban settlement concentration in the provincial cities revealing the role of an urban settlement centre. It also reflects the urban settlement density in the provincial cities. This index was inspired by and adjusted from the urbanisation rate commonly used to calculate the proportion of the urban population to the total population in the target area (Champion Citation2001; National Research Council Citation2003, 82). We modified it by changing the divider from the total population to the total urban population in the province to reflect the urban population concentration at the local level, as shown in formula (2)
Where is the urban population concentration,
is the number of populations in the provincial city, and
is the urban population in the province.
Because the divider was changed into the total urban population, UPC can reflect the role of the urban settlement concentration of the provincial city at the province level. In order to analyse the pattern of the UPC, we applied the normal distribution concept to classify the patterns into three groups:
The city has a high UPC compared with other cities in the province. It is a city with a value equal to or greater than the mean value of 50%. (The range of all plus the standard deviation from the mean of 50%).
The city has a general UPC compared with other cities in the province. It has a value of 15.90–50%. The cut point at 15.90 was determined by the range of minus one standard deviation from the mean.
The city has a low UPC compared with other cities in the province. It has a value of less than 15.9%, which is the value next to minus one standard deviation from the mean.
The changes in the urban population concentration (CUPC): this index shows how the provincial city lost or gained the role of an urban settlement centre in terms of the urban population change. The CUPC was calculated via the formula below:
Where is the urban population concentration in the end time, and
is the urban population concentration in the beginning time.
To clarify the patterns of CUPC, we categorised their patterns into three types..
The city has a value over 1.0, indicating that it gains the role of the urban settlement centre from the increasing urban population concentration at the province level owing to the immigration or the shrinking urban population outside the provincial city.
The city has a value less than −1.0, indicating that it is losing the role of the urban settlement centre from the decreasing of urban population concentration at the province level owing to the increase in population outside the provincial city or the population decline in the provincial city.
the city has a value between −1.0 and 1.0, indicating that the change of city role as the urban settlement centre is static. The change of urban population concentration maintains a balance between the provincial cities and the urban areas outside during the time.
2.3.2. Cluster analysis
In urban studies, cluster analysis is a traditional methodology applied for classifying cities. Clusters of the cities with high homogeneous characteristics help planners quickly identify the proper policies to solve the city problems. This study attempts to categorise the provincial cities regarded as urban settlements in Thailand into clusters based on their population change patterns deriving from the content analysis. The categorisation has three stages, as shown in .
In the first stage, we classified the provincial cities into three clusters based on the ACRP pattern: the growing city, the stagnant city, and the shrinking city. In the second stage, the UPC in 2019 and the CUPC during the 2010s were the variables used to classify the clusters on IBM SPSS Statistic 27. The hierarchical cluster analysis with the Ward’s method, a commonly used method (Rogerson Citation2010, 306), was applied with two indices to classify the cities in each cluster.
Ward’s method is a statistical technique use to perform to classify the city or spatial cluster (Oke et al. Citation2019; Omurbek, Akcakaya, and Akcakaya Citation2021; Salazar, Pallares-Barbera, and Vera Citation2020). It divides the groups of members based on the size of an error sum-of-squares criterion (Everitt et al. Citation2011, 77). Generally, in the Ward’s method algorithm, every member begins as its own cluster. Then a pair of clusters is merged by minimizing the increase in the total within-cluster error sum of squares. This process continues until only one cluster remains (Everitt et al. Citation2011, 77; Rogerson Citation2010, 305). Scholars regard Ward’s method as the outperform technique to compose the cluster (Blashfield Citation1976; Oke et al. Citation2019). The process of Ward’s method is simple and there’s no need to specify the number of clusters before analysis. In addition, it is suitable to compose the sample through the continuous data (Everitt et al. Citation2011, 258). From this advantage, the ward’s method was performed in this study to classify the clusters of the provincial cities that the value of indices is the continuous data.
After the classification in the second stage, there are 17 sub-clusters. The last stage is re-classification. The descriptive statistical analysis of the cluster indicates that a few members of different clusters have a similar pattern of the variables. To make each cluster more homogeneous, we did the re-classification repeatedly by considering the patterns of each member’s overlapping variables and then grouping some provincial cities with a similar pattern together. Finally, we got 13 sub-clusters within the three main clusters that were classified in the first step.
3. Results 1: the spatial distribution of the population in the provincial cities
3.1. The size of the provincial city population and their changes
In 2019, there were 3,341,093 inhabitants in 76 provincial cities. The population sizes of the provincial cities are different. TM. Bueng Kan was the smallest in the population size; there were only 4,494 inhabitants. TN. Nonthaburi was the biggest in the population size with 254,375 inhabitants. According to the number of the population in the provincial cities, there is no provincial city which has more than 300,000 inhabitants. It indicates that although the provincial cities are the core areas of the urban settlement in the provinces, no city reaches the standard of United Nation which identified a city from the population of at least 300,000 inhabitants (United Nations Citation2019, 55). All provincial cities in Thailand are only the urban settlement according to the United Nation’s standard.
The analysis of the provincial city population distribution divided by geographical regions, as shown in , indicates that the inhabitants of the provincial cities were dense in the central and north-eastern regions with a similar ratio, followed by the southern, the northern, the eastern and the western regions. The main reason is that more provincial cities with the largest number of inhabitants – TN. Nonthaburi, TN. Nakhon Sawan, TN. Nakhon Ratchasima, TN. Udon Thani, TN. Khon Kaen, TN. Nakhon Si Thammarat and TN. Surat Thani – distributed in the central, northeast and southern regions. Moreover, the number of provincial cities in the central region was the highest, making up 21 cities, followed by north-eastern regions with 20 cities. The southern, northern, eastern and western regions had only fourteen, nine, seven and five cities, respectively. That’s why the number of provincial inhabitants in the central and northeast regions was higher than in other regions.
Figure 3. The spatial distribution of the ACRP patterns; (a) The distribution map shows the pattern of ACRP; (b) The number of the provincial cities, divided by ACRP patterns; and (c) The number of the provincial cities, divided by the geographical regions and ACRP patterns.
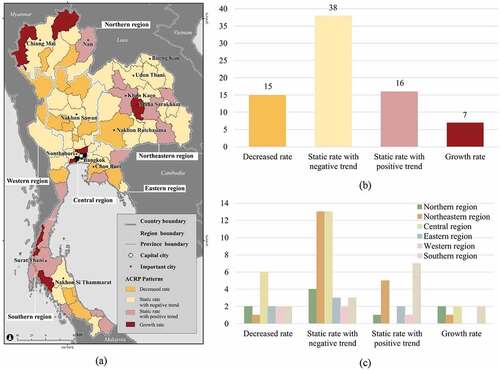
The population in the provincial cities at the country level in 2019 was slightly lower than in 2010 with −0.26 as the average of ACRP at the country level. Precisely, 47 provincial cities have the values lower than that. TM. Maha Sarakham hit the highest ACRP with a growth rate of 2.88. In contrast, TM. Chon Buri hit the highest ACRP with a decreased rate of −1.74. Although many studies showed the correlation between the population size and the change rate by indicating that the cities with low population often encountered the population decline while the cities with high population often encountered the population growth (Park and Heim Lafrombois Citation2019, 245; Sun et al. Citation2020), the analysis of the correlation revealed that there was no significant correlation. TM. Maha Sarakham which had the highest population increase rate ranked twenty-ninth in 2010 in terms of the population size while TM. Chon Buri which had the lowest population increase rate ranked thirty-ninth. After looking at the change rate of the top 10 biggest cities in terms of population in 2010, nine cities are stagnant cities with low population changes. Also, Nakhon Ratchasima which was the second biggest cities ranked eleventh in terms of the population decrease rate. The fluctuation in the population sizes and the population change rates is similar to the study of Merino & Prats (Citation2020, 6) in the 2010s which focused in the municipalities in Spain between 2012–2016 and found that the growth cannot be determined by the previous size.
Considering the patterns of the population changes, indicates that 54 cities were stagnant cities. 16 cities in this group changed with the positive trend while the populations in 38 cities changed with the negative trend. Besides, 15 cities were shrinking cities, and only seven cities were growing cities. Regarding the stagnant cities changing with negative trends and shrinking cities, we found that 53 provincial cities in 2019 experienced a decrease in the population. This contrasts with the trend of the urban population in Thailand, which increased during the 2010s, as shown in . It reflects that the population outside the provincial cities has been increasing. The increasing number of the local Thesaban might have been the result of the decentralisation policy and could have been a significant factor in the population growth outside the provincial cities.
Figure 4. The urban population changes between 2010–2019.
According to the spatial distribution analysis at the regional scale, as shown in , most of the provincial cities in every region were stagnant cities which changed with a negative trend. There were two exceptions. In the western region, the stagnant cities which changed with negative trend accounted for an equal number of the shrinking cities. And for the southern region, most provincial cities were stagnant cities which changed with a positive trend. It is noteworthy that there were no provincial cities in the western region and the eastern region containing only the growing cities.
3.2. The urban population concentration and its changes
At the country level, the average UPC value in 2019 was 24.28. As shown in , there were only four provincial cities – TM. Samut Songkhram, TM. Nakhon Nayok, TM. Ranong and TN. Trang – in which their population accounted for more than 50% of the total population of their provinces. TM. Samut Songkhram hit the highest proportion with 71.95%. Given the GPPs and the structure of each province, the four provincial cities were in the provinces with the agricultural economy and the lower number of Thesaban other than the provincial cities. Consequently, their provincial cities have high population and are the sources of economic activities and public facilities.
Figure 5. The spatial distribution map of the UPC patterns.
In the five provinces with the lowest UPCs which were TM. Chonburi, TM. Pathum Thani, TM. Bueng Kan, TM. Lamphun, and TM. Buriram, the population in TM. Chon Buri was the lowest with the ratio of 2.45% of the total urban population of the province. All the provincial cities were only TM. Which have average population. Considering the economic structures at the province scale through GPPs and the number of Thesaban, three provincial cities (TM. Chonburi, TM. Pathum Thani, TM. Lamphun) were located in the provinces with the manufacturing economy and consisted of many Thesaban, resulting in low concentration of urban population because of the concentration outside the provincial cities, especially in the industrial areas which provided higher employment opportunity. For TM. Bueng Kan, and TM. Buriram, although their economy wasn’t based on manufacturing like the three provinces, the province that TM. Buriram belonged to show the high number of Thesaban outside the provincial cities, causing the low urban concentration. TM. Bueng Kan emerged later when it was upgraded to TT due to the city hall located there, so there is still no sign of high population concentration.
According to the regional level, 48 provincial cities are generally the centres of the urban population in the provinces with UPC Value between 15.90–50%. Most provincial cities in this group are in the north-eastern region, followed by the central region and the Southern region with the same number.
In contrast, 24 provincial cities are less dense in terms of the urban population in the provinces. They have an urban population lower than 15.90% of the total provincial urban population. The provincial cities in this group distributed in every region, mostly the central region, followed by the western region and the north-eastern region with the same number. Notably, every provincial city in the western region was less concentrated. This resulted from the dense urban population in the industrial or commercial areas outside the provincial cities.
At the same time, there were two provincial cities in the southern and central regions in a highly concentrated pattern (UPC ≥ 50%). In contrast, the northern, north-eastern, eastern and western regions had no provincial city housing more than 50% of the total urban population of their provinces.
The UPC decreased at the country level with an average rate of −1.13 during the 2010s. TM. Nong Khai hit the highest change rate at 16.15%. In contrast, TN. Phitsanulok hit the most remarkable change rate at −8.53 due to the increasing population in the outskirt area.
According to the regional level, only six provincial cities, distributing in four regions except for the western and eastern regions, showed the growth rate. Precisely, 38 provincial cities showed a decreased rate. Most of these provincial cities were in the central and southern regions, respectively. 32 provincial cities showed the static rate, and most members of this group were in the north-eastern region, as shown in .
Figure 6. The spatial distribution map of the CUPC patterns.
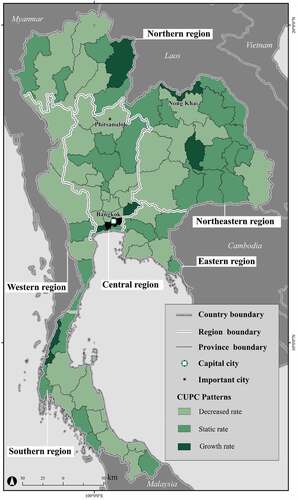
The decrease of the UPC, which was the primary pattern, indicated that most provincial cities were losing the roles as urban settlement centres and were replaced by neighbour cities or district cities owing to the process of suburbanisation and the decentralisation policies from the central government that attempted to spread the development from the core area. The urban system tended to change the provinces from containing only one settlement centre in each provincial city to multi-settlement centres in a province. For eastern and western regions which didn’t see the increase of UPC in any province, the economic structure based on GPP values indicated that their economy didn’t depend on the agriculture, so the urban population concentrated in the industrial, commercial and tourist areas outside the provincial cities, especially in the eastern region whose industries were invested and developed because of the Eastern Seaboard policy and the Eastern Economic Corridor in the 2010s. The policies led to the agglomeration of the technology and industries, followed by the increase in the employment rate (Tontisirin and Anantsuksomsri Citation2021, pp. 1–4) and the population outside the provincial cities. The consequence was the decrease in UPC values.
4. Results 2: cluster profile
According to clustering analysis, provincial cities can be categorised into three clusters with 13 sub-clusters. Each sub-cluster has its own statistic characteristics with three variables, as shown in .
Figure 7. Statistical profile of the variables in each sub-cluster; (a) the distribution of provincial cities in each sub-cluster, (b) the statistical profile of UPC in each sub-cluster, (c) the statistical profile of ACRP in each sub-cluster, and (d) the statistical profile of CUPC in each sub-cluster.
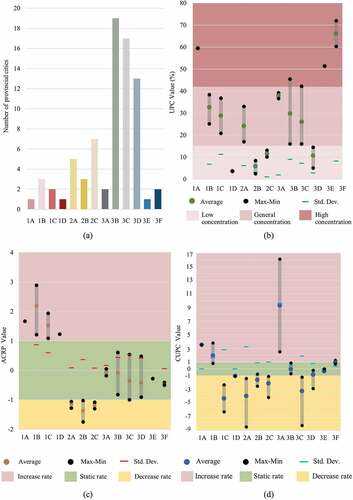
and indicate that each region has a different sub-cluster distribution pattern. The number of provincial cities in each region’s main and secondary sub-clusters is extremely close, except the north-eastern region, where it’s obvious that sub-cluster 3B is the main and sub-cluster 3D is the secondary. Both sub-clusters have similar city profiles; the only difference lies in the UPC. The value of UPC is higher in sub-cluster 3B, which is also the main for the eastern region. The number of eastern provincial cities in this sub-cluster is close to sub-cluster 3C, which is the main for other regions.
Table 1. Distribution of provincial cities divided by clusters and regions.
Figure 8. Cluster profile distribution map.
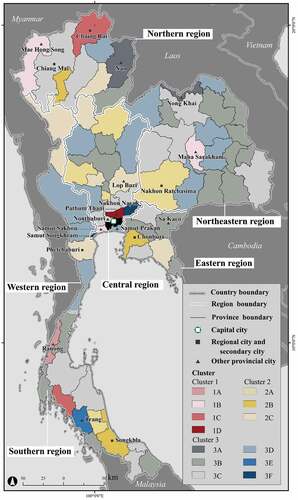
Although sub-cluster 3C isn’t the largest, most cities in the northern, central and southern regions (or three out of six regions) are in this cluster. The members of sub-cluster 3C from each region are mostly regional cities or Thesaban Nakhon. Despite being the main sub-cluster for those regions, sub-cluster 3C doesn’t have much more members than secondary sub-clusters. For example, the nearly equal number of other northern provincial cities are in other seven sub-clusters. Another example is the southern region, where sub-cluster 3B is its secondary sub-cluster and mostly shelters small cities. The central region has a different pattern. It has both sub-cluster 3C and 3D as the main sub-clusters, and these two have an equal number of members. Note that sub-cluster 3D is the main for the western region.
4.1. Cluster 1
Cluster 1 is a group of growing cities. It consists of seven provincial cities, as shown in appendix Table A1. Most provincial cities are located in the northern region, central region and southern region with a similar number. Based on the characteristics of UPC and CUPC, cluster 1 can be classified into four sub-clusters.
4.1.1. Sub-cluster 1A and sub-cluster 1B
The profiles of sub-cluster 1A and sub-cluster 1B are similar. ACRP and CUPC value of both sub-clusters are high, except the CUPC of TM. Mae Hong Son in the sub-cluster 1B which is static. The UPC value of provincial cities in sub-cluster 1B is slightly lower. Sub-cluster 1A and 1B are good representations of a growing city with densely settled populations and their continued population growth rates, including the urban population concentration.
The provincial cities in these clusters have one of the following characteristics. First, some provincial cities are located in provinces with limited settlement areas, such as TM. Ranong and TM. Mae Hong Song in the provinces which the settlement areas are only 2.46% and 1.07%, respectively. Therefore, the public facilities in the provinces are in the provincial cities. Given the limited areas for settlement and the agricultural economy, there are few sources of economic activities outside the provincial cities. That is why the provincial cities become the sources of economic activities and job opportunity, appealing people to settle there.
Second, there are not many other Thesaban in the province where provincial cities are located, so the growth of the urban population outside the provincial cities is not lofty and not comparable to that inside the provincial cities. Third, some provincial cities are the centres of the industrial and educational sectors, such as TN. Samut Sakorn and TM. Maha Sarakham with huge job opportunities and economic activities. Being the sources of job opportunities and economic activities is an important factor in maintain the growing status, especially in the cities that provide employment in the secondary and tertiary sector (Barreira et al. Citation2017, 863).
The provincial cities in this group are in the agriculture-based provinces with few urban areas outside the provincial cities. They also have limited settlement areas and are the economic centres. These factors have a positive impacts on their public facilities and economic strength, leading them to be the sources of economic activities and the settlement areas. The population increase due to economic strength was also mentioned in the study of Barreira et al. (Citation2017, 862) which indicates that the population change has a relationship with the economic strength. Job opportunities appeal people to settle in the cities. The study of Suwanlee and Som-ard (Citation2020) also stated that the population often concentrates in the areas with the intensity of service source, industrial factor and service trades. These areas usually are parts of a district of a provincial city in Thailand according to Gravity Model concept.
4.1.2. Sub-cluster 1C
The city profile of sub-cluster 1C is similar to sub-cluster 1B, but the CUPC of sub-cluster 1C decreased. This reflects the growth of the urban population outside the provincial cities. The dispersal of the population into other urban areas in the same province makes the role of urban settlement centres in the provinces less stable. Yet, this increase is not sufficient to restructure the city system. The provincial city remains the urban settlement centre in the province, such as in the case of TN. Chiang Rai. It is worth mentioning that the small towns near the Chiang Rai border locate customs houses, which play an important role in terms of international trading. The customs houses are also a significant factor in the decrease of the UPC. In 2010–2019, the populations in TT. Mae Sai and TT. Chiang Saen changed dramatically at the rate of 43.74% and 33.18%, respectively. Although the population in the border cities increased so much that CUPC of TN Chiang Rai became negative, the huge distance to the new economic centre and the role as a main city at microregional scale enabled TN Chiang Rai to accumulate economic activities and become a big city which was 2.73 times more populated than TT. Mae Sai.
4.1.3. Sub-cluster 1D
Sub-cluster 1D is evidently different from other sub-clusters because its UPC value is low and likely to decrease despite the increase in ACRP. The decrease emphasises that it is no longer the main settlement area in the province and is beaten by other cities full of communities, economic growth, or industrialisation. This means that the provincial city now merely serves as the local administrative centre. There is only one member in this sub-cluster: TM. Pathum Thani.
Owing to urbanisation, the population increased in the outskirt areas of Bangkok, as seen through the high number of TNs and TMs in the outskirt areas. As a result, the population of TM. Pathum Thani made up only 3.60% of the total urban populations in 2019, and this is likely to keep declining with the rate of −1.05. Therefore, despite the increase of the population in TM. Pathum Thani, the population growth in the outskirt area of Bangkok prevents TM. Pathum Thani from keeping its role as the main urban settlement centre. TN. Rangsit connecting Bangkok and TM. Pathum Thani in the north is the biggest urban area of Pathum Thani and 3.61 times bigger than TM. Pathum Thani. It is the twelfth biggest TN in Thailand. The increase in accommodations, malls and industrial factories in the areas connecting Bangkok and Pathum Thani is an important factor that is going to deprive TM. Pathum Thani of its role as the urban settlement centre. This was illustrated in the study of Losiri & Nagai (Citation2020, 38) who explored the urban expansion in BMR. The study showed that between 2011–2014 the urban areas were growing dramatically in the areas connecting Pathum Thani Province and Bangkok, especially when compared with the areas in the provincial city.
4.2. Cluster 2
Cluster 2 consists of the provincial cities whose population and UPC value decreased. This shows that these provincial cities are shrinking cities because of two significant factors. First, the city system structure in each province comprises many other cities besides the provincial cities, increasing the number of populations outside the provincial cities. This is related to the suburbanisation and the policy of decentralisation process. Second, the provincial city areas are fairly small. There are no bigger than 20 square kilometres, except TN. Nakhon Ratchasima. The emergence of shrinking cities in the small urban areas is similar to the shrinking cities in France. Most of them cover limited areas. This is consistent with the concentration of activities, population, employment, and information flow (Cunningham-Sabot et al. Citation2013). Besides the limitation of the areas, 10 members are the old towns. Thus, the urban area sizes were limited for the population increase both horizontal and vertical owing to the conservation policy, affecting the value of UPC. This cluster has 15 members, mostly in the central region, categorised into three sub-clusters, as shown in Appendix Table A1.
4.2.1. Sub-cluster 2A
Sub-cluster 2A comprises the provincial cities facing the population decline, but it is the only sub-cluster with the moderate UPC value. The sub-cluster 2A contains five provincial cities. The prominent factors for the shrinkage of UPC are the population decline in the provincial cities and population growth in small urban communities and the outskirts. Suburbanisation is a phenomenon occurring when the population increases in the outskirts while decreases in the core area. It also happened in many European countries (Barreira et al. Citation2017, 855; Cunningham-Sabot et al. Citation2013). Nevertheless, the populations in the outskirts do not increase much as it can be seen that those Thesaban around the provincial cities is small.
Another factor influencing the population growth outside the provincial cities and lessening their roles as the urban settlement centres is the population increase in the tourist and industrial areas, appealing new settlement. The increase happened for the same reason as the migration of Thais in 2010; they moved because of job opportunities. Most of these people worked in the service and industry sectors (National Statistical Office Citation2020, 19). The industrial and tourist areas are the centres of the districts and far away from the provincial cities. For example, Nakhon Ratchasima Province contains four TM in the tourist and industrial areas.
4.2.2. Sub-cluster 2B and sub-cluster 2C
Sub-cluster 2B is similar to sub-cluster 2C. They face a decline in the number of populations and the UPC level. However, the UPC of sub-cluster 2B is lower than sub-cluster 2C. The CUPCs of two sub-clusters indicates that the provincial cities in these groups are losing their roles as urban settlement centres.
In the case of sub-cluster 2B, the provincial cities in this sub-cluster have two shared characteristics. First, they are small cities with no more than 10-square-kilometre areas. Second, they are provincial cities of the provinces where GPP mainly comes from manufacturing industries. The emergence of the commercial areas and industrial estates outside the provincial cities, along with the growth of economic cities, have lowered the UPC value and their provincial cities’ roles as the settlement centre. For example, Songkhla Province’s biggest city is TN. Hatyai, which is also the biggest regional area of Thailand. It is a crucial commercial and industrial area in the southern and Indonesia-Malaysia- Thailand Growth Triangle (IMT-GT) areas. Compared with TN. Songkhla, TN. Hatyai is 2.53 times bigger. In Chon Buri Province, the provincial city is not big, and the biggest cities are in major tourist and industrial areas such as Pattaya City, TN. Chaophrayasuren and TN. Lamchabang. The total population of these three example cities are 8.89 times much more than TM. Chon Buri. Besides the dense population in industrial areas, small Thesaban areas connected to the provincial cities have a population increase. The population growth in the economic and industrial areas causing the population decrease in the provincial cities also appears in the findings of Alves et al. (Citation2016, 26) which is about the population change in a city. The findings reveal that the population moves to the areas with better economic and social conditions. Cunningham-Sabot et al. (Citation2013) indicates that the emergence of a new city due to the industry development will exclude the old economic area and result in the sluggish economy in that area.
Tong et al. (Citation2020, 11) stated that the population flow within the province is related to the industrial development area. However, Jilin City and the provincial cities in this group are different because the high intensity of economic activities in Jilin occurred in the core area and turning the area into a growing city while the high intensity of economic activities happened outside the provincial cities in this group owing to the development policies of the government. Therefore, the outside area became the main sources of economic activities and job opportunities whereas the core area saw the population decline.
In the case of sub-cluster 2C, its members are located in the provinces with different characteristics from sub-cluster 2B. Considering the GPP, the economic structures of their provinces are mainly related to agricultural activities, except Lop Buri Province and Petchaburi Province, whose economic systems are related to agricultural manufacturing. The increase of population in the industrial zone is not the crucial cause like the sub-cluster 2B. The main cause of losing UPC is similar to sub-cluster 2A. It is because there is a population increase in the peri-urban areas of the provincial cities due to the suburbanisation and in the cities that are the district cities and other small cities due to the decentralisation policy.
4.3. Cluster 3
Cluster 3 consists of the provincial cities whose population changed slightly. In other words, they are stagnant cities. Most cities maintain their roles as the significant urban settlement centres of the provinces and are located in the north-eastern region. Cluster 3 is the biggest, consisting of 54 provincial cities. These provincial cities can be categorised into six sub-clusters based on UPC and CUPC, as shown in Appendix Table A1.
4.3.1. Sub-cluster 3A
The provincial cities are the moderate urban settlement centre of the provinces, with populations of more than 35% of the total urban populations of the provinces. Although the ACRP is static, the UPC seems to increase. Their two members are TM. Nong Khai and TM. Nan. One of the factors is that the provincial cities are the main sources of economic activities and services at the provincial and sub-regional level. TM. Nan has numerous tourist attractions and is capable of providing tourism facilities. Also, TM. Nan is the centre of the border town between the northern region of Thailand and Laos. In the case of TM. Nong Khai, there is a border checkpoint between the north-eastern region of Thailand and Laos, producing 59,228,510,432 Baht in import and export value, which was the second-highest in 2019 (Ministry of Interior Citation2019, 10). According to the growth of both provincial cities’ economic roles, the UPC of both provincial cities tends to grow, which is not surprising. The increase of UPC in this cluster is accorded to with the study of Hakim (Citation2016, 39), indicating that the border towns across the Mekong subregion were new emerging urban areas.
4.3.2. Sub-cluster 3B
Sub-cluster 3B has 19 provincial cities. This is the greatest number and makes up 25% of the entire country. They have three major characteristics. First, the number of their populations doesn’t change much. The highest of ACRP value is 0.61, whereas the lowest of ACRP value is −0.82. Second, they are the moderate UPC with the lowest of 15.95 % and the highest of 45.44 %. Third, the economic activities at the province level of almost all provincial cities are based on agricultural activities, except TM. Chachoengsao.
Most of the provincial cities, except TM. Sa Kaeo, are the most populated cities in the provinces. Although there are many small Thesaban in the provinces of this sub-cluster, the population changes are small, with an average rate of −0.06. As a result, the proportion of the changes outside the provincial cities is low, leading to the stability of the UPC level.
4.3.3. Sub-cluster 3C
Sub-cluster 3C consists of 17 members. ACRP and UPC are similar with sub-cluster 3B while the CUPC is slightly lower. Most provincial cities in this sub-cluster are regionally important and are designated as secondary cities. In the political dimension, a secondary city is the centre of a group of provinces. This is one of the factors causing these provincial cities to still be the main urban settlement areas of the provinces. And considering the city hierarchy, the provincial cities in this sub-cluster are different from those in other sub-clusters; most of them are TN.
Although most of the provincial cities are big cities, the city system structure of each province comprises numerous secondary and tertiary Thesaban, such as Nonthaburi Province and Chiang Mai Province (see the detail in Appendix Table A1). It results in a moderate UPC. Moreover, the population grows in the economic areas outside the provincial cities such as manufacturing industry and the mining areas. At the same time, the population in the provincial cities changes slightly, gradually decreasing in the UPC value.
The static urban population change in a big city of Thailand is different from the urban population changes in the past because most of the big cities at that time showed the high rise of population (Sun et al. Citation2020). The change pattern in this group implies that big cities in Thailand are stagnant cities, especially the cities in the group that contains other big cities in the same province.
4.3.4. Sub-cluster 3D
Sub-cluster 3D consists of 13 provincial cities. Like sub-cluster 3B and 3C, their number of populations does not change much, but the value of UPC is very low and gradually decreasing. The reason for this is that city structure comprises many cities in each province like sub-cluster 3C. However, while the provincial cities in sub-cluster 3C are the provincial administration centres, the provincial cities in this sub-cluster are small except TN. Samut Prakan. The population in the provincial cities is not high and there are many cities outside the provincial cities. That is why its proportion of UPC is lower than sub-cluster 3C which contains big cities.
TN. Samut Prakan has such a low UPC value that it was categorised into this sub-cluster instead of sub-cluster 3C which mostly contains big cities because its urban population concentrates in the industrial area which is the economic foundation of the province. Another reason is the population growth in the edge area of the city connecting to Bangkok. The situation is similar to TM. Pathum Thani in sub-cluster 1D except for the patterns of ACRP which is increasing in the case of TM. Pathum Thani while being static with negative trend in the case of TN. Samut Prakan.
4.3.5. Sub-cluster 3E and sub-cluster 3F
Sub-cluster 3E is similar to sub-cluster 3F. They encounter small population changes and are highly populated, making up over 50% of the total urban populations in the province. While UPC of TN.Trang, a member of sub-cluster 3E, changes at the static rate with negative trend, the UPC of the member of sub-cluster 3F changes with the growth rate in the case of TM. Nakhon Nayok and the static rate with the positive trend in the case of TM. Samut Songkhram.
The small number of Thesaban outside provincial cities and the economic structure based on agriculture decreases the concentration of the industrial and commercial areas in other cities and enables the members of both sub-clusters to maintain the ratio of the urban population in the areas and be the centres of the provinces in many aspects ranging from the administration, industry, commerce, transportation and education.
5. Discussion and conclusion
The previous study shows that prior to the 2010s, populations grew dramatically in the urban areas across Thailand, especially in the southern and north-eastern regions (Paudel, Lim, and Dureh Citation2015, 60; Punpuing and Ritcher Citation2017, 113), and across some countries in the Greater Mekong Region (Hakim Citation2016, 37). However, there is little explanation about the decrease of urban population in the provincial cities which is the parallel mode of urbanising city in the case of more developed countries. Gravity law was applied to describe the dense population in Thai city centres like the provincial cities. The density of the population was related to the accessibility to the city amenities located in the provincial cities (Suwanlee and Som-ard Citation2020).
The results demonstrate that during the 2010s, the patterns of distribution and changes in population began to alter. Only seven provincial cities were growing cities, and these provincial cities were not located only in the southern and north-eastern regions but also in the northern region and cities around Bangkok. At the same time, the results from Thai provincial cities confirm that the phenomena of shrinking cities are also the parallel mode of growing city in less developed countries as same as more developed countries. Most of other provincial cities in Thailand were likely to face stable or decreasing population along with the urban concentration decline in many clusters, especially the provinces in the central region.
Regarding this phenomenon, it could not be refuted that although the provincial cities had many public amenities, the patterns of changes in population in the provincial cities were affected by the growth of other cities. These cities were more and more important in economic and social aspects because of the decentralisation process implemented by the government. The effects on the provincial cities were particularly significant when those provincial cities were in the provinces with the economic and industrial activities that could not proceed in the provincial cities, leading them to have a low urban population in some sub-clusters and lose their roles as the urban settlement centres. This pattern of distribution was not in line with the study of Suwanlee and Som-ard (Citation2020). The decrease of UPC reflected the fact that public amenities in the provincial cities were not the only factor in the urban concentration; another factor was the economic agglomeration within and outside the provincial cities. It was in accords with Webster & Gulbrandson (Citation2016, 103), indicating that economic activities such as tourism and industries played a crucial role in supporting the urbanisation of the medium-small cities in Thailand. The economic activities in the urban areas outside the provincial cities caused the areas to grow and attract more settlements, responding to the needs of industries and services (Oontimwong Citation2002, 113; Punpuing and Ritcher Citation2017; Ratniyom Citation2017, 76). These new communities, thus, provided basic public amenities, lessening the importance of the public amenities in the provincial cities. As a result, people did not need to settle in the provincial cities and the vicinities to access the amenities. In addition to the population growth in the industrial areas and the economic activities, the population growth in the outskirt areas was another factor in the decrease of population and the proportion of the urban population in the provincial cities, just as what had happened in more developed countries prior to 2010 due to the suburbanisation (Fol and Cunningham-Sabot Citation2010, 12).
The decreased or low UPC values of most provincial cities indicate that the provincial cities tend to lose their roles as urban settlement centres. Most people immigrate to other cities that are district cities and new economic centres. This phenomenon is different from what happened before the 2010s. At that time, the provincial cities were not only urban settlement centres but also the centres of economic, political and social activities that led to the urbanisation. The current phenomenon caused by the urban population concentration in the new economic centres outside the provincial cities, especially in sub-cluster 2B, is a significant example showing the role of globalisation in the cities at the local scale. The government encourages the economic development and foreign investment by establishing industrial estates and designating new tourist and economic areas in Songkhla, Chon Buri, and Lamphun, resulting in the population and investment shift from the provincial cities – which have the limitation on land uses and sizes – to the new areas. This leads provincial cities to encounter the shrinking city phenomenon. The government support for the industrial development responding to globalisation and resulting in an uneven spatial development is also a significant trigger for the shrinking cities in other countries such as China (Liu, Liu, and Song Citation2020, 9).
In addition, the globalisation triggering the shrinking cities in Thailand is consistent with the study of Fol and Cunningham-Sabot (Citation2010) which indicates that although shrinking city was a phenomenon driven by many factors, nowadays it is undeniable that globalisation plays an important role in the phenomenon worldwide. The globalisation promotes some cities to be developed into the centres of economy, service, information, and communication. The excellent conditions in many aspects will cause the investment shift from one area to another. Attracting private investment and being the source of employment, the new area will become the growing city. At the same time, this development will lead some cities to lose their roles as the economic bases and job sources resulting in the population decline. These cities will end up being shrinking cities.
The decrease of the population in the provincial cities in both quantitative and urban-concentric aspects triggered the urban areas to wilt and their economies shrink, not to mention other consequential problems. Nevertheless, all the policies regarding the administration of the cities of the provinces revealed that the city planning aimed to utilise lands mainly to support the urbanisation as stated in almost every central city plan:
According to ministerial regulations, central city plans … contain policies and measures for the effective usage of lands, transportation networks and public services, ensuring that they can support the urbanisation in the future as well as boost and develop [the] economy …
However, this study reveals that over the past 10 years, 90% of the total provincial cities have encountered a stable and decreasing population, and 48.68% of the total provincial cities have also encountered a decreasing UPC. These changing trends are turning most provincial cities into shrinking cities. Thus, this study proposes that the land-use management based on provincial comprehensive plans of each province, which only focus on the city growth, is not consistent with the present and future situation. This may create problems and destroy the valuable resources of the city (Liu, Liu, and Song Citation2020, 9) affecting the sustainability of the cities. And the wilting day of the ones facing the population declining will come finally, especially when it is predicted that Thailand will have faced the population decline at the national scale by 2050 (Jarzebski et al. Citation2021, 4).
To sustain the provincial city management, the urban planner should not focus merely on supporting population growth. It should also consider the other population trends (Pallagst Citation2010, 3). The study, thus, aims to propose city management approaches based on clusters.
Cluster 1: Responding to the Urbanisation Policy is a cluster containing the provincial cities that encounter population growth. If there is no systematic and cautious land management, the growth will affect the population density and the sufficiency of public utilities and public assistance, resulting in urban sprawl. Not only will the urban sprawl, triggered by the population growth, impact the environment but population overgrowth in the peri-urbans will also lead to a decrease in provincial city population, making the provincial cities eventually deteriorate (Döringer et al. Citation2020, 1964). The planners should develop the policies by applying the compact city framework, which helps control the urban sprawl and manages the cities based on compactness, density, mixed land uses, sustainable transportation, green spaces, and intensification (Bibri, Krogstie, and Kärrholm Citation2020; Yeh and Li Citation2000). The population increase brings the higher demand of land uses The compactness of the cities can help us use urban areas and urban resources effectively (Shi, Yang, and Gao Citation2016). The study of Yao et al. (Citation2022) found that the compactness of large cities will support the agglomeration economy as OECD (Citation2012, 89) stated that the application of the concept of the compact city in urban policy is the main reason why the population growth is higher than the urban land expansion in some areas. This phenomenon reflected the slow rate of the built-up land expansion despite the population growth. Although, the compact city is a global paradigm of sustainable urban development, which has been globally referred to since the 1990s (Bibri, Krogstie, and Kärrholm Citation2020), it has not been formally and widely reinforced, in terms of policy, in city plans of Thailand.
Cluster 2: Provincial City Redevelopment Policy is a cluster of shrinking cities. The decrease is an important factor in shrinking cities, unemployment, housing vacancy and economic decline (Döringer et al. Citation2020, 1701), leading to the vital declination of communities. The provincial comprehensive plans should focus on solving shrinking cities problems by applying core redevelopment (Hartt and Warkentin Citation2017), including the compact city concept (Buhnik Citation2010, 149). This will increase the functions of the original structures of the provincial cities and bring about economic recovery. There are many measures to reinforce the core redevelopment and revitalise the shrinking city. They should be applied based on the condition of cities such as, establishing the substitute industry (Schackmar, Fleschurz, and Pallagst Citation2021), supporting the tourism (Barreira et al. Citation2017; Hartt and Warkentin Citation2017), developing the new urban facilities and services (Guan, He, and Hu Citation2021) and recovering the vacant house to new functions (Campos-Sánchez, Reinoso-Bellido, and Abarca-Álvarez Citation2019). But regarding the limitation of Thai city plans in advancing the large industries in the provincial cities, the core development on the provincial cities should focus on promoting trade and investment by building and improving commercial infrastructure to support the private investment and substitute industry that is suitable for the local context. The investment and substitute industry will create the job opportunities and then attract the new habitants (Barreira et al. Citation2017, 863). Another way is to promote their roles as tourist spots and creatively change cultural capital in the provincial cities into economic advantages. 10 out of 15 provincial cities in this cluster locate old cities with heritage buildings that illustrate the stories and the settlement development in the areas (Kirdsiri et al. Citation2021; Kullapat, Deeudomjant, and Hirunteeyakul Citation2019; Tansukanun Citation2021). These cities can be developed into cultural tourist attractions. The study of Deng, Liu, and Hu (Citation2021) found that despite its ineffectiveness in increasing population, the tourist industry can effectively boost the economic condition and the investment of the cities.
Cluster 3: Maintaining and Balancing their function policy is a cluster facing slight population changes. The provincial comprehensive plan should concentrate on the policies that keep a balance between urbanisation and shrinking cities. The plans should focus on maintaining and supporting the roles of the provincial cities, especially the economic role, to support the economic growth in the cities. This can be done by increasing employment in these areas to slow down the internal migration, which can weaken the provincial cities. At the same time, the areas should be managed to prevent the cities to sprawl into the peri-urbans.
In summary, although the urban population in Thailand over the past decade has grown, most provincial cities which are the core cities at the province scale are stagnant city, shrinking city and growing city, respectively. Like many cities in Europe and the United States, suburbanisation is an important variable that causes the population decline in a city. Other significant variables are the decentralisation policy focusing on the development at the local scale and the economic and industrial development projects of that the government implemented to respond to globalisation. The economic and industrial development outside the provincial cities or in border towns led the urban population to spill out and decreased the urban concentration in the core areas of the provinces. The result was the emergence of shrinking cities, and the only role left for the provincial cities was the public administration. However, it is noteworthy that there are few Thesaban outside the provincial cities in most of the urban areas with the population growth. And these areas can still accumulate economic activities and public facilities due to the geographic conditions and the economic structure in the cities and the provinces.
6. Limitation and direction of future study
This study is the foundation that focuses on the existence of the urban decline hidden in the urbanisation sensation. In general, the population data and the economic data at the local scale which are the important insights about shrinking (Hartt Citation2017) are the limitations worth considering together with the urban change patterns. The example of these data are non-registered population, population structure, migration information and the data about the employment and economy at the micro scale. For the future step, it is also worthy to criticize the in-depth detail of shrinking cities in the terms of the typology, conditioning factors, mechanism and the effect of population decrease.
The focus of this study is the areas within the provincial cities according to the administration border. The study reveals that the population decline and the urban concentration are associated with other urban areas outside the provincial cities. To gain deep insight, it is necessary to also study the relationship of the population patterns at other scale.
To develop the city management policies which can respond to the population decline in each provincial city when the population across the country is likely to decrease, both urban areas and rural areas should be studied to find out about their population change patterns because it is also possible that the population in the latter areas will spill out to the areas with better resources.
Disclosure statement
No potential conflict of interest was reported by the author(s).
Additional information
Notes on contributors
Settawut Bamrungkhul
Settawut Bamrungkhul is currently a Ph.D. student in the Graduate school of Engineering at Hiroshima University. His research focused on the study of human settlement, emphasising the settlement history and urbanisation.
Takahiro Tanaka
Takahiro Tanaka is a Professor at the Hiroshima University. He has a Ph.D. received from the Yokohama National University. His research fields are urban planning, urban environment, urban science, and GIS.
References
- Alves, D., A. P. Barreira, M. H. Guimarães, and T. Panagopoulos. 2016. “Historical Trajectories of Currently Shrinking Portuguese Cities: A Typology of Urban Shrinkage.” Cities 52: 20–29. doi:10.1016/j.cities.2015.11.008.
- Barreira, A. P., J. J. Ramalho, T. Panagopoulos, and M. H. Guimarães. 2017. “Factors Driving the Population Growth and Decline of Portuguese Cities.” Growth and Change 48 (4): 853–868. doi:10.1111/grow.12205.
- Bibri, S. E., J. Krogstie, and M. Kärrholm. 2020. “Compact City Planning and Development: Emerging Practices and Strategies for Achieving the Goals of Sustainability.” Developments in the Built Environment 4: 100021. doi:10.1016/j.dibe.2020.100021.
- Blashfield, R. K. 1976. “Mixture Model Tests of Cluster Analysis: Accuracy of Four Agglomerative Hierarchical Model.” Psychological Bulletin 83 (3): 377–388. doi:10.1037/0033-2909.83.3.377.
- Buhnik, S. 2010. “From Shrinking Cities to Toshi No Shukushō: Identifying Patterns of Urban Shrinkage in the Osaka Metropolitan Area.” Berkeley Planning Journal 23 (1): 132–155. doi:10.5070/BP323111434.
- Campos-Sánchez, F. S., R. Reinoso-Bellido, and F. J. Abarca-Álvarez. 2019. “Sustainable Environmental Strategies for Shrinking Cities Based on Processing Successful Case Studies Facing Decline Using a Decision-Support System.” International Journal of Environmental Research and Public Health 16 (19): 3727. doi:10.3390/ijerph16193727.
- Champion, T. 2001. “Urbanization, Suburbanization, Counterurbanization and Reurbanization.” In Handbook of Urban Studies, edited by R. Paddison. London: SAGE Publications 143–161 . doi:10.4135/9781848608375.n9.
- Cunningham-Sabot, E., and S. Fol. 2007. “Shrinking Cities in France and Great Britain: A Silent Process?” In The Future of Shrinking Cities: Problems, Patterns and Strategies of Urban Transformation in a Global Context, edited by K. Pallagst, J. Aber, I. Audirac, E. Cunningham-Sabot, S. Fol, C. Martinez-Fernandez, S. Moraes, et al. California: University of California 17–26 .
- Cunningham-Sabot, E., I. Audirac, S. Fol, Martinez-Fernandez, C. 2013. “Theoretical Approaches of “Shrinking Cities.” In Shrinking Cities: International Perspectives and Policy Implications, edited by K. Pallagst, T. Wiechmann, and C. Martinez-Fernandez. New York: Routledge 14–30 . doi:10.4324/9780203597255.
- Deng, T., S. Liu, and Y. Hu. 2021. “Can Tourism Help to Revive Shrinking Cities? An Examination of Chinese Case.” Tourism Economics 135481662110022. doi:10.1177/13548166211002295.
- Döringer, S., Y. Uchiyama, M. Penker, and R. Kohsaka. 2020. “A Meta-analysis of Shrinking Cities in Europe and Japan. Towards an Integrative Research Agenda.” European Planning Studies 28 (9): 1693–1712. doi:10.1080/09654313.2019.1604635.
- Dyson, T. 2011. “The Role of the Demographic Transition in the Process of Urbanization.” Population and Development Review 37: 34–54. doi:10.1111/j.1728-4457.2011.00377.x.
- Everitt, B. S., S. Landau, M. Leese, and D. Stahl. 2011. Cluster Analysis. Chichester: John Wiley & Sons.
- Fol, S., and E. Cunningham-Sabot. 2010. “Urban Decline and Shrinking Cities: A Critical Assessment of Approaches to Urban Shrinkage.” Annales de géographie 674 (4): 359–383. doi:10.3917/ag.674.0359.
- Grossmann, K., and A. Mallach. 2021. “The Small City in the Urban System: Complex Pathways of Growth and Decline.” Geografiska Annaler. Series B, Human Geography 103 (3): 169–175. doi:10.1080/04353684.2021.1953280.
- Guan, D., X. He, and X. Hu. 2021. “Quantitative Identification and Evolution Trend Simulation of Shrinking Cities at the County Scale, China.” Sustainable Cities and Society 65: 102611. doi:10.1016/j.scs.2020.102611.
- Hajian Hossein Abadi, M., and A. R. Khavarian-Garmsir. 2021. “Distinct Trajectories of City Growth, City Shrinkage and Development in the Iranian Province of Khuzestan.” Area Development and Policy 7 (1): 1–22. doi:10.1080/23792949.2021.1931381.
- Hakim, J. 2016. “Evolution of Town and Cities in the Greater Mekong Subregion.” In Urban Development in the Greater Mekong Subregion, edited by F. Steinberg and J. Hakim, 1–54, Mandaluyong City, Philippines: Asian Development Bank.
- Hartt, M., and J. Warkentin. 2017. “The Development and Revitalisation of Shrinking Cities: A Twin City Comparison.” Town Planning Review 88 (1): 29–41. doi:10.3828/tpr.2017.4.
- Hartt, M. 2017. “The Diversity of North American Shrinking Cities.” Urban Studies 55 (13): 2946–2959. doi:10.1177/0042098017730013.
- Hattori, K., K. Kaido, and M. Matsuyuki. 2017. “The Development of Urban Shrinkage Discourse and Policy Response in Japan.” Cities 69: 124–132. doi:10.1016/j.cities.2017.02.011.
- Heeringa, I. 2020. “Regional Shrinkage and Planning Policy Change in Europe: The Case of Asturias.” Regional Studies, Regional Science 7 (1): 101–107. doi:10.1080/21681376.2020.1741435.
- Jarzebski, M. P., T. Elmqvist, A. Gasparatos, K. Fukushi, S. Eckersten, D. Haase, J. Goodness, et al. 2021. “Ageing and Population Shrinking: Implications for Sustainability in the Urban Century.” Npj Urban Sustainability 1 (1): 17. doi:10.1038/s42949-021-00023-z.
- Kabisch, N., and D. Haase. 2011. “Diversifying European Agglomerations: Evidence of Urban Population Trends for the 21st Century.” Population, Space and Place 17 (3): 236–253. doi:10.1002/psp.600.
- Khavarian-Garmsir, A. R., A. Pourahmad, H. Hataminejad, and R. Farhoudi. 2018. “A Comparative Assessment of Economic and Physical Inequality between Shrinking and Growing Cities: A Case Study of Khuzestan Province, Iran.” International Journal of Urban Sciences 22 (1): 104–122. doi:10.1080/12265934.2017.1358653.
- Kirdsiri, K., K. Yincharoen, K. Janyaem, I. Buranaut, P. Wongpradit, and S. Roythieng. 2021. “The Old Town Boundary Identification of Uthai Thani and Its Elements.” Silpakorn University Journal 41 (5): 43–56. doi:10.14456/sujthai.2021.36.
- Kullapat, R., C. Deeudomjant, and M. Hirunteeyakul. 2019. “Nakhon Ratchasima: A Study of the Old Town through Its History, Settlement, and Architecture Heritage.” NAJUA History of Architecture and Thai Architecture 16 (1): 62–101.
- Liu, Z., S. Liu, and Y. Song. 2020. “Understanding Urban Shrinkage in China: Developing a multi-dimensional Conceptual Model and Conducting Empirical Examination from 2000 to 2010.” Habitat International 104: 102256. doi:10.1016/j.habitatint.2020.102256.
- Long, Y., and K. Wu. 2016. “Shrinking Cities in a Rapidly Urbanizing China.” Environment and Planning A: Economy and Space 48 (2): 220–222. doi:10.1177/0308518X15621631.
- Long, Y., and S. Gao. 2019. “Shrinking Cities in China: The Overall Profile and Paradox in Planning.” In Shrinking Cities in China: The Other Facet of Urbanization, edited by Y. Long and S. Gao, 3–21. Singapore: Springer. doi:10.1007/978-981-13-2646-2.
- Losiri, C., and M. Nagai. 2020. “Identification of Urban Expansion Patterns in Bangkok Metropolitan Region through Time Series of Landsat Images and Landscape Metrics in S.” In Geoinformatics for Sustainable Development in Asian Cities, edited by Z. L. Monprapussorn, A. Sitthi, and P. Wetchayont. Cham: Springer 32–45 . doi:10.1007/978-3-030-33900-5.
- Mallach, A., A. Haase, and K. Hattori. 2017. “The Shrinking City in Comparative Perspective: Contrasting Dynamics and Responses to Urban Shrinkage.” Cities 69: 102–108. doi:10.1016/j.cities.2016.09.008.
- Martinez-Fernandez, C., I. Audirac, S. Fol, and E. Cunningham-Sabot. 2012. “Shrinking Cities: Urban Challenges of Globalization.” International Journal of Urban and Regional Research 36 (2): 213–225. doi:10.1111/j.1468-2427.2011.01092.x.
- Martinez-Fernandez, C., T. Weyman, S. Fol, I. Audirac, E. Cunningham-Sabot, T. Wiechmann, and H. Yahagi. 2016. “Shrinking Cities in Australia, Japan, Europe and the USA: From a Global Process to Local Policy Responses.” Progress in Planning 105: 1–48. doi:10.1016/j.progress.2014.10.001.
- Merino, F., and M. A. Prats. 2020. “Why Do Some Areas Depopulate? The Role of Economic Factors and Local Governments.” Cities 97: 102506. doi:10.1016/j.cities.2019.102506.
- Ministry of Interior. (2019). “Report on the Statistic of Thailand Migration at the Border Crossings of Thailand and Neighboring Countries.” Foreign Affair Division Office of The Permanent Secretary.
- Moreno-Monroy, A. I., M. Schiavina, and P. Veneri. 2021. “Metropolitan Areas in the World. Delineation and Population Trends.” Journal of Urban Economics 125: 103242. doi:10.1016/j.jue.2020.103242.
- Morrill, R. 2012. “Fifty Years of Population Change in the US 1960–2010.” Cities 29: S29–S40. doi:10.1016/j.cities.2011.11.010.
- National Research Council. 2003. Cities Transformed: Demographic Change and Its Implications in the Developing World. Washington, DC: National Academies Press doi:10.17226/10693.
- National Statistical Office. 2020. The 2019 Migration Survey. Bangkok: National Statistical Office.
- OECD. 2012. Compact City Policies: A Comparative Assessment. Paris: OECD Green Growth Studies, OECD Publishing. doi:10.1787/9789264167865-en.
- OECD. 2020. OECD Regions and Cities at a Glance 2020. Paris: OECD Publishing. doi:10.1787/959d5ba0-en.
- Oke, J. B., Y. M. Aboutaleb, A. Akkinepally, C. L. Azevedo, Y. Han, P. C. Zegras, J. Ferreira, and M. E. Ben-Akiva. 2019. “A Novel Global Urban Typology Framework for Sustainable Mobility Futures.” Environmental Research Letters 14 (9): 095006. doi:10.1088/1748-9326/ab22c7.
- Omurbek, N., O. Akcakaya, and E. D. U. Akcakaya. 2021. “Integrating Cluster Analysis with MCDM Methods for the Evaluation of Local Agricultural Production.” Croatian Operational Research Review 12 (2): 105–117. doi:10.17535/crorr.2021.0009.
- Oontimwong, P. 2002. “Urbanization in the Countryside: A Note on Thailand.” Journal of Liberal Arts, Thammasat University 2 (2): 24–31.
- Oswalt, P. 2008. “Shrinking Cities.” In Shrinking Cities: Complete Works 3 Japan, edited by P. Oswalt. Berlin: Project Office Philipp Oswalt 3–16 .
- Pallagst, K. 2010. “Viewpoint: The Planning Research Agenda: Shrinking Cities — A Challenge for Planning Cultures.” The Town Planning Review 81 (5): i–vi. doi:10.3828/tpr.2010.22.
- Park, Y., and M. E. Heim Lafrombois. 2019. “Planning for Growth in Depopulating Cities: An Analysis of Population Projections and Population Change in Depopulating and Populating US Cities.” Cities 90: 237–248. doi:10.1016/j.cities.2019.02.016.
- Paudel, B., A. Lim, and N. Dureh. 2015. “Population Distribution Pattern of 76 Provinces in Thailand: Application of Factor Analysis.” Asian Social Science 11 (12): 55–61. doi:10.5539/ass.v11n12p55.
- Peterson, E. W. F. 2017. “The Role of Population in Economic Growth.” SAGE Open 7 (4): 2158244017736094. doi:10.1177/2158244017736094.
- Punpuing, S., and K. Ritcher. 2017. “Urbanization and Migration Impact.” In Impact of Demographic Change in Thailand, edited by G. Jones and W. Im-em, 99–113, Bangkok: United Nations Population Fund.
- Ratniyom, A. 2017. “Migration on the Path of Thailand Industrial Development.” Economics and Public Policy Journal 8 (16): 67–84.
- Restrepo Cadavid, P., G. Cineas, L. E. Quintero, and S. Zhukova. 2017. Cities in Europe and Central Asia: A Shifting Story of Urban Growth and Decline. Washington, DC: World Bank Group.
- Rogerson, P. A. 2010. Statistical Methods for Geography: A Student’s Guide. 3rd ed. Los Angeles: SAGE.
- Salazar, R. C., M. Pallares-Barbera, and A. Vera. 2020. “Spatial Inequality in Ecuador: A Structural Gap Approach.” In Urban and Regional Planning and Development, edited by R. Thakur, A. Dutt, S. Thakur, and G. Pomeroy. Cham: Springer 139–154 . doi:10.1007/978-3-030-31776-8_9.
- Schackmar, J., R. Fleschurz, and K. Pallagst. 2021. “The Role of Substitute Industries for Revitalizing Shrinking Cities.” Sustainability 13 (16): 9250. doi:10.3390/su13169250.
- Shi, L., S. Yang, and L. Gao. 2016. “Effects of a Compact City on Urban Resources and Environment.” Journal of Urban Planning and Development 142 (4): 05016002. doi:10.1061/(ASCE)UP.1943-5444.0000324.
- Sun, L., J. Chen, Q. Li, and D. Huang. 2020. “Dramatic Uneven Urbanization of Large Cities Throughout the World in Recent Decades.” Nature Communications 11 (1): 5366. doi:10.1038/s41467-020-19158-1.
- Suwanlee, S. R., and J. Som-ard. 2020. “Spatial Interaction Effect of Population Density Patterns in Sub-Districts of Northeastern Thailand.” ISPRS International Journal of Geo-Information 9 (9): 556. doi:10.3390/ijgi9090556.
- Tansukanun, P. 2021. “The Conservation Urgency of the Valuable Architecture on the Lamphun Old Town’s Main Streets.” Journal of Environmental Design 8 (2): 2–25.
- Tong, Y., W. Liu, C. Li, J. Zhang, Z. Ma, and B. Xue. 2020. “Small Towns Shrinkage in the Jilin Province: A Comparison between China and Developed Countries.” PLOS ONE 15 (4): e0231159. doi:10.1371/journal.pone.0231159.
- Tontisirin, N., and S. Anantsuksomsri. 2021. “Economic Development Policies and Land Use Changes in Thailand: From the Eastern Seaboard to the Eastern Economic Corridor.” Sustainability 13 (11): 6153. doi:10.3390/su13116153.
- Turok, I., and V. Mykhnenko. 2007. “The Trajectories of European Cities, 1960–2005.” Cities 24 (3): 165–182. doi:10.1016/j.cities.2007.01.007.
- United Nations. 2019. World Urbanization Prospects: The 2018 Revision (ST/ESA/SER.A/420). New York: United Nations.
- U.S. Census Bureau. (2020). “Cumulative Estimates of Resident Population Change for Incorporated Places of 50,000 or More in 2010, Ranked by Percent Change: April 1, 2010 to July 1, 2019 (SUB-IP-EST2019-CUMCH).”
- Wang, J., Z. Yang, and X. Qian. 2020. “Driving Factors of Urban Shrinkage: Examining the Role of Local Industrial Diversity.” Cities 99: 102646. doi:10.1016/j.cities.2020.102646.
- Webster, D., and A. Gulbrandson. 2016. “The Role of Cities and Connectivities in Promoting Regional Intergration and Competitiveness.” In Urban Development in the Greater Mekong Subregion, edited by F. Steinberg and J. Hakim, 55–139, Mandaluyong City, Philippines: Asian Development Bank.
- Wiechmann, T., and M. Wolff. 2013. Urban Shrinkage in a Spatial Perspective – Operationalization of Shrinking Cities in Europe 1990–2010. Dublin: AESOP-ACSP Joint Congress.
- Yao, Y., H. Pan, X. Cui, and Z. Wang. 2022. “Do Compact Cities Have Higher Efficiencies of Agglomeration Economies? A Dynamic Panel Model with Compactness Indicators.” Land Use Policy 115: 106005. doi:10.1016/j.landusepol.2022.106005.
- Yeh, A., and X. Li. 2000. “The Need for Compact Development in the Fast-Growing Areas of China: The Pearl River Delta.” In Compact Cities: Sustainable Urban Forms for Developing Countries, edited by M. Jenks and R. Burgess, 73–90, London and New York: Spon Press.
Appendix
Table A1. Information about the population and supplementary data of the provincial cities.
Table