
ABSTRACT
Repetitive and severe thermal loads and load changes affect not only the physical properties of the coke drum but also its dynamic properties, possibly leading to structural failure. In particular, the operation weight of the drum, which increases up to 10 times or more, affects the dynamic properties of the structure and may threaten safety. Therefore, a vibration safety evaluation model for coke drums in operation is proposed to provide critical feedback on damage accumulation and to evaluate the vibration stability. A monitoring system was also developed to validate the model predictions by measuring the vibration patterns and corresponding modal parameters of the coke drums in operation. The proposed technique was applied to two coke drums in operation, and the vibration safety and factors causing vibration in the target structures were analyzed. The maximum vibration pattern was observed in the target structures at a feeding ratio of 71%. It exceeded the vibration criteria of the vibration safety evaluation model by up to 406%. Moreover, the analysis determined that the rapid increase in operating weight of the coke drums due to the influx of heavy crude oil, and the down-shift in their mode frequency induced superimposition and resonance with the structural mode, causing vibration.
1. Introduction
Pyrolysis of heavy crude oil (HCO) is the process of converting petroleum residuum, obtained from processing crude oil, into light crude oils (LCO) such as LPG, gasoline, kerosene, and diesel using high heat and pressure. HCO is pyrolyzed at high temperatures and pressure in the coke drums. To maintain continuous operation, processes such as cooling, drain, cutting, warming up, and feeding are repeated at regular intervals, causing the internal temperature of the coke drums to rise and fall repeatedly, over a range of 400–500 °C (Engery Information Administration Citation2021; Penso et al. Citation1999; Oka et al. Citation2011). This introduces severe thermal and mechanical loading during operation, leading to low cycle fatigue, expansion, and cracking (Yan et al. Citation2015; Chen and Xia Citation2014a). Since the safety of coke drums is critical to the industry, preventing structural failure of coke drums is a high priority issue.
For this reason, several studies on structure, design, and performance improvement have been conducted (Yan et al. Citation2015; Chen and Xia Citation2014a; Penso et al. Citation2000, Citation1999; Dong, Guo, and Gao Citation2015; Chen and Xia Citation2014b). Several researchers have specifically studied the change in the physical properties of coke drums due to a large temperature change during pyrolysis of HCO. Oka et al. (Citation2011) analyzed the temperature and stress characteristics of coke drums and the effect of the fluctuating temperature on the thermal fatigue life of the junction area. Operational temperatures and strains of four coke drums were measured and the most severely affected location in the junction area was analyzed using the finite element (FE) method. Li et al. (Citation2012) conjectured that the high-temperature low cycle fatigue failure of the welding joint between the drum body and the skirt significantly affected the life of coke drums. Accordingly, a high temperature fatigue test was performed on the weld joint to predict the life of coke drums and the time required for fatigue cracks to occur. Xia, Ju, and Du Plessis (Citation2010) numerically analyzed the stress and temperature of coke drums for a complete process cycle using the FE method. Zhang and Xia (Citation2015). proposed the simplified theoretical model (STM) as a time- and cost-saving analysis tool, instead of the FE method, for analyzing the elastic-plastic behavior of coke drums, including global and local (hot and cold spot) stress distribution. For the same input data, the stress and strain values of the coke drums obtained using the proposed STM were consistent with those obtained using the FE analysis.
However, repetitive thermal loads and load changes affect not only the physical properties but also the dynamic properties of the structure. As the mass of HCO supplied in the feeding process during HCO cracking is considerably larger than that of the coke drums themselves, the coke drums and the structure experience a sudden change in load. For instance, the actual operating weight of the coke drums used in this study was about 10.16 times their own weight. Therefore, despite being structurally safe in the non-operating state, the coke drums cannot be considered safe in operation, as dynamic characteristics such as modal parameters fluctuate due to sudden changes in load. Moreover, a corresponding change in the mode frequency of the coke drums during operation, could lead to an overlap with a specific frequency of the feeding process or that of the supporting structure and, subsequently, critical structural failure. Therefore, effective safety evaluation requires a monitoring system that analyzes the dynamic structural characteristics of the coke drums in operation.
Over the past few decades, monitoring techniques to understand the dynamic characteristics of structures have been studied under the name of structural health monitoring (SHM) in the civil-engineering field. In SHM, structure responses such as acceleration, displacement, strain, and incline are measured using various types of sensors, and the safety and performance of structures are reviewed through measurement (Jin and Jung Citation2018; Park and Oh Citation2018; Shang and Shen Citation2018; Umar, Vafaei, and Alih Citation2021). In several studies, SHM has been applied to civil structures and infrastructure, including bridges and buildings (Oh et al. Citation2020; Annamdas, Bhalla, and Soh Citation2017; Kim et al. Citation2019; Riveiro, DeJong, and Conde Citation2016; Chae et al. Citation2012). Studies concerned with real-time SHM have especially been conducted to track the dynamic properties of structures that undergo a change in real time (Park and Oh Citation2018; Guo et al. Citation2018; Qarib and Adeli Citation2016; Yun et al. Citation2021). Thus, SHM can be useful in studying the structural safety of coke drums, which are vulnerable to unexpected damage due to rapid and excessive load changes. However, studies that continuously monitor coke drums for a long time and conduct real-time safety estimation are limited. Furthermore, unlike buildings or bridge structures to which SHM has been generally applied, for coke drums in operation, the state of the structure such as vibration, weight, temperature, and pressure rapidly changes within a short period of time, and thus, monitoring and safety estimation requires more attention.
Therefore, this study proposes a vibration safety evaluation model that analyzes the dynamic characteristics of coke drums in operation and a sensor network-based monitoring system for the analysis. The proposed monitoring system can measure the responses (acceleration, velocity, displacement, etc.) of the coke drums in operation and the supporting structure using various types of sensors (accelerometer, speedometer, displacement meter, etc.), and the vibration safety evaluation model can continuously evaluate vibration safety for the repetitive and excessive loads affecting the entire structure in all operating processes. To evaluate the vibration safety of the structure, the dynamic properties, such as the modal parameters, of the structure were extracted through the output-only modal analysis (OMA) method, which is commonly used in SHM (Park and Oh Citation2018; Shang and Shen Citation2018; Annamdas, Bhalla, and Soh Citation2017; Qarib and Adeli Citation2016; Yun et al. Citation2021; Magalhães, Cunha, and Caetano Citation2012), followed by FE analysis for verification. The monitoring system and safety evaluation model were applied to two real coke drums in operation to analyze the vibration problem of structure and review its applicability.
2. Monitoring system for vibration safety analysis
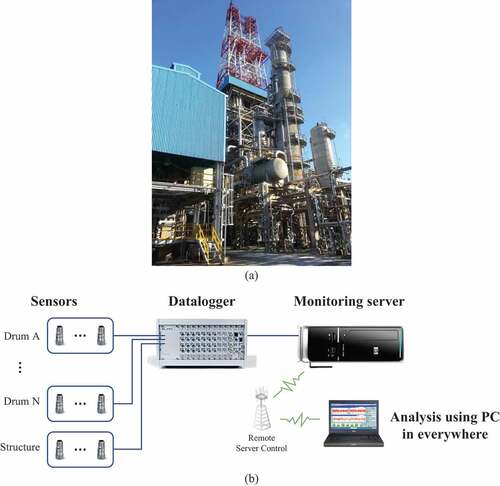
To understand the change in the dynamic characteristics of the coke drums and to evaluate the vibration safety for all operating processes in the operating state, the schematic diagram of the proposed monitoring system is presented in . As shown in , the operation of the system affects not only the coke drums but also the supporting structure due to a number of factors (rapid change in load due to the mass of HCO supplied in the feed process, change in external environment such as temperature and wind load, etc.). Considering this, sensors (accelerometers, velocity meters, displacement meters, etc.) are attached to both the coke drums and the supporting structure. The response data of the measured structure is stored and analyzed on the monitoring server located on site, and the administrator can analyze and control it remotely and in real time.
Figure 1. (a) Coke drums in operation used in this study, and (b) Schematic diagram of the proposed monitoring system for vibration safety evaluation model.
Through the monitoring system, the vibration safety evaluation model evaluates the vibration safety of the coke drums and the supporting structure as shown in . If they are structurally unsafe, it analyzes the source of vibration. This process can be largely classified into three parts, as shown in : part A, in which the vibration response of the structure is measured, part B, in which the vibration safety of the structure is evaluated, and part C, in which the source of vibration is analyzed. In part A, a field survey is conducted to measure the vibration response of the target coke drums and the structure, based on which, the type and location of the sensor for measurement and the measurement period are determined. Since most vibration and safety evaluations of infrastructure such as coke drums are specified based on speed or displacement, the acceleration response of the structure is reconstructed into velocity and displacement in part B. The vibration safety of the structure is evaluated by applying these to the vibration criteria. If the structure is judged to be safe through vibration evaluation, the analysis is complete. However, if it is judged to be unsafe, the source of vibration is analyzed in part C. Here, it is first identified at which stage the coke drums and structures exhibit the most critical response based on the time history trend of the structure response. Following this, the source of vibration is analyzed with focus on two major variables. One is the environmental influence variable, such as temperature and wind speed; the other is the change in the dynamic properties of the structure corresponding to the stage, including the change in mass and temperature of the coke drums. The change in dynamic structural properties can be analyzed using a frequency spectrum. In this study, an output-only modal analysis (OMA) technique was used. This is an SHM technique, widely used to understand the dynamic properties of structures (Park and Oh Citation2018; Shang and Shen Citation2018; Annamdas, Bhalla, and Soh Citation2017; Qarib and Adeli Citation2016; Yun et al. Citation2021; Magalhães, Cunha, and Caetano Citation2012). Post evaluation of the influencing variables, the vibration safety evaluation model is terminated, with the identification of the source of vibration for the coke drums and the structure.
Figure 2. Vibration safety evaluation model for coke drums using the proposed monitoring system.
3. Application
3.1. Target structure
The proposed vibration safety evaluation model and sensor network-based monitoring system were applied to two actual coke drums in operation. A photograph of the target structure is shown in , and the main dimensions of the section are shown in . Both the coke drums A and B have a total height of 35.14 m and a diameter of 8.25 m; the height of the skirts where the drums meet the structure is 7.59 m. For the study, the HCO feeding method was changed from the existing bottom feeding method to the side feeding method for the purposes of safety and convenience. However, a large vibration previously absent from the structure was reported during the operation after changing the feeding method.
Figure 3. The main dimensions of the target coke drums.
The process is repeated alternately in the two coke drums A and B because removing the large amount of solid coke generated during HCO pyrolysis in the reactor is time-intensive. The operation cycle of the target coke drums is shown in . The entire cycle for the two coke drums to perform the process alternately takes 28 hours, and the feeding process for one coke drum takes 14 hours. Drum A undergoes warming-up to increase the drum temperature for pyrolysis prior to the feeding process. Following this, the coke drum is fed for 14 hours, increasing its weight from 233 t to its maximum operating weight of 2,368 t while the temperature rises to 480°C. It is distinctly possible that this large change in mass will structurally affect the dynamic properties of the coke drums and the structure. While Drum A cracks HCO during the feeding process to produce petroleum coke, Drum B undergoes cooling, draining, cutting, and warming-up processes for the next feeding. When the feeding process in drum A is completed, the identical feeding process commences in drum B. Simultaneously, drum A goes through cooling, draining, cutting, and warming-up processes. In a single operating cycle of 28 hours, drums A and B each complete the feeding process once, and the HCO cracking cycle is repeated continuously.
Table 1. 1 Cyclical process of coke drums A and B.
3.2. Design of the monitoring system
Accelerometers were installed to analyze the horizontal vibration of the corresponding coke drums and structures, and to determine the measurement location. shows their photographs. In the target coke drums, the periodic process is repeated nonstop in the operation state. To this end, the sensor locations were selected in consideration of the safety of the installer and the ease of maintenance. The accelerometers were attached to a total of six points: one each on the upper part of drum A (labeled DA01) and B (labeled DB01) and the structure (labeled STR01) where maximum displacement was expected to occur; one each in the structure (labeled STR02) and drum B (labeled DB02) at the height where the coke drums and the supporting structure were connected; and one at the bottom of drum B (labeled DB03) which was the position where heavy oil is fed into the drum. The accelerometer, PCB 603C01, was a single-axis accelerometer from PCB Piezotronics, the detailed specifications for which are presented in . Since they were single-axis accelerometers, twelve accelerometers were used to measure the X and Y directions, simultaneously, at each point. It should be noted that the measurement location and the number for the design of the monitoring system may vary depending on the characteristics of the target structure.
Figure 4. Sensor installation locations and photographs.
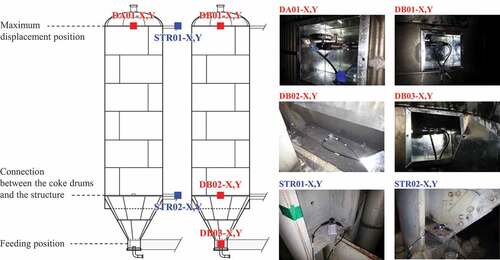
Table 2. Specifications of the measurement equipment used in this study.
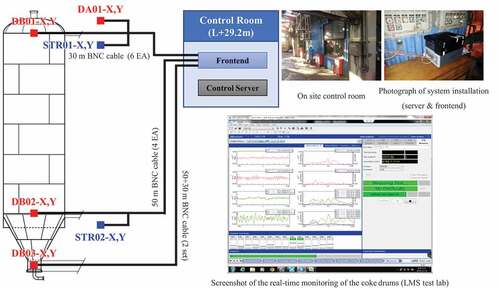
shows a wiring diagram of the accelerometer, a photograph of the control room and system installation on site, and a real-time monitoring screen for vibration safety of coke drums using the accelerometers. The accelerometer was wired to the datalogger of the monitoring server in the on-site control room using a Bayonet Neill–Concelman (BNC) cable. Six BNC cables with a length of 30 m, four BNC cables with a length of 50 m, and two BNC cables with a length of 80 m (50 m + 30 m) were used, and in this study, there was little noise or safety change in data due to the difference in the length of the cables used. The datalogger used here was Scada III 310 by SIEMENS; its detailed specifications are presented in . The LMS test lab of SIEMENS was used for real-time monitoring analysis and checking for sensor and data abnormalities. In order to secure the reliability of the measured data and reduce the aliasing and spectral leakage, a sampling rate considering the Nyquist frequency and a sufficiently long measurement time are required. In general, it has been reported that the extraction of modal parameters becomes more stable and accurate with increasing the sampling rate and measurement time (Yun et al. Citation2021). In consideration of these points, the horizontal vibration of the coke drums and the structure was measured for a total of 30 days at a sampling rate of 512 Hz, and data were collected for approximately 25 cycles.
Figure 5. Wiring diagram of the monitoring system; pictures of the control room, and monitoring screen.
4. Vibration safety evaluation model and results
4.1. Vibration criteria analysis
shows the X- and Y-direction displacement root mean square (RMS) obtained at the top of each coke drum for 20 cycles. The displacement RMS of the coke drums was analyzed to determine whether the maximum value was different for every cycle, but a similar pattern was observed repeatedly. To illustrate this, the upper Y-direction displacement RMS of the coke drums for one cycle is shown in , along with the vibration pattern for each process of the coke drums in operation. The displacement response was found to be similar for both drums A and B throughout the process. The vibration of the coke drums gradually increased until the feeding process was approximately 70% complete, where it reached its maximum. Thereafter, it decreased, but increased again after reaching a feeding ratio of approximately 90%. Afterwards, during the cooling and draining processes, the vibration of the coke drums increased gradually. However, vibration levels did not reach those of the feeding stage. A consistent vibration was observed in the cutting process, and the lowest vibration was measured, on average, in the warm-up process. A pattern was observed for all measured cycles as shown in , with only the maximum values being different.
Figure 6. Upper displacement RMS of each coke drum for 20 cycles: (a) X-direction, (b) Y-direction.
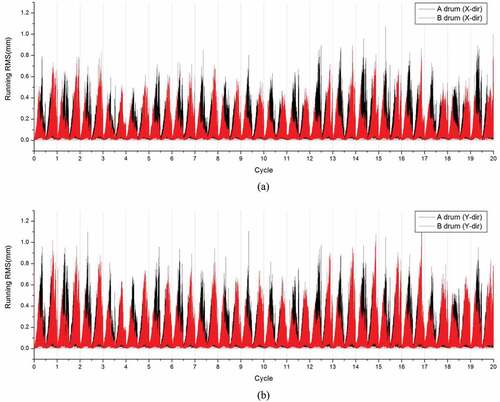
Figure 7. Upper Y-direction displacement RMS of each coke drum during one cycle: (a) coke drum A, (b) coke drum B.
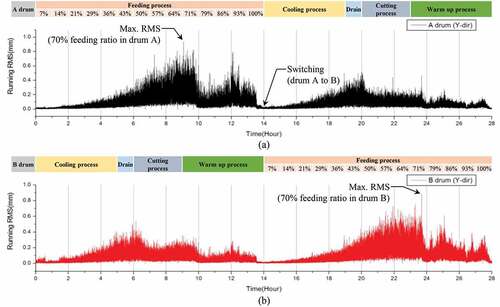
Since the coke drums exhibited the maximum displacement RMS value at approximately 70% through the feeding process, there is a distinct possibility of vibration safety issues at this stage of the process. Therefore, the vibration safety of coke drums A and B and the structure were evaluated in this interval. The results are shown in . DIN 4150–3 (Deutsches Institut für Normung Citation1999) was the vibration criteria used to evaluate the vibration safety of structures; DIN 4150 is considered to be conservative compared to other vibration criteria for buildings in good condition (Amick and Gendreau, Citation2000). DIN 4150–3 sets a maximum value of 5 mm/sec as a criterion for the velocity of vibration in the horizontal direction for vibration safety of infrastructure. On evaluating the vibration safety of the entire structure at a feeding ratio of approximately 70% in coke drum B the following observations were made: the overall vibration speed was larger in the Y-direction than in the X-direction, as shown in ; furthermore, the coke drums did not satisfy the vibration criteria, at any of the measurement locations. It exceeded the criteria by a maximum of 406% in drum B, which was in the feeding process, by a maximum of 226% in the structure, and by a maximum of 182% in drum A, which was in the warm-up process. Therefore, at a feeding ratio of 70%, the target structure was judged to be unsafe for vibration, and environmental and system influence variables were evaluated to determine the cause of vibration.
Table 3. Vibration safety evaluation according to screening criteria (5 mm/s) (when the feeding ratio was 70% in coke drum B).
4.2. Evaluation of environmental and system influence variables
To examine whether the vibration pattern of the coke drums and structure was affected by external environmental factors, the displacement of the coke drum for 20 cycles (approximately 28 days) was compared to the local temperature and average wind speed for the same duration, as shown in .The average ambient temperature and 10-minute average wind speed data provided by the Seosan Meteorological Observatory of South Korea (Korea Meteorological Administration Citation2021) were used as the local temperature and average wind speed data, shown in ). shows the uppermost Y-direction displacement data of drum A. The analysis showed that the environmental influence variables did not have a consistent correlation with the vibration of the coke drums and the structure. Since the internal temperature of the coke drums was kept constant at approximately 400 °C during feeding through the warm-up and cooling processes, it was not the primary cause of the change in vibration during the process (Xia, Ju, and Du Plessis Citation2010).
Figure 8. Environmental influence variables: (a) local temperature, (b) average wind speed, (c) displacement RMS of coke drum A (upper, Y-direction).
The vibration pattern of the target structure exhibits an increase in a specific process. The increase in vibration at the 70% feeding ratio probably indicates structural issues. These include resonance problems caused by changing dynamic characteristics following an increase in the operating weight during this interval. Accordingly, the frequency characteristics of the structure were analyzed for each feeding ratio during the feeding process, for which the OMA technique was used. This is a technique for estimating modal parameters such mode frequency, mode shape, and modal damping, which are dynamic characteristics of a structure, using only the response of the structure. It has been widely used in studies such as system identification and model updating using monitoring systems in the civil-engineering field (Park and Oh Citation2018; Shang and Shen Citation2018; Yun et al. Citation2021; Magalhães, Cunha, and Caetano Citation2012; Park, Kim, and Oh Citation2019). In this study, frequency analysis was performed through power spectral density (PSD) spectrum by auto-correlation of acceleration data obtained from the upper Y-direction of coke drums A and B.
shows the averaged spectrum graph of coke drums A and B during 0.5 cycles (14 hours), i.e., during the feeding process of coke drum A at one-hour intervals. The graph proceeds, in chronological order, from the upper left to the lower right; the percentile in blue indicates the feeding ratio of the coke drum A. At this time, the coke drum B is undergoing the processes of cooling, draining, cutting, and warming-up. shows that the maximum response value was observed when the feeding ratio of drum A was approximately 71%. This result validated the prediction that the biggest vibration problem would occur at an approximate feeding ratio of 70%, based on the chronological displacement graph of the coke drum.
Figure 9. The averaged spectrum graph of coke drums in the feeding process of drum A at one-hour intervals.
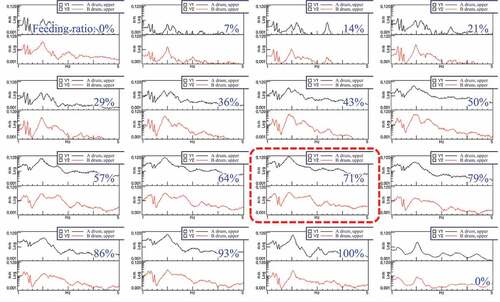
Despite a slight difference for each feeding ratio, three mode frequencies that fell consistently in the range 1.2–1.5 Hz (1.250 Hz, 1.375 Hz, and 1.488 Hz) were observed in the averaged spectrum graph of coke drums A and B. In drum A during the feeding process, two mode frequencies in the range 1.85–2.2 Hz were identified. These two mode frequencies were separated from each other at the beginning of the feeding process (when the feeding ratio was 0%). As feeding progressed, the two mode frequencies gradually shifted, narrowing the distance between them. In addition, in the section where the feeding ratio was about 57% or more, the distance became extremely small, with the mode frequencies overlapping like a single mode frequency. Such a superimposition of mode frequencies causes resonance, resulting in the vibration value reaching the maximum in the interval where the feeding ratio was about 71%.
4.3. Identification of the source of vibration
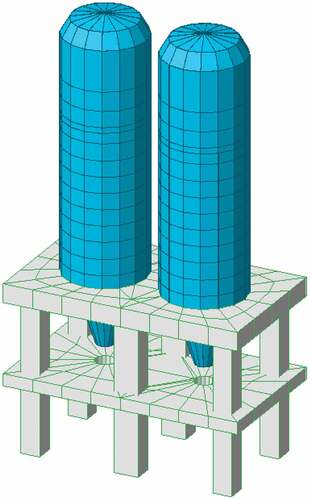
As mentioned in section 3.2, the target coke drums had a limited installation location of the sensor, and thus, it was difficult to determine the response of the structure with only the frequency spectrum obtained by measurement. Therefore, to examine this shift of mode frequencies more precisely, FE analysis was performed by modeling coke drums as shown in , using the MIDAS software. MIDAS software has been used in many studies in the field of civil engineering to model structures in 3D and to numerically acquire the responses of structures (Lin et al. Citation2017; Aasim et al. Citation2020). Moreover, it provides material properties based on the standards of Korean Standard (Korean Standard Citation2016) and Korean Concrete Institute (Korean Concrete Institute Citation2012). Therefore, in this study, initial modeling of the target drums was performed with C24 reinforced concrete and SS400 steel based on this. However, since the target structure is judged to have a vibration problem in which mode frequencies are superimposed, frequency tuning was carried out using the model updating technique for more precise results. The model updating technique (Park, Kim, and Oh Citation2019) used is a method based on modal participation ratio with Young’s modulus and density of materials as parameters. Although damping has a great influence on the amplitude in the resonance of the frequency spectrum, it may not be important for the peak frequency itself (Presas et al. Citation2017) and is likely to increase errors in the results (Wu et al. Citation2020). Therefore, according to the purpose of modeling, damping was not considered as a parameter. The unit weight of concrete and steel finally used is 23.54 kN/m3 and 76.98 kN/m3, respectively, and Young’s modulus of concrete and steel is 29.984 GPa and 205.0 GP, respectively. The Poisson’s ratio of concrete and steel is 0.20 and 0.25, respectively, and the damping ratio of concrete and steel was fixed at 0.05 and 0.02. Four-node plate elements were used (for drums consisting of steel and RC slabs of the structure supporting it). And the pillars of the structure were modeled with beam elements. Finally, the 3D FE model of target coke drums contains a total of 848 nodes and 12 beam elements, and 830 plate elements. Live load including dead load and operation load related to the feeding process was used as the computational load to obtain its structural response. Meanwhile, it should be noted that the FE model of this study is limitedly configured for the analysis of vibration sources related to the vibration safety of the structure. Unlike the application of this study, if sufficient measurement locations and the number of sensors are guaranteed to obtain the response of the structure, FE analysis may not be essential to analyze the vibration source.
Figure 10. The FE model of coke drums.
shows the experimental data alongside each mode frequency extracted from the FE model. Since the feeding mode occurs from the automated feeding valve, the mode frequency extracted from the experimental data was assumed to be the actual value and applied to the FE model. The maximum error of mode frequencies obtained from the two methods except for the feeding mode is about 7.0%.
Table 4. Comparison of the mode frequencies extracted from the experimental data and the mode frequencies calculated by FE model in 14% feeding process.
The FE analysis confirmed that the three mode frequencies that were consistent in the range 1.2–1.5 Hz were the mode frequencies of the structure; the mode frequencies in the range 1.85–2.2 Hz were identified to be those of the feeding and coke drum modes, as specified in . As the target coke drums used an automated side feeding method for the feeding process, the feeding mode stabilizes automatically as the feeding valve supplies HCO. shows the averaged spectrum graph of coke drum A in the feeding process when the feeding ratio reaches 14%, 43%, and 71%, respectively. The changes in the structure, feeding, and coke drum modes with an increase in the feeding ratio are indicated by blue circles and arrows, and the detailed values are summarized in . The structure mode frequency was almost consistent as its own weight was much larger than that of coke drums or fed HCO. During feeding from 14% to 71%, it was down-shifted by approximately 0.012 to 0.087 Hz. The feeding mode frequency was also consistent at 1.875 Hz in the section after the feeding ratio reached 30%, as it was stabilized by the operation of the feeding valve. In contrast, the mode frequency of the coke drum was down-shifted gradually as the feeding process progressed. The mode frequency of the coke drum was 2.188 Hz at a feeding ratio of 14%, 2.113 Hz at a feeding ratio of 43%, and 1.8575 Hz at a feeding ratio of 71%. The coke drum mode frequency was greatly affected by the feeding ratio as the operating weight of the coke drum increased drastically during HCO feeding to a maximum of 2,368 t, which is approximately 1016.31% of the weight of the coke drum itself (233 t). With an increase in the feeding ratio, the mode frequency of the coke drum was down-shifted to 1.8575 Hz when the feeding ratio reached about 71%. The down-shifted mode of the coke drum eventually overlaps with the feeding mode, which remained consistent at 1.8575 Hz.
Table 5. The change in each mode frequency according to the increase in the feeding ratio.
Figure 11. Averaged spectrum graph of coke drum A and changes in structure, feeding, and coke drum mode: feeding ratio (a) 14%, (b) 43%, (c) 71%.
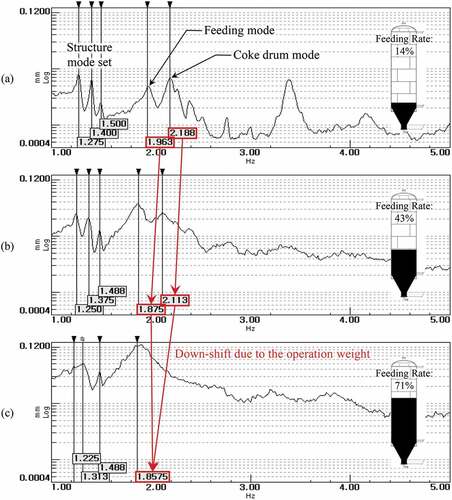
This result suggested that the main cause of the vibration in the target coke drums was the resonance phenomenon caused by the superimposition of the coke drum and the feeding modes. The two modes were separated from each other during all the processes except the feeding process. At the feeding ratio of 14%, the feeding mode frequency was 1.963 Hz and the mode frequency of the coke drum was 2.188 Hz, and they were separated from each other, as shown in the average spectrum. As the feeding ratio increased, the feeding mode frequency was initially down-shifted and finally stabilized at 1.8575 Hz. The mode frequency of the coke drum, however, was continuously down-shifted to approach the feeding mode frequency, and the structure resonated as the two mode frequencies overlapped at 1.8575 Hz in the section where the feeding ratio reached approximately 71%. At this stage, there was a vibration safety issue as the coke drums exceeded the vibration criteria by up to 406%. Therefore, based on the results obtained using the evaluation and monitoring technique proposed in this study, measures to ensure vibration safety are required. Although this study does not deal with methods for solving vibration sources, future work may be performed for this additionally. In future work, concrete or steel reinforcement of support structures, dampers for controlling relative displacement, and optimization of their performance, location, and number can be investigated.
5. Conclusions
Coke drums experience repeated thermal loads and load changes during the operating period, and these cyclical loads can change not only the physical properties but also the dynamic properties of the structure. Since the weight of the coke drums supplied with HCO, during operation, increases to several times their own weight, a change in the dynamic mode frequency of the structure can occur, which is detrimental to the vibration safety of the structure. Therefore, this study proposed a vibration safety evaluation model for coke drums in operation and a sensor network-based monitoring system for measurement. Since the proposed monitoring system and vibration safety evaluation model continuously evaluated the vibration safety throughout the operating cycle of the coke drums, it was possible to identify and analyze vibration safety problems for each operating process. The proposed monitoring system was applied to two actual coke drums in operation, and a total of 25 cycles of data were collected for approximately 30 days. Vibration safety and the cause of vibration in target coke drums were analyzed using the proposed vibration safety evaluation model.
Based on the analysis results, the target structure did not satisfy the evaluation criteria of the vibration safety evaluation model at a feeding ratio of approximately 71%, exceeding the criteria by up to 406%. The analysis of the dynamic characteristics of the structure showed that the weight of HCO fed could affect the dynamic structural characteristics, causing new vibration-related problems absent in other processes. Since the operating weight of the target coke drums reached about 10.16 times the weight of the coke drums themselves, the mode frequency of the coke drums in the feeding process was down-shifted as feeding progressed. This down-shifted mode frequency of coke drums overlapped with the feeding mode at a feeding ratio of 71 %, causing a resonance phenomenon, due to which vibration increased rapidly. It is notable that the down-shifted mode frequency due to the increase in the operation mass of the drums may superimpose with feeding mode frequency or structure mode frequencies, causing vibration problems. In this manner, the requirement and applicability of the vibration safety evaluation model for coke drums in operation and the sensor network-based monitoring system proposed in this study were verified.
Disclosure statement
No potential conflict of interest was reported by the author(s).
Additional information
Funding
Notes on contributors
Jewoo Choi
Jewoo Choi is a PhD candidate at the Department of Architectural Engineering, Yonsei University, Seoul, Korea. He received the BS and MS degrees in architectural engineering from Yonsei University, Seoul, Korea, in 2018 and 2020, respectively. His research interests include structural health monitoring, optimal structural design, vibration control with acoustic metamaterials, and AI-based structural response estimation.
Deok Shin Kang
Deok Shin Kang is currently a senior researcher at Hyundai Engineering & Construction, Seoul, Korea. His research interests include structural health monitoring, structural analysis and design, and vibration control.
Min Gyu Lee
Min Gyu Lee is currently a structural engineer at CNP Dongyang, Seoul, Korea. His research interests include structural health monitoring, building response analysis, and structural design.
Sang Geun Bae
Sang Geun Bae is a PhD candidate at the Department of Architectural Engineering, Yonsei University, Seoul, Korea. His research interests include structural health monitoring, optimal structural design, and serviceability analysis using IT.
Taehoon Hong
Taehoon Hong is currently a professor of the Department of Architecture and Architectural Engineering at Yonsei University. His research topics include renewable energy system, energy performance, solar photovoltaic system, indoor environmental quality, and sustainable buildings.
Dong-Eun Lee
Dong-Eun Lee is currently a professor of the School of Architecture, Civil Engineering, Environment, and Energy, Kyungpook National University, Daegu, Korea. His research interests include construction business process modeling and automation, simulation based stochastic scheduling method, stochastic simulation and quantitative method/analysis, and construction quality and safety.
Hyo Seon Park
Hyo Seon Park is currently a professor with the Department of Architectural Engineering and the director of the Center for Structural Health Care Technology in Buildings, Yonsei University. He received the BS and MS degrees in architectural engineering from Yonsei University, Seoul, Korea, in 1986 and 1988, respectively, and the PhD degree in civil engineering from The Ohio State University, Columbus, OH, USA, in 1995. His research interests include structural health monitoring, wireless sensor networks, optimal structural design, vibration control of buildings, and AI-based structural response estimation and safety/serviceability analysis.
References
- Aasim, B. A., A. K. Karimi, J. Tomiyama, and Ö. Aydan. 2020. “Numerical Verification of accelerometer-based Assessment of hollow-type Pretensioned Concrete Girder.” Asian Journal of Civil Engineering 21 (3): 437–447. doi:10.1007/s42107-019-00219-w.
- Amick, H., and M. Gendreau. 2000. “Construction Vibrations and Their Impact on vibration-sensitive Facilities.” In ASCE Construction Congress 6 (Orlanndo, Florida: ASCE), doi:10.1061/40475(278)80.
- Annamdas, V. G. M., S. Bhalla, and C. K. Soh. 2017. “Applications of Structural Health Monitoring Technology in Asia.” Structural Health Monitoring 16 (3): 324–346. doi:10.1177/1475921716653278.
- Chae, M. J., H. S. Yoo, J. Y. Kim, and M. Y. Cho. 2012. “Development of a Wireless Sensor Network System for Suspension Bridge Health Monitoring.” Automation in Construction 21: 237–252. doi:10.1016/j.autcon.2011.06.008.
- Chen, J., and Z. Xia. 2014a. “Fatigue Behaviour of Coke Drum Materials under thermal-mechanical Cyclic Loading.” Theoretical and Applied Mechanics Letters 4 (4): 41006. doi:10.1063/2.1404106.
- Chen, J., and Z. Xia. 2014b. “A Fatigue Life Prediction Method for Coke Drum Base, Weld, and HAZ Materials from Tensile Properties.” Materials & Design 63: 575–583. doi:10.1016/j.matdes.2014.06.056.
- Deutsches Institut für Normung. 1999. DIN 4150-3: Structural Vibrations–Part 3: Effects of Vibration on Structures (Berlin: German Standards Organization (GSO)).
- Dong, J. H., L. L. Guo, and B. J. Gao. 2015. “A Finite Element Analysis of the Cyclic Plasticity Behavior of Circumferential Weld of Coke Drum under Moving Axial Temperature Gradient.” Procedia Engineering 130: 307–321. doi:10.1016/j.proeng.2015.12.224.
- Engery Information Administration. 2021. “U.S. Number of Operating Refineries as January 1, Annual.” Accessed 21 December 2009. https://www.eia.gov/opendata/qb.php?sdid=PET.8_NA_8OO_NUS_C.A
- Guo, T., Z. Chen, S. Lu, and R. Yao. 2018. “Monitoring and Analysis of long-term Prestress Losses in post-tensioned Concrete Beams.” Measurement 122: 573–581. doi:10.1016/j.measurement.2017.07.057.
- Jin, S. S., and H. J. Jung. 2018. “Vibration-based Damage Detection Using Online Learning Algorithm for output-only Structural Health Monitoring.” Structural Health Monitoring 17 (4): 727–746. doi:10.1177/1475921717717310.
- Kim, Y., J. S. Park, B. K. Oh, T. Cho, J. M. Kim, S. H. Kim, and H. S. Park. 2019. “Practical Wireless Safety Monitoring System of long-span Girders Subjected to Construction Loading a Building under Construction.” Measurement 146: 524–536. doi:10.1016/j.measurement.2019.05.110.
- Korea Meteorological Administration. 2021. “Open MET Data Portal.” Accessed 21 March 2007. https://data.kma.go.kr/cmmn/main.do
- Korean Concrete Institute. 2012. Concrete Structure Design Code (KCI 2012). Seoul: Korean Concrete Institute.
- Korean Standard. 2016. Rolled Steels for General Structure (KS D 3503). Seoul: Korean Agency for Technology and Standards.
- Li, Z., Z. Xue, X. Wang, and F. Li. 2012. “Safe Life Estimation of Coke Drum in Service Environment.” Journal of Pressure Vessel Technology 134 (3). doi:10.1115/1.4005882.
- Lin, S. W., T. H. Yi, H. N. Li, and L. Ren. 2017. “Damage Detection in the Cable Structures of a Bridge Using the Virtual Distortion Method.” Journal of Bridge Engineering 22 (8): 4017039. doi:10.1061/(ASCE)BE.1943-5592.0001072.
- Magalhães, F., Á. Cunha, and E. Caetano. 2012. “Vibration Based Structural Health Monitoring of an Arch Bridge: From Automated OMA to Damage Detection.” Mechanical Systems and Signal Processing 28: 212–228. doi:10.1016/j.ymssp.2011.06.011.
- Oh, B. K., B. Glisic, Y. Kim, and H. S. Park. 2020. “Convolutional Neural network–based Data Recovery Method for Structural Health Monitoring.” Structural Health Monitoring 19 (6): 1821–1838. doi:10.1177/1475921719897571.
- Oka, M., H. Ambarita, M. Daimaruya, and H. Fujiki. 2011. “Study on the Effects of Switching Temperature on the Thermal Fatigue Life of the shell-to-skirt Junction of Coke Drum.” Journal of Pressure Vessel Technology 133 (6). doi:10.1115/1.4004564.
- Park, H. S., and B. K. Oh. 2018. “Real-time Structural Health Monitoring of a Supertall Building under Construction Based on Visual Modal Identification Strategy.” Automation in Construction 85: 273–289. doi:10.1016/j.autcon.2017.10.025.
- Park, H. S., J. Kim, and B. K. Oh. 2019. “Model Updating Method for Damage Detection of Building Structures under Ambient Excitation Using Modal Participation Ratio.” Measurement 133: 251–261. doi:10.1016/j.measurement.2018.10.023.
- Penso, J. A., Y. M. Lattarulo, A. J. Seijas, J. Torres, D. Howden, and C. L. Tsai. 1999 Understanding failure mechanisms to improve reliability of coke drums PVP- American Society of Mechanical Engineers. Pressure Vessels and Piping Division Newsletter 1 August 1999 through 5 August 1999 395 Boston, Massachusetts . New York.ASME 243–253 .
- Penso, J. A., C. L. Tsai, D. G. Howden, and W. O. Soboyejo. 2000. “Assessing Deterioration Conditions in Coke Drums.” Welding Journal 79 (8): 45–52.
- Presas, A., D. Valentin, E. Egusquiza, C. Valero, M. Egusquiza, and M. Bossio. 2017. “Accurate Determination of the Frequency Response Function of Submerged and Confined Structures by Using PZT-patches.” Sensors 17 (3): 660. doi:10.3390/s17030660.
- Qarib, H., and H. Adeli. 2016. “A Comparative Study of Signal Processing Methods for Structural Health Monitoring.” Journal of Vibroengineering 18 (4): 2186–2204. doi:10.21595/jve.2016.17218.
- Riveiro, B., M. J. DeJong, and B. Conde. 2016. “Automated Processing of Large Point Clouds for Structural Health Monitoring of Masonry Arch Bridges.” Automation in Construction 72: 258–268. doi:10.1016/j.autcon.2016.02.009.
- Shang, Z., and Z. Shen. 2018. “Multi-point Vibration Measurement and Mode Magnification of Civil Structures Using video-based Motion Processing.” Automation in Construction 93: 231–240. doi:10.1016/j.autcon.2018.05.025.
- Umar, S., M. Vafaei, and S. C. Alih. 2021. “Sensor clustering-based Approach for Structural Damage Identification under Ambient Vibration.” Automation in Construction 121: 103433. doi:10.1016/j.autcon.2020.103433.
- Wu, Y., R. Zhu, Z. Cao, Y. Liu, and D. Jiang. 2020. “Model Updating Using Frequency Response Functions Based on Sherman–Morrison Formula.” Applied Sciences 10 (14): 4985. doi:10.3390/app10144985.
- Xia, Z., F. Ju, and P. Du Plessis. 2010. “Heat Transfer and Stress Analysis of Coke Drum for a Complete Operating Cycle.” Journal of Pressure Vessel Technology 132 (5). doi:10.1115/1.4001208.
- Yan, Z., Y. Zhang, J. Chen, and Z. Xia. 2015. “Statistical Method for the Fatigue Life Estimation of Coke Drums.” Engineering Failure Analysis 48: 259–271. doi:10.1016/j.engfailanal.2014.11.007.
- Yun, D., D. Kim, M. Kim, S. G. Bae, J. W. Choi, H. B. Shim, T. Hong, D. Lee, and H. S. Park. 2021. “Field Measurements for Identification of Modal Parameters for high-rise Buildings under Construction or in Use.” Automation in Construction 121: 103446. doi:10.1016/j.autcon.2020.103446.
- Zhang, Y., and Z. Xia. 2015. “Simplified Thermoelastoplastic Models for Determination of Global and Local Stress in Coke Drums.” Journal of Thermal Stresses 38 (1): 22–38. doi:10.1080/01495739.2014.976117.