
 ?Mathematical formulae have been encoded as MathML and are displayed in this HTML version using MathJax in order to improve their display. Uncheck the box to turn MathJax off. This feature requires Javascript. Click on a formula to zoom.
ABSTRACT
Although some researchers have explored spatiotemporal characteristics of the land surface temperature (LST) and analyzed how the influencing factors impact the LST, the comprehensive influencing factors and specific spatial relationships that explore the Urban Heat Island (UHI) effect from long time scale have rarely received widespread attention. Taking Nanchang as an example, this paper first uses Landsat data to retrieve the LST in years 2000, 2010, and 2019. Then, the Geographically Weighted Regression (GWR) model is utilized to investigate the various influencing factors. The results showed as follows: (1) The UHI effect was intensified in the past 20 years in Nanchang City. From 2000 to 2019, the “heat island” increased from 63.06% to 64.07%, while the “green island” decreased from 36.94% to 35.93%. (2) The spatiotemporal anisotropy of the UHI effect was significant. (3) The GWR model could better reveal the spatial heterogeneity of the factors affecting the UHI effects. The relationship between Soil Brightness Index (NDSI), Normalized Difference Built-up Index (NDBI), and Night-lighting (NL) and the relative UHI effect intensity had significant spatial non-stationarity. This study can provide some references from reasonable urban planning to alleviate the urban heat island.
1. Introduction
Urbanization is a complex and dynamic process generated by the interaction between socioeconomic and environmental factors (Mu et al. Citation2016; Zhang et al. Citation2020; Zhou and Chen Citation2018). This process not only results in significant changes in the characteristics of the underlying surface of the city, but also produces a series of disadvantageous impacts on the urban environment, especially the urban thermal environment (Bai et al. Citation2017). The Urban Heat Island (UHI) effect, which refers to the phenomenon of urban areas that exhibits typically warmer than surrounding rural areas (Levermore et al. Citation2018), is one of the core representatives of the urban thermal environment (Nwakaire et al. Citation2020). Multiple studies have documented that the UHI effect does negatively impact on natural and socioeconomic aspects of cities (Li et al. 2019 ; Li et al. Citation2020; Zhou et al. Citation2011), e.g., air pollution (Sabrin et al. Citation2020; Wei et al. Citation2021), climatic warming (Emmanuel and Krüger Citation2012), and health risks for urban residents (Tan et al. Citation2010). Therefore, the study on the spatial pattern of the UHI effect and its influencing factors has become a research hotspot in various fields, such as climatology, ecology, and urban planning (Chen et al. Citation2021; Lu et al. Citation2021).
Traditionally, UHI surveys have focused on air UHI, where the air temperature is measured in situ at fixed isolated stations (e.g., meteorological stations, traverses of vehicles) and more special platforms (e.g., tall towers, radiosondes, and aircraft) (Zhao et al. Citation2018). Due to the restriction of the scarcity and inhomogeneity distribution of monitoring stations, the air UHIs measured by monitoring stations usually cannot provide enough effective spatial and temporal coverage for urban thermal environment research (Dewan et al. Citation2021; Naserikia et al. Citation2019). In contrast, the surface UHI (SUHI) is primarily measured by the Land Surface Temperature (LST) obtained from Remote Sensing (RS) data of thermal infrared (TIR), indicating the radiative temperature difference between urban and suburban surfaces (Chen et al. Citation2021). TIR remote sensing has the characteristics of space-time coverage, high accuracy, and low cost, which can greatly improve the ability to study urban thermal environment (SINGH Citation1984; Ulpiani Citation2021). Therefore, it is helpful to identify the spatiotemporal pattern of the UHI effect based on SUHI data (Athukorala and Murayama, Citation2021; Pathak et al. Citation2021), and further explore its influencing factors (Monteiro et al. Citation2021; Siqi and Yuhong Citation2020), which provides a scientific basis for better management of the urban thermal environment in metropolitan cities (Emmanuel and Krüger Citation2012; Estoque and Murayama Citation2017; Zhao et al., 2018; Zhi et al. Citation2020).
It has been proved that many factors can affect the UHI effect. These factors include urban morphology (two-dimensional and three-dimensional) (Guo et al. Citation2020; Qiao et al. Citation2020; Takebayashi and Senoo Citation2018; Yang et al. Citation2021), land cover (e.g., water bodies, and green plants) (Bao et al. Citation2016; Siqi and Yuhong Citation2020), RS spectral indices (e.g., Normalized difference vegetation index (NDVI), Normalized Difference Built-up Index (NDBI), Soil Brightness Index (NDSI)) (Estoque and Murayama Citation2015; Guha, Govil, and Besoya Citation2020; Pathak et al. Citation2021; Sun Citation2016; Weng, Lu, and Schubring Citation2004), topography (Estoque and Murayama Citation2017; Kashki et al. Citation2021), and spatialized socioeconomic indicators, e.g., night-lighting (Kurniati and Nitivattananon Citation2016; Zhang, Estoque, and Murayama Citation2017; Zhang and Li Citation2018). However, most of the current studies only focused on a single factor rather than from a comprehensive perspective of physical and socioeconomic factors’ points of view (Kashki et al. Citation2021; Pathak et al. Citation2021). Therefore, it is of great scientific significance to use an integrated model with comprehensive influencing factor to clarify the UHI effect intensity or the LST.
Traditional regression models assume that the variables are spatially homogeneous, the spatial non-stationarity of spatial variables in geoscience is often ignored (Deilami, Kamruzzaman, and Liu Citation2018; Siqi and Yuhong Citation2020). However, there really exists obvious spatial differences in spatial variables (physical, ecological, and socioeconomic) in cities. Spatial heterogeneity is composed of the spatial differentiation of physics, ecology, and socioeconomic in urban areas (Pickett et al. Citation2017), which leads to the spatial non-stationarity of the formation mechanism of the UHI effect (Zhou et al. Citation2017). Thus, in order to better understand the spatial differences, the Geographically Weighted Regression (GWR) model was borrowed to simulate spatial heterogeneity (Zhao et al. 2018; Zhi et al. Citation2020). Luo et al. (Luo and Peng Citation2016) used the GWR model to quantify the relationships of the LST and impact factors at different spatial resolutions in Chongqing City, China, and indicated that GWR provides a better fit and is more localized in the formation. Kashki et al. (Kashki et al. Citation2021) utilized the GWR model to test the spatial non-stationarity of the relationships between geographical parameters and the LST in Shiraz City, Iran, and found that GWR has better performance in showing the spatial distribution of LSTs. Therefore, GWR can better reveal the spatial variation in the relationship between LST or UHI effect and influencing factors from a local perspective, which is of great significance to rational urban planning.
Current research has mainly focused on large cities and megacities with rapid economic development (Dewan et al. Citation2021; Yang, Huang, and Tang Citation2019; Zeng et al. Citation2009). However, due to factors, such as geography, history and policy, the research on medium and small cities is seriously insufficient (Li et al. 2019). In addition, with the rapid development of social economy, continuous urbanization, population growth, and inappropriate urban planning have gradually resulted in increasing UHI effect in medium and small cities (Zhou et al. Citation2017). For example, Liao et al. (Liao et al. Citation2022) analyzed the combined effect the abnormal heat island and UHI in Guiyang from multiple time series, and found that the impact of UHI intensified with rapid urbanization. Therefore, it is significant and necessary to explore the spatiotemporal distribution of the UHI effect from multiple time series and analyze the influencing factors in order to alleviate the thermal environment problems in medium and small cities.
Taking Nanchang City, the capital city of Jiangxi Province with rapid urbanization in the middle reaches of the Yangtze River in China as an example, this paper first retrieved the LST through a single-window algorithm (Estoque and Murayama Citation2015, Citation2017) under the support of Landsat RS images (Landsat 5 TM and Landsat 7 ETM+) in year 2000, 2010, and 2019. Then the Geographic Information System (GIS), RS, and GWR models were utilized to explore the spatiotemporal characteristics of the UHI effect and influencing factors in three typical periods. The objectives of this study are as follows:
Deriving and analyzing the UHI effect spatiotemporal distribution characteristics in Nanchang from satellite images.
Identifying spatiotemporal anisotropy of the UHI effect in some directions.
Investigating the various influencing factors using the GWR model and discovering the spatial heterogeneity of influencing factors.
The results of this study are expected to clarify the temporal and spatial variations of the UHI effect in Nanchang and influencing factors behind the variations, thus providing some references for rational urban planning for sake of thermal environment regulation and livable environment construction.
2. Materials and methods
2.1. Research area
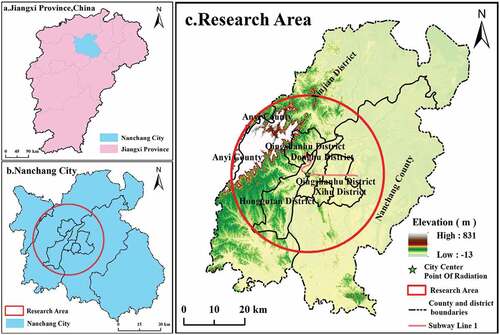
Nanchang city is located between 28°10’~29°11’ N and 115°27’~116°35E on the southwest bank of Poyang Lake, the largest freshwater lake in China. The Ganjiang River passes through the city. It is a relatively plain area with a subtropical monsoon climate characterized by abundant heat, rainfall, and light. The extreme maximum temperature is 40.9°C. It is one of the hottest cities in China, well-known as the “four furnaces” of the country. It experienced rapid urbanization in the past 40 years, and the population has increased rapidly from 3.0682 million in 1978 to more than 5.606 million in 2019 (http://tjj.nc.gov.cn/ncstjj/tjnj/nav_list.shtml). The population growth and city expansion have brought about a series of environmental problems, one of which is the UHI effect has been exacerbated, presenting substantial adverse threats to both residential and environmental health in and around cities (Nwakaire et al. Citation2020; Zhang, Estoque, and Murayama Citation2017).
As the earliest built-up subway, Line 1 runs through the east and west areas of urban development. The midpoint of it passing through the Ganjiang River happens to be the city center. The area with a radius of 25 km covers the city’s concentrated development area (e.g., Donghu District, Xihu District, Qingyunpu District, Qingshanhu District, and Honggutan District). Therefore, this paper takes the midpoint of subway line 1 with a radius of 25 km as the research area ().
Figure 1. The geographical location of Nanchang and research area.
2.2. Data source and preprocessing
The data used in this study were downloaded from the open dataset (e.g., https://earthexplorer.usgs.gov/, https://earthdata.nasa.gov/). They included the image data of Landsat with the path of 121 and row of 40 on 2 November 2000 (Landsat 5 TM), 6 November 2010, and 15 November 2019 (Landsat 7 ETM+), which are clear and visible with minimal cloud cover less than 5.00%, and thus meet the requirements of this research. Such data preprocessing as radiometric calibration, atmospheric correction, geometric correction, masking, and other treatments on image data from three time periods were conducted by ENVI 5.3 and ArcGIS10.2. LSTs were retrieved utilizing the single-window algorithm for better discovering the spatial pattern characteristics of the UHI effect on the study area (Estoque and Murayama Citation2015, Citation2017). The vegetation index, built-up index, and bare land (soil) indexes were calculated to represent the land cover information for exploring the response relationship between the land cover and the UHI effect (Guo et al. Citation2020; Luo and Peng Citation2016).
In addition, Night-lighting data revealing the relationship between various relevant socioeconomic information and the UHI effect (Zhang and Li Citation2018) were obtained from the Earth Observation Group (https://payneinstitute.mines.edu/). The Digital Elevation Model (DEM) data were obtained from the Geospatial Data Cloud (http://www.gscloud.cn/) and the United States Geological Survey (https://earthexplorer.usgs.gov/). The elevation and slope were extracted by the DEM to display the influence of topography on the UHI effect (Kashki et al. Citation2021). Administrative boundary data were acquired from the Nanchang Natural Resources Bureau. UTM projection with the WGS84 coordinate system was applied to all spatial data. The resolution was unified to that of image data, which is 30 m × 30 m.
2.3. Methods
Firstly, the LST was retrieved through the single-window algorithm and the relative UHI effect intensity was classified. Then, four directions profile maps, namely Along Ganjiang River to Poyang Lake, Honggutan district to Yaohu Forest Park, Meiling National Forest Park to Nanchang County, and Meiling National Forest Park to Poyang Lake were drawn using the profile analysis method, and the spatiotemporal anisotropy of the UHI effect was explored. Finally, 1152 grid samples, nearly 10% of the total, were randomly selected for obtaining influencing factors values and the relative UHI effect intensity values. Taking the various influencing factors as the independent variable and the relative UHI effect intensity as the dependent variable, the GWR models were established (). The main methods used in this study are as follows.
Figure 2. Workflow in this study.
2.3.1. LST retrieval
The single-window algorithm was used in this study to retrieve the LST (Yu, Guo, and Wu Citation2014). Its expression is as follows:
Where, T is the surface temperature (°C), ε is the surface emissivity, TB is the radiant brightness temperature (K), Lλ is the radiant brightness value in the thermal infrared band, ρ = hc/δ is 1.438 × 10⁻²mK, δ is the Boltzmann constant, which is 1.38 × 10⁻²³J/K, h is the Planck constant, which is 6.626 × 10⁻³⁴Js, c is the speed of light, which is 2.998 × 10⁸ m/s, 273.15 is the conversion constant between Kelvin and Celsius temperature; λ, K1 and K2 are constants, in which λ, K1 and K2 of Landsat 5 TM band 6 are 11.5 µm, 607.76 W/(m2∙sr∙µm), 1260.56 K, respectively, and λ, K1 and K2 of Landsat 7 ETM + band 6 are 11.5 µm, 666.09 W/(m2∙sr∙µm), 1282.71 K, respectively (Weng, Lu, and Schubring Citation2004). The surface emissivity (ε) is calculated by the study of Sobrino, Jiménez-Muñoz, and Paolini (Citation2004) and Estoque and Murayama (Citation2015).
2.3.2. Classification of UHI effect
The relative UHI effect intensity was employed to classify the UHI effect based on existing researches (Bao et al. Citation2016). The larger the value is, the more obvious the UHI effect is. The equation is as follows:
Where, UHIEI is the relative UHI effect intensity, which is a dimensionless value that reflects the strength of the UHI effect; Ti is the LST of the ith point in the study area; Tmean is the mean LST of the study area.
2.3.3. Spatiotemporal anisotropy of the UHI effect
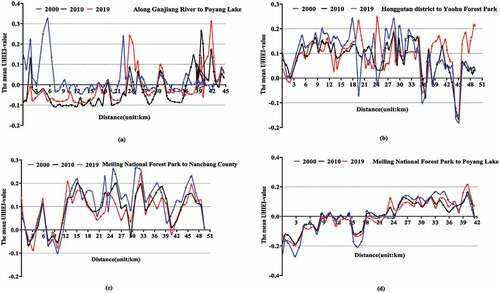
Based on the Third Law of Geography, the similarities and differences in spatial localization or stratification of different areas correspond to the similarities and differences of target variables in these areas (Zhi et al. Citation2020). Profile map was applied to determine the temporal and spatial anisotropy of the UHI effect in this study since it can intuitively describe the spatiotemporal differentiation of the urban thermal environment (Zhao et al., 2018). According to the terrain gradient and urban expansion directions of Nanchang City, the multi-directional profile map on the UHIEI in three periods including Along Ganjiang River to Poyang Lake, Honggutan district to Yaohu Forest Park, Meiling National Forest Park to Nanchang County, and Meiling National Forest Park to Poyang Lake were made. Firstly, the mean UHIEI-value was calculated from a set of polygon grids captured on UHIEI maps in year 2000, 2010, and 2019. Secondly, the starting location of the profile analysis was located, which was called kilometer 0. Finally, the profile map was drawn based on its own distance interval of 3 km and the UHIEI-value ().
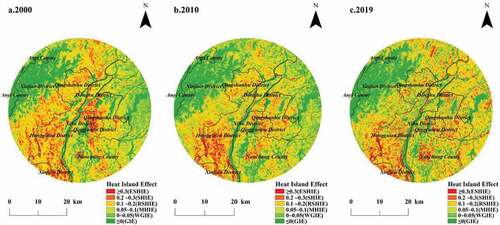
Figure 3. Spatiotemporal distribution characteristics of the UHI effect in Nanchang city: (a)-(c) 2000, 2010, and 2019, respectively.
2.3.4. Influencing factors of the UHI effect
The UHI effect is strongly affected by combined factors, such as DEM, NDVI, NDBI (Deilami, Kamruzzaman, and Liu Citation2018; Guo et al. Citation2020). NDVI, NDBI, and NDSI are usually used to represent vegetation, built-up land, and bare land information on urban underlying surfaces, and then DEM and slope are used to characterize topographic information to explore the impact on land covers and topography on UHI effect (Ulpiani Citation2021). In addition, Night-lighting is an important indicator to reflect the heat release of human activities (Wei et al. Citation2021). Totally six impact indexes were selected as the UHIEI explanatory variables in this study. The details are as follows ().
Topography factors. Slope is also a critical topographic factor affecting the LST (Kashki et al. Citation2021). When the elevation increases by 10 m, the temperature decreases by about 0.064°C.
Vegetation factors. Vegetation is expected to strongly affect land surface temperature (Sun Citation2016). The NDVI was applied to express vegetation. Its expression is as follows:
(3)Building factors. The built-up or impervious surfaces were expressed using a sensitive indicator of the NDBI in this work. When the negative NDBI value usually represents the water body, close to zero value represents the vegetation, and a positive value represents the built-up area (Zhang, Estoque, and Murayama Citation2017). The equation is as follows:
(4)Bare land (soil) factors. The NDSI, can better distinguish the construction land from the bare land (Luo and Peng Citation2016) was used in this study. The equation is as follows:
(5) Socioeconomic factors. Night light data have been widely used in urban research, such as analyzing urban spatial sprawl trends, mapping urban areas, and estimating the urban thermal environment (Guo et al. Citation2020; Zhang and Li Citation2018). The NL obtained by Inverse Distance Kriging Interpolation was applied to explain the relationship with the UHIEI.
Table 1. Impact indexes of the UHI effect in Nanchang city.
In the above formula, NIR is the near-infrared band (band 4 of Landsat 5 TM and Landsat 7 ETM+), Red is the red band (band 3 of Landsat 5 TM and Landsat 7 ETM+), Green is the green band (band 2 of Landsat 5 TM and Landsat 7 ETM+), Blue is the blue band (band 1 of Landsat 5 TM and Landsat 7 ETM+), and MIR represents the mid-infrared band (band 5 of Landsat 5 TM and Landsat 7 ETM+).
2.3.5. Regression analysis
Since the GWR model can reflect the spatial non-stationarity through the variation of the spatial position of the regression coefficients(Luo and Peng Citation2016), it is often used to analyze the spatial heterogeneity of explanatory variables. Based on the former research (Zhi et al. Citation2020) and actual conditions in the study area, the study area was divided into 420 m × 420 m grid cells. 1152 grid samples, approximately 10% of the total, were randomly selected to obtain the mean value of influencing factors and the UHIEI. In order to ensure the feasibility and improve the accuracy of the GWR model, the traditional ordinary linear least squares (OLS) model was used to conduct a preliminary test on the influencing factors. The variance inflation factor (VIF) tested was implemented to ensure there exists no multicollinearity between variables. The GWR model is represented as follows:
where yi is the observed value(UHIEI); (μi, νi) are the geographic coordinates of data sampling point i; β0(μi, νi) is the regression attempt for sample i; βk(μi, νi) is the regression parameter for independent variable k at data sampling grid i; k is the number of independent variables; xik is the value of the independent variable xk (i.e., DEM, Slope, NDVI, NDBI, NDSI, NL) at point i; εi is the random error term.
3. Results
3.1. Spatiotemporal distribution characteristics of UHI effect
According to previous research (Bao et al. Citation2016), the UHIEI can be divided into six levels, i.e., Green Island Effect (GIE), Weak Green Island Effect (WGIE), Medium Heat Island Effect (MHIE), Relatively Strong Heat Island Effect (RSHIE), Strong Heat Island Effect (SHIE) and Extremely Strong Heat Island Effect (ESHIE) ().
Table 2. Classification of the UHI effect.
As can be seen from , spatially, the ESHIE was mainly distributed in the main urban area with dense population and increasing built-up land. The RSHIE was mainly located in the areas bordering the suburbs and urban areas. The GIE was mainly distributed in such nature conversation land as the Meiling National Forest Park, Yaohu Forest Park, and rivers and lakes’ water surface.
Figure 4. Profile map of the UHIEI in Nanchang city with 2000, 2010, and 2019: (a), (b), (c), and (d), respectively.
From 2000 to 2019, we found that the “heat island” area of Nanchang City had increased from 1238.18 km2 to 1258.02 km2, while the “Green Island” area had decreased from 725.31 km2 to 705.47 km2 (). In general, except for SHIE, the proportions of the other effect have undergone significant changes between 2000 and 2019. The area of the ESHIE, RSHIE, and GIE increased by 27.50, 31.04, and 58.39 km2, while that of the MHIE and WGIE decreased by 25.17 and 78.23 km2.
Table 3. Statistics on the UHI effect of Nanchang in 2000, 2010 and 2019.
3.2. Spatiotemporal anisotropy of the UHI effect
From the profile map of the UHIEI (), we found that the UHIEI varied from −0.4 to 0.4 with increasing distance in three periods, implying that there was spatiotemporal anisotropy of the UHI effect in Nanchang. Overall, the temporal and spatial anisotropy of the UHI effect was affected by various factors. When the UHIEI was less than 0, its area proportion was expanded along with increasing distance, indicating that the Ganjiang River could alleviate the UHI effect obviously ()). Furthermore, the UHIEI was more than 0.5, and its value changed significantly as the distance increases ()), suggesting that the main urban area with dense building, population density, and industrial layout caused the strengthening of the UHI effect. As the distance increased to 21 km, the UHIEI has been less than zero, implying that high altitude and vegetation relieved the UHI effect ()).
3.3. Influencing factors of the UHI effect
3.3.1. Influencing factors identification
The regression parameters in year 2000, 2010, and 2019 established by OLS are shown in . The maximum value of the variance inflation factor (VIFmax) was less than 10, so there was no collinearity problem. So GWR was further applied to identify the influencing factors. It could be seen from that the Adjusted R-squared were 0.811, 0.713, and 0.773, respectively, indicating that the GWR models can satisfy the accuracy requirement.
Table 4. The OLS model regression results and diagnostics for 2000, 2010, and 2019.
Table 5. Results and diagnostics of the GWR analysis in 2000, 2010, and 2019.
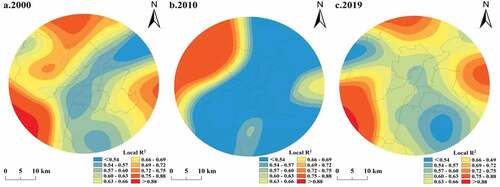
From the spatial perspective, the local goodness-of-fit (Local R2) in the center of the study area for the three periods was significantly lower than that in the northwest, southeast, and east directions (). The local goodness-of-fit (Local R2) showed a decreasing first and then increasing later on the tendency. This implied that it gradually decreased from the suburbs to the city center. Its radiation shape invariably kept the maximum of three typical centers and shifted and changed over time. This indicated that the UHIEI was mainly affected by the topography, vegetation, and bare land (soil) at first, and then by the urbanization process caused by the urban development and the built-up area expansion. Therefore, to effectively alleviate the future UHI effect of Nanchang City, we should scientifically and reasonably consider the layout of urban elements, such as expanding the construction of parks, strengthening the protection of nature reserves, and increasing the area of public green space.
Figure 5. Spatial distribution of the local R2 in GWR Model of Nanchang City: (a)-(c) 2000, 2010, and 2019, respectively.
3.3.2. Spatiotemporal heterogeneity of influencing factors
The regression coefficients for the various influencing factors in grid samples were obtained using the GWR models, as shown in . These coefficients are applied to statistical calculations to obtain Mean, Maximum (Max), Minimum (Min), Standard Deviation (SD), and Median (). It can be seen from that in 2000 and 2010, the overall NDSI regression coefficient was significantly larger than other variables, followed by NDBI and NDVI, while in 2019, the mean NDBI regression coefficient was significantly larger than other variables, followed by NDSI and NDVI. However, except for the NDBI is in 2019, the other coefficients contained more positive and negative values, such as DEM, NL, and highly correlated with the UHIEI, implying that influencing factors were higher spatial heterogeneity.
Figure 6. Regression coefficient of topography and vegetation factors in GWR models: (a)-(c) 2000, 2010, and 2019, respectively.
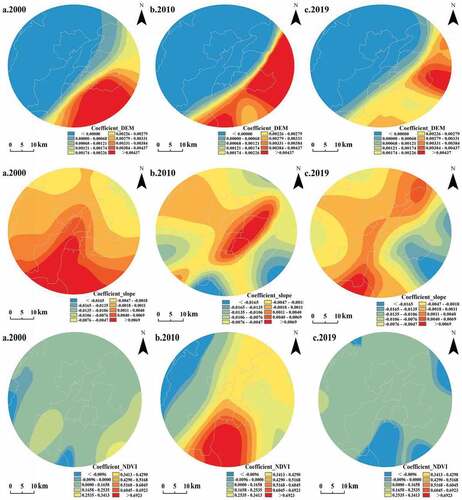
Figure 7. Regression coefficient of buildings, bare land, and social-economic factors in GWR Models: (a)-(c) 2000, 2010, and 2019, respectively.
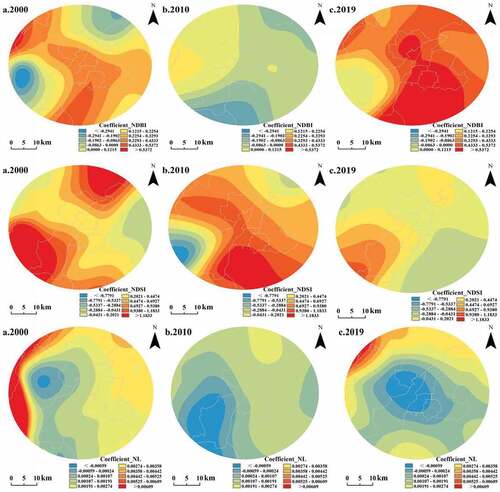
Table 6. Descriptive statistics of regression coefficients of GWR models for 2000, 2010, and 2019.
As shown in and , compared to NDVI, the DEM and Slope were weaker correlated with the UHIEI. As for the spatial distribution of the DEM regression coefficient, the minimum value was mainly located in the Meiling mountains in the northwest of Nanchang City, gradually raising from the northwest to the southeast. For the spatial distribution of the slope regression coefficient, the maximum value of the slope was mainly distributed in the main urban area of the city, and the minimum value was located in the suburbs of the city. It decreased along both sides of the Ganjiang River to the suburbs over time. The spatial distribution of the NDVI regression coefficient changed significantly. In 2000 and 2010, the minimum value of NDVI was distributed in the northwest of Nanchang City with the higher forest cover area, while in 2019, the minimum value of NDVI was distributed in the South and northeast of Nanchang City with water body, suggesting that the vegetation can alleviate the UHI effect more than water body does.
and show that the regression coefficients of NDBI and NDSI were the largest among all variables. NDBI and NDSI had the greatest influence on the UHI effect when other variables were not considered. For NDBI, the largest area was mainly distributed in the northwest (Anyi county) and the southeast (Xihu District and Qinyunpu District). In contrast, the lowest area was mainly distributed in the southwest and the northeast. The spatial distribution of the NDSI regression coefficient was basically opposite to that of the NDBI. This is because most of the farmland was left fallow and exposed in November, leading to the intensification of UHI effect. As far as the spatial distribution was concerned, the spatial distribution of the minimum value of NL regression coefficient was moving towards the central urban area and increased from the central urban area to the suburbs. It had little influence on the UHI effect.
4. Discussion
4.1. Spatial regression model to identify influencing factors
It is imperative to choose an effective regression model to analyze the spatial variation of influencing factors. Traditional regressions are the primary tools for investigating the influencing factors of the UHI effect (Deilami, Kamruzzaman, and Liu Citation2018). However, most of the existing studies indicated that traditional regression model hides important details in the spatial variation and makes it impossible to capture the spatial dependence of the data (Guo et al. Citation2020). The assumption that evaluation coefficients without considering the spatial relationship between variables in the traditional regression model is unreasonable in this study because the UHI effect is proved to exhibit significant spatial heterogeneity (Zhao et al., 2018). Compared with traditional regressions, GWR can effectively reveal the spatial variation of the relationship between various factors and the UHI effect (Guo et al. Citation2020; Kashki et al. Citation2021; Zhi et al. Citation2020). Additionally, it further proved that the GWR model had the inherent potential to better understand the relationship between the phenomenon of the UHI effect and associated biophysical factors in China (Siqi and Yuhong Citation2020; Zhi et al. Citation2020).
4.2. Influencing factors of the UHI effect
The underlying surface of the city is a more complex ecosystem, which is produced by the joint action of nature, economy, and society. Researchers studying the UHI effect influencing factors have generally paid attention to meteorological characteristics, landscape features, RS spectral information, land use types, urban morphology, topographic features, and socioeconomic characteristics (Kashki et al. Citation2021; Kurniati and Nitivattananon Citation2016; Zhi et al. Citation2020), and analyzed the impact of green space, waterbodies, and impervious surface on urban thermal environment (Bao et al. Citation2016; Du et al. Citation2016; Guha, Govil, and Besoya Citation2020; Weng, Lu, and Schubring Citation2004). The spatial characteristics of the UHI effect in the daytime, nighttime, seasonal, annual (Chen et al. Citation2021; Miles et al. Citation2017) and different spatial scales (Luo and Peng Citation2016) were also studied recently. Additionally, studies have begun to investigate the impact of socio-economic factors (Sabrin et al. Citation2020; Zhang, Estoque, and Murayama Citation2017) (e.g., air pollutants, gross domestic products (GDP), and population density) and two-dimensional and three-dimensional urban morphology (Qiao et al. Citation2020; Takebayashi and Senoo Citation2018) (e.g., building height, and building density) on the UHI effect.
However, existing studies mostly focused single influencing factor and were lack of comprehensive analysis from the integration of natural and human perspectives (Deilami, Kamruzzaman, and Liu Citation2018; Dewan et al. Citation2021; Nwakaire et al. Citation2020; Ren et al. Citation2022; Xie et al. Citation2022; Zhao et al. Citation2021). The researches on the UHI effect are an inter-discipline topic which involves many disciplines such as geography, meteorology, urban planning, and geostatistics, but the traditional research cannot effectively integrate and make full use of the independent knowledge. In this work, GWR was adopted to solve the above mentioned problems. It can combine topography, vegetation, impervious surfaces, bare land (soil), and socioeconomic of the relative disciplines to reflect the UHI effect and determine the spatial distributions of influencing factors.
There are some limitations on this study needed to be further discussed and solved. First, the lack of three-dimensional information can affect the results. In recent years, many studies have proved that the three-dimensional play a more important role than two-dimensional in shaping the urban thermal environment at different urban geometries (Berger et al. Citation2017; Sun et al. Citation2020). This is because the three-dimensional affect the surface energy balance and atmospheric transmission at local and urban scales, thereby changing the thermal environment inside the city, such as the intensification of the UHI effect (Alavipanah et al. Citation2018; Chen et al. Citation2022; Zheng et al. Citation2020). Therefore, three-dimensional information should be introduced in the following research to explore the impact on the UHI effect. Second, 420 m × 420 m spatial resolution was used for this study without considering the spatial scale effect. However, the scale effect could be an important factor affecting the precision of this study (Ren et al. Citation2022; Xie et al. Citation2022). Multiple scales are suggested to use for a better understanding of the UHI effect and influencing factors (Luo and Peng Citation2016; Miles et al. Citation2017). Third, the spatiotemporal distribution of the UHI effect in this study was obtained only in November. However, there are obvious seasonal and diurnal differences in the UHI effect (Chen et al. Citation2021). Therefore, the seasonal and diurnal spatiotemporal distributions and their driving factors should be further focused on for the study in the future.
5. Conclusion
Taking the midpoint of subway Line 1 with a radius of 25 km in Nanchang City as a case, the UHI effect of spatiotemporal characteristics in year 2000, 2010, and 2019 were analyzed. Furthermore, the influencing factors were explored by the GWR models. The main conclusions are as follows.
The UHI effect of Nanchang City had increased from 2000 to 2019. Specifically, from 2000 to 2019, the “Heat Island” increased from 63.06% to 64.07%, while the “Green Island” decreased from 36.94% to 35.93%. The “Heat island” was mainly distributed in the main urban area with flat terrain and dense population, whereas the “Green Island” was concentrated in the northwestern region dominated by Meiling National Forest Park.
In 2000, 2010, and 2019, the UHI effect of Nanchang City had significant temporal and spatial anisotropy. The UHIEI varied from −0.4 to 0.4 in the profile from Meiling National Forest Park to Poyang Lake, mainly affected by the topography, urban expansion, and land cover type.
The UHI effect was affected by many factors associated with underlying surface characteristics and had obvious heterogeneous characteristics. On the basis of identifying effective factors by OLS, the relationship between multi-temporal UHIEI and effective factors was analyzed by GWR. The spatial heterogeneity of regression coefficients of various factors can be better explained by the GWR model. The local regression coefficients of NDBI and NL show spatially significant differences, suggesting that there existed significant spatial non-stationarity. From the spatial distribution of Local-R2, it can be seen that with the expansion of the city, the fitting effect of the main urban area of the city shows a weakening trend as a whole. However, the overall radiation ranged showed an increasing trend, indicating that urban expansion played an important role in the UHI effect. Therefore, this study investigated the impact of urban underlying surface characteristics on the local thermal environment, and revealed the impact of influencing factors on the surrounding thermal environment by using the GWR. The results will help us better understand the influencing factors behind changes in the urban thermal environment, and provide support for future urban planning and construction to achieve sustainable urban development. Furthermore, in order to effectively improve the urban thermal environment, promotion of “zero carbon” buildings, high-density development of urban buildings control, reasonable urban planning for optimizing the layout of urban buildings and shaping a rational the urban green space are suggested to fulfil this task.
Nomenclature
Data Availability
The Landsat data used to support this study were supplied by the National Aeronautics and Space Administration (https://earthdata.nasa.gov/) and the United States Geological Survey (https://earthexplorer.usgs.gov/). Night-lighting was obtained from the Earth Observation Group (https://payneinstitute.mines.edu/). DEM was downloaded from the China Academy of Sciences website (http://www.gscloud.cn/).
Disclosure statement
No potential conflict of interest was reported by the author(s).
Additional information
Funding
References
- Alavipanah, S., J. Schreyer, D. Haase, T. Lakes, and S. Qureshi. 2018. “The Effect of multi-dimensional Indicators on Urban Thermal Conditions.” Journal of Cleaner Production 177: 115–123. doi:10.1016/j.jclepro.2017.12.187.
- Athukorala, D., and Y. Murayama. 2021. “Urban Heat Island Formation in Greater Cairo: Spatio-Temporal Analysis of Daytime and Nighttime Land Surface Temperatures along the Urban–Rural Gradient.” Remote Sensing 13: 1396. doi:10.3390/rs13071396.
- Bai, X., T. McPhearson, H. Cleugh, H. Nagendra, X. Tong, T. Zhu, and Y. Zhu. 2017. “Linking Urbanization and the Environment: Conceptual and Empirical Advances.” Annual Review of Environment and Resources 42: 215–240. doi:10.1146/annurev-environ-102016-061128.
- Bao, T., X. Li, J. Zhang, Y. Zhang, and S. Tian. 2016. Assessing the Distribution of Urban Green Spaces and Its Anisotropic Cooling Distance on Urban Heat Island Pattern in Baotou, 12. Vol. 5. China: ISPRS International Journal of Geo-Information.
- Berger, C., J. Rosentreter, M. Voltersen, C. Baumgart, C. Schmullius, and S. Hese. 2017. “Spatio-temporal Analysis of the Relationship between 2D/3D Urban Site Characteristics and Land Surface Temperature.” Remote Sensing of Environment 193: 225–243. doi:10.1016/j.rse.2017.02.020.
- Chen, L., X. Wang, X. Cai, C. Yang, and X. Lu. 2021. Seasonal Variations of Daytime Land Surface Temperature and Their Underlying Drivers over, 323. Vol. 13. Wuhan, China: Remote Sensing.
- Chen, Y., J. Yang, R. Yang, X. Xiao, and J. C. Xia. 2022. “Contribution of Urban Functional Zones to the Spatial Distribution of Urban Thermal Environment.” Building and Environment 216: 109000. doi:10.1016/j.buildenv.2022.109000.
- Deilami, K., M. Kamruzzaman, and Y. Liu. 2018. “Urban Heat Island Effect: A Systematic Review of spatio-temporal Factors, Data, Methods, and Mitigation Measures.” International Journal of Applied Earth Observation and Geoinformation 67: 30–42. doi:10.1016/j.jag.2017.12.009.
- Dewan, A., G. Kiselev, D. Botje, G. I. Mahmud, M. H. Bhuian, and Q. K. Hassan. 2021. “Surface Urban Heat Island Intensity in Five Major Cities of Bangladesh: Patterns, Drivers and Trends.” Sustainable Cities and Society 71: 102926. doi:10.1016/j.scs.2021.102926.
- Du, H., X. Song, H. Jiang, Z. Kan, Z. Wang, and Y. Cai. 2016. “Research on the Cooling Island Effects of Water Body: A Case Study of Shanghai, China.” Ecological Indicators 67: 31–38. doi:10.1016/j.ecolind.2016.02.040.
- Emmanuel, R., and E. Krüger. 2012. “Urban Heat Island and Its Impact on Climate Change Resilience in a Shrinking City: The Case of Glasgow, UK.” Building and Environment 53: 137–149. doi:10.1016/j.buildenv.2012.01.020.
- Estoque, R. C., and Y. Murayama. 2015. “Classification and Change Detection of built-up Lands from Landsat-7 ETM+ and Landsat-8 OLI/TIRS Imageries: A Comparative Assessment of Various Spectral Indices.” Ecological Indicators 56: 205–217. doi:10.1016/j.ecolind.2015.03.037.
- Estoque, R. C., and Y. Murayama. 2017. “Monitoring Surface Urban Heat Island Formation in a Tropical Mountain City Using Landsat Data (1987–2015).” ISPRS Journal of Photogrammetry and Remote Sensing 133: 18–29. doi:10.1016/j.isprsjprs.2017.09.008.
- Guha, S., H. Govil, and M. Besoya. 2020. “An Investigation on Seasonal Variability between LST and NDWI in an Urban Environment Using Landsat Satellite Data.” Geomatics, Natural Hazards and Risk 11: 1319–1345. doi:10.1080/19475705.2020.1789762.
- Guo, A., J. Yang, W. Sun, X. Xiao, J. Xia Cecilia, C. Jin, and X. Li. 2020. “Impact of Urban Morphology and Landscape Characteristics on Spatiotemporal Heterogeneity of Land Surface Temperature.” Sustainable Cities and Society 63: 102443. doi:10.1016/j.scs.2020.102443.
- Kashki, A., M. Karami, R. Zandi, and Z. Roki. 2021. “Evaluation of the Effect of Geographical Parameters on the Formation of the Land Surface Temperature by Applying OLS and GWR, A Case Study Shiraz City, Iran.” Urban Climate 37: 100832. doi:10.1016/j.uclim.2021.100832.
- Kurniati, A. C., and V. Nitivattananon. 2016. “Factors Influencing Urban Heat Island in Surabaya, Indonesia.” Sustainable Cities and Society 27: 99–105. doi:10.1016/j.scs.2016.07.006.
- Levermore, G., J. Parkinson, K. Lee, P. Laycock, and S. Lindley. 2018. “The Increasing Trend of the Urban Heat Island Intensity.” Urban Climate 24: 360–368. doi:10.1016/j.uclim.2017.02.004.
- Li, D., W. Liao, A. J. Rigden, X. Liu, D. Wang, S. Malyshev, and E. Shevliakova. 2019a. “Urban Heat Island: Aerodynamics or Imperviousness?” Science Advances 5: eaau4299–eaau4299. doi:10.1126/sciadv.aau4299.
- Li, Y., L. Wang, M. Liu, G. Zhao, T. He, and Q. Mao. 2019b. “Associated Determinants of Surface Urban Heat Islands across 1449 Cities in China.” Advances in Meteorology 2019: 1–14. doi:10.1155/2019/1750102.
- Li, Y., S. Schubert, J. P. Kropp, and D. Rybski. 2020. “On the Influence of Density and Morphology on the Urban Heat Island Intensity.” Nature Communications 11(1): 2647 doi:10.1038/s41467-020-16461-9 .
- Liao, S., H. Cai, P. Tian, B. Zhang, and Y. Li. 2022. “Combined Impacts of the Abnormal and Urban Heat Island Effect in Guiyang, a Typical Karst Mountain City in China.” Urban Climate 41: 101014. doi:10.1016/j.uclim.2021.101014.
- Lu, Y., T. He, X. Xu, and Z. Qiao. 2021. “Investigation the Robustness of Standard Classification Methods for Defining Urban Heat Islands.” IEEE Journal of Selected Topics in Applied Earth Observations and Remote Sensing 14: 11386–11394. doi:10.1109/JSTARS.2021.3124558.
- Luo, X., and Y. Peng. 2016. “Scale Effects of the Relationships between Urban Heat Islands and Impact Factors Based on a Geographically-Weighted Regression Model.” Remote Sensing 8: 760. doi:10.3390/rs8090760.
- Miles, V., I. Esau, M. Victoria, and E. Igor. 2017. “Seasonal and Spatial Characteristics of Urban Heat Islands (Uhis) in Northern West Siberian Cities.” Remote Sensing (Basel, Switzerland) 9: 989. doi:10.3390/rs9100989.
- Monteiro, F. F., W. A. Gonçalves, L. D. M. B. Andrade, L. M. M. Villavicencio, and C. M. Dos Santos Silva. 2021. “Assessment of Urban Heat Islands in Brazil Based on MODIS Remote Sensing Data.” Urban Climate 35: 100726. doi:10.1016/j.uclim.2020.100726.
- Mu, B., A. L. Mayer, R. He, and G. Tian. 2016. “Land Use Dynamics and Policy Implications in Central China.” A Case Study of Zhengzhou: Cities 58: 39–49.
- Naserikia, M., E. Asadi Shamsabadi, M. Rafieian, and W. Leal Filho. 2019. “The Urban Heat Island in an Urban Context: A Case Study of Mashhad, Iran.” International Journal of Environmental Research and Public Health 16: 313. doi:10.3390/ijerph16030313.
- Nwakaire, C. M., C. C. Onn, S. P. Yap, C. W. Yuen, and P. D. Onodagu. 2020. “Urban Heat Island Studies with Emphasis on Urban Pavements: A Review.” Sustainable Cities and Society 63: 102476. doi:10.1016/j.scs.2020.102476.
- Pathak, C., S. Chandra, G. Maurya, A. Rathore, M. O. Sarif, and R. D. Gupta. 2021. “The Effects of Land Indices on Thermal State in Surface Urban Heat Island Formation: A Case Study on Agra City in India Using Remote Sensing Data (1992–2019).” Earth Systems and Environment 5: 135–154. doi:10.1007/s41748-020-00172-8.
- Pickett, S. T. A., M. L. Cadenasso, E. J. Rosi-Marshall, K. T. Belt, P. M. Groffman, J. M. Grove, E. G. Irwin, et al. 2017. “Dynamic Heterogeneity: A Framework to Promote Ecological Integration and Hypothesis Generation in Urban Systems.” Urban Ecosystems 20: 1–14. doi:10.1007/s11252-016-0574-9.
- Qiao, Z., X. Han, C. Wu, L. Liu, X. Xu, Z. Sun, W. Sun, Q. Cao, L. Li, and W.-Z. Yue. 2020. “Scale Effects of the Relationships between 3D Building Morphology and Urban Heat Island: A Case Study of Provincial Capital Cities of Mainland China.” Complexity 2020: 1–12. doi:10.1155/2020/9326793.
- Ren, J., J. Yang, Y. Zhang, X. Xiao, J. C. Xia, X. Li, and S. Wang. 2022. “Exploring Thermal Comfort of Urban Buildings Based on Local Climate Zones.” Journal of Cleaner Production 340: 130744. doi:10.1016/j.jclepro.2022.130744.
- Sabrin, S., M. Karimi, M. G. R. Fahad, and R. Nazari. 2020. “Quantifying Environmental and Social Vulnerability: Role of Urban Heat Island and Air Quality, a Case Study of Camden, NJ.” Urban Climate 34: 100699. doi:10.1016/j.uclim.2020.100699.
- SINGH, S. M. 1984. “Removal of Atmospheric Effects on a Pixel by Pixel Basis from the Thermal Infrared Data from Instruments on Satellites.” The Advanced Very High Resolution Radiometer (AVHRR): International Journal of Remote Sensing 5: 161–183.
- Siqi, J., and W. Yuhong. 2020. “Effects of Land Use and Land Cover Pattern on Urban Temperature Variations: A Case Study in Hong Kong.” Urban Climate 34: 100693. doi:10.1016/j.uclim.2020.100693.
- Sobrino, J. A., J. C. Jiménez-Muñoz, and L. Paolini. 2004. “Land Surface Temperature Retrieval from LANDSAT TM 5.” Remote Sensing of Environment 90: 434–440. doi:10.1016/j.rse.2004.02.003.
- Sun, H. 2016. “Two-Stage Trapezoid: A New Interpretation of the Land Surface Temperature and Fractional Vegetation Coverage Space.” IEEE Journal of Selected Topics in Applied Earth Observations and Remote Sensing 9: 336–346. doi:10.1109/JSTARS.2015.2500605.
- Sun, F., M. Liu, Y. Wang, H. Wang, and Y. Che. 2020. “The Effects of 3D Architectural Patterns on the Urban Surface Temperature at a Neighborhood Scale: Relative Contributions and Marginal Effects.” Journal of Cleaner Production 258: 120706. doi:10.1016/j.jclepro.2020.120706.
- Takebayashi, H., and M. Senoo. 2018. “Analysis of the Relationship between Urban Size and Heat Island Intensity Using WRF Model.” Urban Climate 24: 287–298. doi:10.1016/j.uclim.2016.12.003.
- Tan, J., Y. Zheng, X. Tang, C. Guo, L. Li, G. Song, X. Zhen, et al. 2010. “The Urban Heat Island and Its Impact on Heat Waves and Human Health in Shanghai.” International Journal of Biometeorology 54: 75–84. doi:10.1007/s00484-009-0256-x.
- Ulpiani, G. 2021. “On the Linkage between Urban Heat Island and Urban Pollution Island: Three-decade Literature Review Towards a Conceptual Framework.” Science of the Total Environment 751: 141727. doi:10.1016/j.scitotenv.2020.141727.
- Wei, G., Z. Zhang, X. Ouyang, Y. Shen, S. Jiang, B. Liu, and B. He. 2021. “Delineating the spatial-temporal Variation of Air Pollution with Urbanization in the Belt and Road Initiative Area.” Environmental Impact Assessment Review 91: 106646. doi:10.1016/j.eiar.2021.106646.
- Weng, Q., D. Lu, and J. Schubring. 2004. “Estimation of Land Surface temperature–vegetation Abundance Relationship for Urban Heat Island Studies.” Remote Sensing of Environment 89: 467–483. doi:10.1016/j.rse.2003.11.005.
- Xie, P., J. Yang, W. Sun, X. Xiao, and J. Cecilia Xia. 2022. “Urban Scale Ventilation Analysis Based on Neighborhood Normalized Current Model.” Sustainable Cities and Society 80: 103746.
- Yang, Q., X. Huang, and Q. Tang. 2019. “The Footprint of Urban Heat Island Effect in 302 Chinese Cities: Temporal Trends and Associated Factors.” Science of the Total Environment 655: 652–662. doi:10.1016/j.scitotenv.2018.11.171.
- Yang, J., Y. Yang, D. Sun, C. Jin, and X. Xiao. 2021. “Influence of Urban Morphological Characteristics on Thermal Environment.” Sustainable Cities and Society 72: 103045. doi:10.1016/j.scs.2021.103045.
- Yu, X., X. Guo, and Z. Wu. 2014. “Land Surface Temperature Retrieval from Landsat 8 TIRS—Comparison between Radiative Transfer Equation-Based Method, Split Window Algorithm and Single Channel Method.” Remote Sensing 6: 9829–9852. doi:10.3390/rs6109829.
- Zeng, Y., X. F. Qiu, L. H. Gu, Y. J. He, and K. F. Wang. 2009. “The Urban Heat Island in Nanjing.” Quaternary International 208: 38–43. doi:10.1016/j.quaint.2009.02.018.
- Zhang, X., R. C. Estoque, and Y. Murayama. 2017. “An Urban Heat Island Study in Nanchang City, China Based on Land Surface Temperature and social-ecological Variables.” Sustainable Cities and Society 32: 557–568. doi:10.1016/j.scs.2017.05.005.
- Zhang, X., and P. Li. 2018. “A Temperature and Vegetation Adjusted NTL Urban Index for Urban Area Mapping and Analysis.” ISPRS Journal of Photogrammetry and Remote Sensing 135: 93–111.
- Zhang, Q., Z. Wu, H. Yu, X. Zhu, and Z. Shen. 2020. “Variable Urbanization Warming Effects across Metropolitans of China and Relevant Driving Factors.” Remote Sensing 12: 1500. doi:10.3390/rs12091500.
- Zhao, C., J. Jensen, Q. Weng, and R. Weaver. 2018a. “A Geographically Weighted Regression Analysis of the Underlying Factors Related to the Surface Urban Heat Island Phenomenon.” Remote Sensing 10: 1428. doi:10.3390/rs10091428.
- Zhao, H., H. Zhang, C. Miao, X. Ye, and M. Min. 2018b. “Linking Heat Source–Sink Landscape Patterns with Analysis of Urban Heat Islands: Study on the Fast-Growing Zhengzhou City in Central China.” Remote Sensing 10: 1268. doi:10.3390/rs10081268.
- Zhao, Z., A. Sharifi, X. Dong, L. Shen, and B. He. 2021. “Spatial Variability and Temporal Heterogeneity of Surface Urban Heat Island Patterns and the Suitability of Local Climate Zones for Land Surface Temperature Characterization.” Remote Sensing 13: 4338. doi:10.3390/rs13214338.
- Zheng, X., M. Gao, Z. Li, K. Chen, X. Zhang, and G. Shang. 2020. “Impact of 3-D Structures and Their Radiation on Thermal Infrared Measurements in Urban Areas.” IEEE Transactions on Geoscience and Remote Sensing 58: 8412–8426. doi:10.1109/TGRS.2020.2987880.
- Zhi, Y., L. Shan, L. Ke, R. Yang, and J. (. Xia. 2020. “Analysis of Land Surface Temperature Driving Factors and Spatial Heterogeneity Research Based on Geographically Weighted Regression Model.” Complexity 2020: 1–9. doi:10.1155/2020/2862917.
- Zhou, J., Y. Chen, J. Wang, and W. Zhan. 2011. “Maximum Nighttime Urban Heat Island (UHI) Intensity Simulation by Integrating Remotely Sensed Data and Meteorological Observations.” IEEE Journal of Selected Topics in Applied Earth Observations and Remote Sensing 4: 138–146. doi:10.1109/JSTARS.2010.2070871.
- Zhou, B., D. Rybski, and J. P. Kropp. 2017. “The Role of City Size and Urban Form in the Surface Urban Heat Island.” Scientific Reports 7(1): 4791 doi:10.1038/s41598-017-04242-2 .
- Zhou, W., S. T. A. Pickett, and M. L. Cadenasso. 2017. “Shifting Concepts of Urban Spatial Heterogeneity and Their Implications for Sustainability.” Landscape Ecology 32: 15–30. doi:10.1007/s10980-016-0432-4.
- Zhou, X., and H. Chen. 2018. “Impact of urbanization-related Land Use Land Cover Changes and Urban Morphology Changes on the Urban Heat Island Phenomenon.” Science of the Total Environment 635: 1467–1476. doi:10.1016/j.scitotenv.2018.04.091.