
 ?Mathematical formulae have been encoded as MathML and are displayed in this HTML version using MathJax in order to improve their display. Uncheck the box to turn MathJax off. This feature requires Javascript. Click on a formula to zoom.
ABSTRACT
Following field-based research and testing of residential buildings in Tibetan areas of western Sichuan, this study studied the interactions between and dynamic effects of geographic and meteorological elements. By quantifying the combined influence of geographical and meteorological elements on building orientation, the concept of the total orientation-based mean temperature difference was introduced, and a method for obtaining the optimum building orientation was provided based on an equation for calculating the average temperature difference by orientation. By quantifying the coupled influence of geographical and meteorological elements on building shape, an approach for optimizing building shape designs based on an equation for calculating the optimal building width was created. We found that a linear expression cannot be used to describe the quantitative relationship between the average indoor temperature and building orientation. When the horizontal solar radiation intensity was ≤6.44 MJ/m2 d, the primary consideration in building design was the shape coefficient. When the horizontal solar radiation intensity was >6.44 MJ/m2 d, the building width was the main evaluation index, and the shape coefficient was the auxiliary index. Based on the above findings, we propose a design scheme for optimizing the orientation and shape of buildings in major cities in western Sichuan.
1. Introduction
With a large population and relatively scarce resources, China’s major energy resources, such as coal, oil, and natural gas, are all below the world averages (Byrne, Shen, and Li Citation1996; Geng and Ji Citation2014). With the rapid development of China’s economy, the energy demand continues to grow; however, the efficiency of energy use is low, and long-standing coal-dominated energy consumption has caused great damage to the ecological environment (Zhang et al. Citation2019). As a result, environmental and resource-related issues are becoming more acute as the economy grows. The construction, utilization, and disposal of residential and nonresidential buildings are some of the main causes of energy consumption and pollution emissions, which have a large impact on the environment (Weißenberger, Jensch, and Lang Citation2014; Ascione et al. Citation2019). A large number of residential buildings in the Tibetan areas of western Sichuan lack scientific and rational designs relative to the climatic conditions in the areas. Relying on conventional fossil energy, which has a limited capacity and high cost, to solve winter heating problems will result in energy waste and damage to the ecological environment. Understanding how to make full use of the abundant local renewable energy resources, reduce the consumption of conventional energy and improve the indoor thermal environment has become an urgent requirement for local residents (Liu et al. Citation2021).
The main function of architecture is to create structures that are resistant to the unfavorable factors associated with natural climatic conditions and to provide a microclimate environment suitable for human production and living (MacNaughton et al. Citation2017). Regional climatic conditions have a strong influence on the planning and design of buildings (Abreu-Harbich, Labaki, and Matzarakis Citation2014). China’s Tibetan region of western Sichuan, with its complex geographical environment, is located in the western Sichuan Basin and the southeastern Qinghai-Tibet Plateau. With little cloud cover, many sunny days, and strong solar radiation, the western Sichuan Plateau is a region rich in solar resources according to China’s solar resource zoning; however, the solar radiation intensity varies widely, from a minimum of 500 kWh/m2 to a maximum of 900 kWh/m2. Building orientation and shape are important factors that affect the heat gain or loss of a building structure (Pacheco, Ordóñez, and Martínez Citation2012; Boukli Hacene and Chabane Sari Citation2020; Lapisa Citation2019). Studies have shown that optimizing building orientation and shape can save 36% of a building’s energy consumption (Aksoy and Inalli Citation2006), so it is necessary to quantify the building orientation and shape and geographical and meteorological factors (Dutta, Samanta, and Neogi Citation2017; Feng et al. Citation2016; Gagliano et al. Citation2014). The need to alter the indoor thermal environment of residential buildings in this region is mainly concentrated in winter, which is dry and cold, producing a poor indoor thermal environment, while summer is cool and humid. Therefore, when studying the orientation and shape of residential buildings in this area, the influence of solar radiation on the indoor thermal environment and heating demand in winter are the main considerations.
With the rapid development of computer hardware and software, many architects have adopted digital simulations for building design and energy conservation research (Crawley et al. Citation2008). Computer simulation not only has great advantages in calculation time and efficiency but also plays an irreplaceable role in simulating energy consumption while considering all its influencing factors. Building energy analysis software is the best aid for analyzing building energy consumption and guiding design to support building energy efficiency (Energy, Programss, and Energyplus Citation2012). Statistics show that there are currently more than 100 energy simulation software programs in use worldwide, such as BLAST, DOE-2, EnergyPlus, ESP-r and DeST(Crawley et al. Citation2001; Zhou, Hong, and Yan Citation2014; Strachan, Kokogiannakis, and Macdonald Citation2008). In recent years, various building energy analysis software programs have been used in building design optimization studies; for example, ESP-r software was used for simulation and prediction of energy-efficient building performance (Beausoleil-Morrison et al. Citation2012), EnergyPlus software was used in the energy-saving renovation of residential building envelopes (Friedman, Becker, and Erell Citation2014; Yu et al. Citation2015), and DeST software was used for energy analysis of public buildings (Sun et al. Citation2018). To accurately study the quantitative relationship between design factors and building energy efficiency, this study investigates the synergistic effects of geographic and meteorological elements and building orientation, shape, and other design parameters on indoor temperature and heating demand using dynamic simulation in EnergyPlus software and quantifies the combined effect of geographic and meteorological elements on building orientation.
At present, energy-saving building design involves many technical factors, from building envelope design to air conditioning and lighting systems (Fang et al. Citation2014; Li et al. Citation2019; Ng et al. Citation2001) and from building structure design to building materials and operation mode management (Rian and Asayama Citation2016; Pacheco-Torgal and Jalali Citation2011; Oti et al. Citation2016), all involving the awareness of the building energy-saving capacity concept. To improve the energy efficiency of private housing, several researchers have optimized building shapes, envelopes, and heating systems and studied the contributions of various design variables to building energy efficiency during the conceptual building design phase to guide architects in designing buildings with better energy efficiency (Tian et al. Citation2015; Harkouss, Fardoun, and Biwole Citation2018; Shi et al. Citation2016). Zhang et al. (Zhang, Zhang, and Wang Citation2016) used a multiobjective genetic algorithm to optimize the building shape; the study showed that compared with cube-shaped buildings, the total solar radiation gain of optimized free-form buildings increased by 30–53%. Gou et al. (Gou et al. Citation2018), through the construction of a multiobjective optimization model and sensitivity analysis, found that in building orientation design, a lower long axis azimuth value is conducive to improving indoor thermal comfort and building energy saving performance. Abdou et al. (Abdou et al. Citation2021) achieved energy savings and thermal comfort by optimizing design parameters such as the building orientation, window-to-wall ratio, thermal insulation and permeability of walls and roofs; the study found that energy savings of more than 21% could be achieved through multiobjective optimization of passive energy efficiency measures. Khamma & Boubekri (Khamma and Boubekri Citation2017) analyzed the effect of building shape and orientation on the energy performance of buildings in Chicago, Illinois, USA, through numerical simulations; the building form was found to have a significant impact on energy use and designs that properly consider climate issues were found to improve energy performance. The results of these studies show that different building design parameters have significantly different effects on building energy consumption; however, relatively little consideration has been given to the effects of solar radiation on energy consumption in residential buildings. There are relatively few studies on the relationship between building orientation, shape, and energy savings, and the influence of environmental climate factors on buildings and the corresponding quantitative relationships among these factors have not been systematically considered. However, improving the energy efficiency of buildings during the design stage can play a significant role in improving the energy efficiency of those buildings. Considering the impacts of solar radiation on building energy consumption, the quantitative relationship between residential building design parameters and building energy efficiency in western Sichuan was studied in this research, and the basic research work of designing energy-efficient residential buildings was updated.
Taking residential buildings in the Tibetan areas of western Sichuan as the research object, this study systematically studied the synergistic effect of local geographical and meteorological factors and design parameters, such as the orientation and shape of residential buildings, on indoor temperature and heating demand, aiming to effectively improve the energy saving levels of local buildings through a passive design strategy. First, by quantifying the influences of geographic and meteorological factors such as solar radiation, temperature, humidity, and latitude on building orientation, a formula for determining the average temperature difference depending on the building orientation was obtained; subsequently, a method for optimizing the orientation of local residential buildings was proposed. Second, by quantifying the roles that geographic and meteorological elements play in determining the optimal building shape, design principles associated with building shape and methods for assessing design parameters were proposed; then, a design scheme based on the optimal shape of residential buildings in major cities in western Sichuan was proposed. Finally, this study provides certain design methods and theoretical bases for architects to design low-energy residential buildings in this area and has a positive effect on promoting the sustainable development of residential buildings. The procedure followed in this study is depicted in .
Figure 1. Research flow chart.
2. Experiments and methods
2.1. Study area
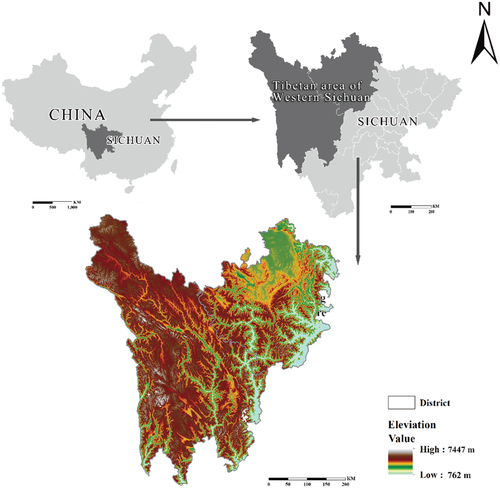
The Tibetan region of western Sichuan mainly includes the Tibetan agglomeration in western Sichuan, including Ganzi, Aba, and Muli Tibetan Autonomous County in Liangshan. With a total of 32 counties and an area of 251,000 km2, this region accounts for approximately half of the area of Sichuan Province. The geographical environment of the region is complex, and the climate is diverse. The elevation of the Tibetan region in western Sichuan varies greatly, with an average elevation above 2500 m, making it a high-elevation region (). The solar radiation in the Tibetan region of western Sichuan also varies greatly, with values of approximately 4500 ~ 5400 MJ/m2 a in the eastern area, 5400 ~ 5800 MJ/m2 a in the central area, and 5800 ~ 6500 MJ/m2 a in the northwestern area. Conventional energy consumption levels can be reduced in the region without affecting indoor thermal comfort by utilizing the abundant local solar energy resources and adapting measures to local conditions (He et al. Citation2015). The climate of the region is diverse. The southeastern part of the region belongs to the high mountain valley zone, and the climate varies with altitude. In areas with low altitudes, the climate is subtropical, while in areas with high altitudes, the climate is cold, with snow year-round. The central part of the region belongs to the mountain plain zone, and the climate is humid and warm in summer and dry and cold in spring and winter, with an annual average temperature between 5.6 °C and 8.9 °C. The northwestern part of the region belongs to the hilly plateau zone, with dry and cold winters and cool and wet summers, and the annual average temperature ranges from 0.8 °C to 4.3 °C. Given the complex geographic and meteorological conditions of this region, developing passive energy-saving technologies, optimizing building orientation and shape and making efficient use of local solar energy and other favorable meteorological resources are significant approaches to save energy and protect the ecological environment.
Figure 2. Location of the study area.
2.2. Survey and test
2.2.1. Survey
The residential buildings in the Tibetan areas of western Sichuan mainly include local traditional dwellings and residential buildings in modern cities. The research team entered the Tibetan region of western Sichuan on two occasions to conduct research and take measurements. They conducted in-depth research on the architecture of both traditional dwellings and residential buildings in the cities. In the first survey, which was administered from November 25 to 10 December 2020, the state of urban residential buildings in the Tibetan region of western Sichuan as well as the layout, orientation, and construction of traditional residential buildings were investigated. This survey provided a basis for the setting of the building orientation and shape design parameters in the subsequent energy consumption simulations. In the second survey, which was administered from January 10 to 21 January 2021, based on the findings of the first survey, Kangding and Ganzi were selected as the areas to test and study the indoor and outdoor thermal environments and the heating processes of the building envelopes. Considering climate, altitude, transportation, and other factors, a total of 36 residences were ultimately investigated, including 6 in pastoral areas, 12 in forest areas, and 18 in agricultural areas. These samples covered the cold and severely cold areas in the Tibetan region of western Sichuan. Through questionnaires, field tests, and photos, the research subjects were mapped, and experimental data were obtained. The second survey was conducted to further identify architectural models for optimizing the orientation and shape of residential buildings in the Tibetan areas of western Sichuan.
2.2.2. Test
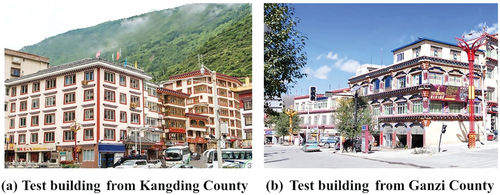
In this study, considering the solar radiation intensity and traffic accessibility, Kangding and Ganzi were selected as the test subjects, as shown in . The number of sunshine hours in Kangding County is only 1697 hours per year, while in Ganzi, it reaches 2631 hours per year; therefore, these counties reflect the two extremes of solar radiation in this area. The residential building selected for testing in Kangding County has a total of five floors, with the testing area located on the fifth floor. The walls of this building consist of frames and aerated concrete blocks, and its roof consists of reinforced concrete, a leveling layer, a waterproofing layer, and a surface layer. The selected residential building in Ganzi County has a total of four floors, with the testing area located on the third floor. The walls of this building consist of frames and aerated concrete blocks, and the roof consists of reinforced concrete, a leveling layer, a waterproofing layer, and a surface layer. The test was conducted for 168 consecutive hours, between 4 p.m. on 14 January 2021, and 4 p.m. on 21 January 2021. The test period was characterized by typical local winter weather and clear skies, and there were no unusual weather conditions during the week prior to the test.
Figure 3. Photos of the test subjects.
Two types of test data were collected. The first was related to the heat flux density of the walls. These data were collected on the inner and outer surfaces of the south wall, north wall, east wall, and roof; measurements were taken at points on the walls that were 1.2 m from the ground and not less than 0.5 m from windows and partition walls. The second type of data was related to the indoor and outdoor temperatures. The indoor instrument was placed in the center of a room at a height of 1.5 m, and furniture was removed from around the instrument; the outdoor instrument was placed on the roof at a height of 1.5 m and in an area free from obstructions. The sampling time of the heat flux monitoring instruments was set to an interval of 1 minute, and data were recorded continuously for 24 hours; the sampling intervals for the temperature and humidity monitoring instruments were 10 minutes, and data were recorded continuously for 24 hours. During the test, all the rooms, doors and windows remained closed, and no heating or heat-producing equipment was used to prevent personnel interference with the data. The main instruments employed in this experiment were a heat flow density meter and temperature and humidity recorder. All the instruments met the accuracy requirements and were calibrated before the test. The specific parameters of the instrument are shown in .
Table 1. Basic technical parameters of the measurement equipment.
The objectives of the field survey and test were (i) to collect quantitative information on residential buildings in the Tibetan region of western Sichuan in terms of site selection, shape, orientation, layout, and building materials, to summarize the passive design schemes of local traditional residential buildings and to provide new ideas for energy-saving designs of modern residential buildings; (ii) to understand the indoor thermal environmental conditions faced by local residents; and (iii) to verify the applicability of energy consumption simulation software in the region and to determine the building model needed to perform quantitative analysis of thermally optimized designs for low-energy residential buildings in the Tibetan region of western Sichuan.
2.3. Selection of energy consumption simulation software and the building model
2.3.1. Building energy consumption simulation software
Building energy consumption simulation software consists of computer programs for calculating dynamic thermal processes based on physical and mathematical models of these processes in buildings. EnergyPlus software adopts the thermal conductivity transfer function method and the heat balance method to calculate the wall heat transfer and cooling and heating loads. It uses advanced heat transfer calculations for windows that can simulate controlled shading devices, adjustable photochromic glazing, etc.; at each time step, the program calculates convection, radiation, and moisture transfer starting from the building’s interior surfaces. In addition, the computational core of EnergyPlus is a DOS program; therefore, the software facilitates batch control and is suitable for the iterative computation of a large number of adjustment parameters. Thus, in this study, EnergyPlus software was used to investigate residential buildings in the Tibetan areas of western Sichuan.
2.3.2. Validation of the simulation software suitability
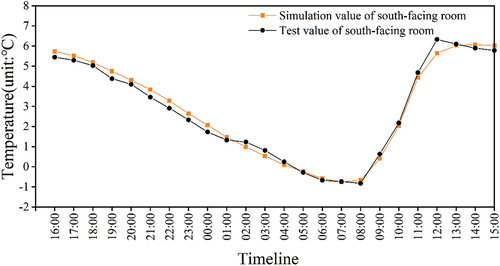
To verify the suitability of the simulated boundary conditions and software settings, we compared EnergyPlus simulations and actual measurements of the indoor temperature of a residential building in Ganzi County. A digital model of the building was established based on its basic structural information, and the indoor thermal conditions of the building were simulated by EnergyPlus using local meteorological data measured in Ganzi. The comparison curves of the simulation results and the measured data are shown in . These figures show that the simulated data and the measured data have basically the same variation trend, the differences among the data are small, and the average relative error is within 10%, which meets the simulation requirements. Because the main objective of this paper is optimization, the software error and the small difference between the examined data and real data do not affect the final findings. The thermal parameters and boundary conditions of the model are therefore reasonable, and EnergyPlus software is suitable for use with information from the high-altitude area of western Sichuan. Therefore, EnergyPlus software was used in this research to study the building thermal performance.
Figure 4. Simulated and measured temperatures of north-facing rooms.
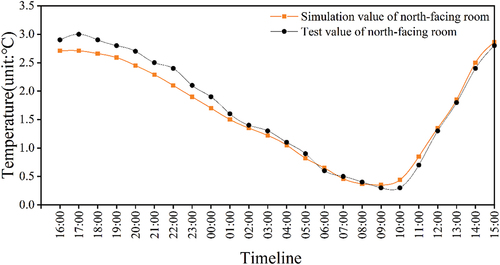
Figure 5. Simulated and measured temperatures of south-facing rooms.
2.3.3. Architectural modeling and parameter determination
There are many types of buildings, and the conclusions of thermal design studies based on different building types may be completely different. Therefore, in this study, the characteristics of low-energy residential buildings and the current states of local buildings were considered, reasonable abstractions were made, and the building model needed to perform quantitative analysis of the thermal design of low-energy residential buildings in the Tibetan areas of western Sichuan was determined. A physical model of low-energy residential buildings should be broadly representative. The Tibetan area of western Sichuan is relatively rich in solar energy resources, and the low-energy residential buildings there can be regarded as passive solar buildings. In terms of heat collection methods, passive solar buildings can be divided into the following three categories: those with direct benefits, those with heat collection and wall storage, and those with sunlit rooms. Since buildings with direct solar benefits are characterized as having high collection efficiency, low construction costs, and a universal distribution, this building type was selected as the model in this study; this building type is largely representative of the local buildings in the Tibetan region of western Sichuan.
Through research on the existing residential buildings in the Tibetan area of western Sichuan, a large number of construction parameters were obtained for local buildings, from which three representative buildings were selected, as shown in .
Table 2. Basic parameters of typical low-energy dwellings in the Tibetan areas of western Sichuan.
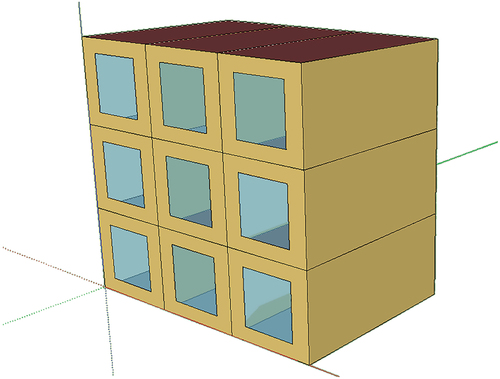
As shows, the typical local low-energy residential buildings are dominated by strip-type buildings. Existing research results show that the length and width of a building have a certain impact on the indoor thermal environment, but the bay size has a small effect. The width of a building will influence the solar energy obtained per unit building area, where a greater width will reduce the indoor thermal comfort. Therefore, from the perspective of using solar energy, the width of a building should not be too large; however, due to the functional requirements of the living space, the width should not be too small. Low-energy residential buildings should conform to people’s habits but should also make full use of solar energy resources (Sowell and Haves Citation2001). Therefore, the physical model for low-energy residential buildings used in this study has the following characteristics: a north–south orientation; an initial width of 9 meters; a total of three bays, with each bay measuring 3.3 meters; and a story height of 3 meters (). This arrangement can simulate both the rooms with unfavorable conditions and the most favorable rooms in the middle of the structure while also minimizing the computational effort needed for the simulation.
Figure 6. Building model.
The thermal parameters were adopted from the values specified for cold areas in the Energy-saving Design Standards for Residential Buildings in Sichuan Province. Both the external walls and the roof insulation system rely on extruded polystyrene (XPS) external insulation technology, and the heat transfer coefficients are 0.50 W/m2 K and 0.40 W/m2 K, respectively. The floor insulation system relies on XPS insulation technology, with a total thermal resistance of 0.83 m2 K/W. The thermal parameters of the doors and windows are shown in .
Table 3. Thermal parameters of doors and windows.
In summary, the values simulated by EnergyPlus software are basically consistent with the measured values, and the differences in absolute values are small, confirming that EnergyPlus is suitable for building energy consumption simulation studies in high-altitude areas. By researching and taking measurements in residential buildings in the Tibetan areas of western Sichuan, a physical model and relevant parameters of typical local buildings were determined, providing a basis for subsequent quantitative research on building thermal design.
2.4. Determination of model settings
2.4.1. Determination of building orientation model settings
In practice, the determination of the building orientation is not only related to solar radiation but is also influenced by factors such as topography, layout, and locally dominant winter wind directions. However, since the low-energy residential buildings in the Tibetan areas of western Sichuan studied in this paper are mainly passive solar buildings, the focus is on how to fully utilize the available solar energy resources, and the influence of the dominant winter wind direction on the building orientation is not within the scope of this paper. According to a theory related to the dynamic thermal process of buildings, meteorological elements such as humidity and atmospheric pressure have almost no influence on building orientation, so only the influence of solar radiation on the building orientation is studied here (Saeed Citation1987). To study the coupling effect of orientation and outdoor meteorological elements on indoor temperature, the average indoor temperatures of buildings with different orientations under different outdoor meteorological conditions were simulated. Building orientation, calculated as the angle between the short axis of the building and north, was simulated every 15° from 0° to 360° for a total of 24 model settings.
The effects of solar radiation on buildings are related not only to the total amount of thermal radiation from the sun but also to the angle between the sun’s rays and the building surface. Therefore, two factors were included when setting the model climate parameters, namely, total solar radiation and latitude (Cholewa et al. Citation2021). The total amount of outdoor horizontal solar radiation varies from low to high. Generally, the solar radiation intensity does not exceed 30 MJ/m2 d, so when setting the solar radiation intensity variation in this research, the maximum value was set to only 31.8 MJ/m2 d, with a total of 19 model settings. The geographical latitude of the western Sichuan region ranges between 28° and 35°, and the latitude setting should include this entire region; therefore, the latitude was set from 26° to 43° (north latitude), with every degree simulated once, for a total of 18 model settings.
2.4.2. Determination of building shape model settings
The meteorological parameters related to the building shape design should include factors such as solar radiation, outdoor temperature, and the dominant wind direction in winter. Since this paper focuses on the shape design of low-energy residential buildings, the influence of wind on the indoor thermal environment is not within the research scope. Therefore, the building shape model settings in this study mainly included changes in the building shape, solar radiation intensity, and average outdoor temperature. The building shape changes mainly included changes in the length and width of the building. The building shape was simulated once for each building width increase of 0.3 m over the range of 3.3 ~ 10.2 m, for a total of 24 model settings. The building shape was also simulated once for each 0.3 m increase in bays over the range of 3.3 ~ 6.6 m, for a total of 12 model settings. When setting the climatic parameters, the building shape model settings included the following two components: total solar radiation and latitude. The outdoor horizontal total solar radiation varied from low to high, with a total of 10 model settings. The latitude was simulated every 2°, ranging from 26° to 42° (north latitude), for a total of 9 model settings. The parameters related to the outdoor average temperature were mainly determined by the range of variation in the average outdoor temperature in winter in the severely cold and cold regions of the Tibetan areas of western Sichuan; the temperature range was from −10°C to 4°C, and a simulation was performed for every 2°C change for a total of 8 model settings.
3. Result
3.1. Quantitative analysis of the influences of geographical and meteorological elements on building orientation
3.1.1. The quantitative relationship between the total orientation-based mean temperature difference and solar radiation and latitude
In this study, based on the high-performance computing platform of the research institution, the simulation process included both automated and manual settings, where the meteorological parameters were automatically set and the other parameters were manually adjusted. To improve the accuracy of the simulation results, a total of 8,208 simulations were conducted, which took approximately 2 weeks. To quantify the influences of geographic and climatic factors on building orientation, a new concept was introduced in this study, namely, the total orientation-based mean temperature difference (TOMTD). The TOMTD is defined as the difference between the average indoor temperature of the best orientation and the worst orientation of residential buildings in a certain area at a given geographic latitude and solar radiation intensity; TOMTD can be used to gain insight into the sensitivity of the energy-saving status of residential buildings to orientation and, thus, provide support for further building orientation design optimization. Every 1°C increase in indoor temperature was found to increase energy consumption by approximately 6.6%~9.8%, and indoor temperature was found to have a greater impact than other factors on heating energy consumption in buildings; therefore, the basic indoor temperature should be increased as much as possible during the building design stage, and the additional heating provided by heating equipment should be reduced to reduce heating energy consumption in buildings. In this study, the area where the average temperature difference due to orientation is not more than 3°C is called the building orientation insensitive area; within this area, building orientation can be disregarded during building design.
The TOMTD was obtained by collating all the data from the simulation. The results of a linear regression showed a strong linear correlation between the TOMTD and local solar radiation and latitude, with a goodness of fit of 0.955, and the ANOVA table is shown in . The following quantitative relationship was obtained.
Table 4. ANOVA table for the TOMTD regression model.
where y represents the TOMTD (°C), x1 is the local solar radiation intensity (MJ/m2 d), and x2 is the local latitude (degrees).
This study showed that when TOMTD ≤ 3°C, the area is not sensitive to building orientation. By entering this value into formula (1), it was determined that when , the architectural design of the area is not reliant on building orientation.
3.1.2. The relationship between indoor temperature and solar radiation and orientation
shows the simulated relationship between indoor temperature and solar radiation and building orientation. The local geographic latitude is 30° north. This figure shows that when solar radiation is small, building orientation has relatively little influence on the average indoor temperature; as solar radiation increases, the relationship between the indoor temperature and the orientation becomes stronger.
Figure 7. Relationship between the mean indoor temperature and solar radiation and orientation. SR represents the solar radiation settings, and the radiation intensity gradually increased from SR-1 to SR-19.
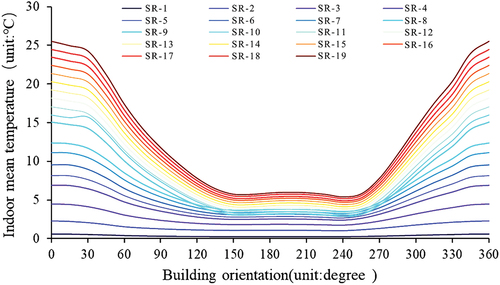
The calculations based on formula (1) indicate that when the solar radiation is below 5.83 MJ/m2 d, the building orientation has little influence on the average indoor temperature. The temperature difference between the optimal southern orientation and the worst northern orientation is less than 3°C, and the architectural designs of buildings in this area are therefore not reliant on building orientation.
3.2. Quantitative analysis of the influences of geographic and meteorological elements on building shape
3.2.1. The relationship between the southern wall area-to-ground area ratio and the average indoor temperature
To improve the accuracy of the simulations, a total of 25,920 settings were simulated, which took approximately 6 weeks. A linear regression was performed for the average indoor temperature, southern wall area-to-ground area ratio (WGR), latitude, and average outdoor temperature, and the results showed that these four factors are strongly and linearly correlated, with R2 values greater than 0.95 (). The intercept of each linear equation increased with the increase in solar radiation, indicating that the average indoor temperature was also elevated by the increase in solar radiation. The coefficient of the southern WGR increased and shifted from a positive value to a negative value with the increase in the solar radiation intensity, indicating that the average indoor temperature decreased with the increase in the southern WGR when the solar radiation intensity was low; when the solar radiation intensity was high, the average indoor temperature increased with the increase in the southern WGR. The coefficient of the regression with latitude also increased as the solar radiation intensity increased, indicating that the influence of latitude on the average indoor temperature is greater when the solar radiation intensity is higher. The coefficient of the regression with mean outdoor temperature was almost unchanged, indicating that the influence of the mean outdoor temperature on the mean indoor temperature was almost unchanged by the increase in solar radiation. Moreover, in this study, linear regression analyses were performed for the average indoor temperature with the shape coefficient, latitude, and average outdoor temperature, and the results obtained were the same as those reported above.
Table 5. Linear relationships between the average indoor temperature and the southern wall area-to-ground area ratio, latitude, and average outdoor temperature.
The findings from this study show that the relationship between the southern WGR, the shape coefficient, and the average indoor temperature increased with the increase in solar radiation and changed from negative correlations to positive correlations. The linear regression of the regression coefficients of solar radiation intensity, southern WGR, and shape indicated that when the solar radiation intensity was not greater than 6.44 MJ/m2 d, the average indoor temperature was negatively correlated with the shape coefficient. The smaller the coefficient was, the higher the average indoor temperature; when the solar radiation intensity was greater than 6.44 MJ/m2 d, the average indoor temperature was positively correlated with the southern WGR. The greater the southern WGR was, the higher the average indoor temperature (). The following is a detailed description of the southern WGR.
Figure 8. The correlations between the southern wall area-to-ground area ratio, the building shape coefficient and the average indoor temperature.
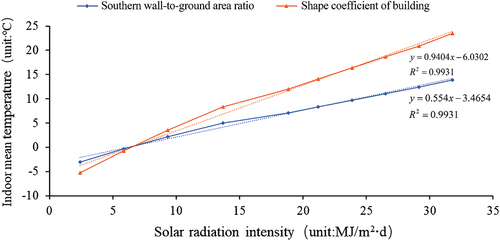
The southern WGR is essentially the ratio of a building’s story height to its width. The story height of local residential buildings is generally 3 m. Therefore, the southern WGR can be simplified into a building width design, as shown below.
where L represents the building length (m), H represents the story height (m), N represents the number of floors, and W represents the building width (m).
3.2.2. The relationship between building width and average indoor temperature
The width of the simulated building ranged from 3.3 m to 10.2 m, with increases of 0.3 m. To quantify the influences of geographical and climatic factors on the building shape, we introduced the concept of differences in the mean indoor temperature with various widths (MITD). MITD is defined as the difference between the average indoor temperature at the smallest width and the average indoor temperature at the largest width of residential buildings in a certain area under the conditions of given geographical latitude, solar radiation intensity and average outdoor temperature. MITD can be used to understand the sensitivity of the energy saving state of residential buildings to the building width, thus providing support for further building shape design optimization. The correlation between the MITD and the solar radiation, geographic latitude, and average outdoor temperature was determined based on 512 sets of data. The R2 of the correlation was 0.995, indicating that there was a strong linear correlation between the MITD and the solar radiation, geographic latitude and average outdoor temperature, and the ANOVA table is shown in ; this regression equation is shown in formula (3).
Table 6. ANOVA table for the MITD regression model.
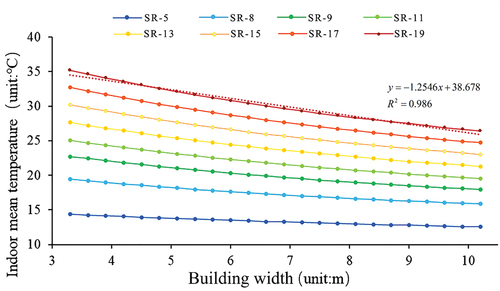
Based on the principle of maximizing solar energy use, in this study, an average indoor temperature difference of not more than 3°C depending on various building widths was used as a criterion to judge whether a building shape design is reasonable. shows that when the thermal design of a building and the average outdoor temperature remain unchanged, the average indoor temperature has a strong linear correlation with the width of the building. Therefore, we can determine the building width corresponding to a 3°C difference in average indoor temperature by the proportional relationship. The appropriate building width can be obtained using the solution to formula (3) and , and the formula for determining the building width is shown below.
Figure 9. Linear relationship between the building width and average indoor temperature. The solar radiation intensity gradually increases from SR-5 to SR-19.
4. Discussion
4.1. The optimal orientation of residential buildings in major cities in western Sichuan
Some researchers have studied the influence of building orientation on the total energy consumption of buildings in specific areas as the main design parameter and obtained the optimal building orientation at the lowest energy efficiency, but the calculation process is often complicated, and no specific optimization scheme has been proposed (Gou et al. Citation2018; Delgarm et al. Citation2016; Ferdyn-Grygierek and Grygierek Citation2017; Li, Wang, and Cheung Citation2018). This study not only gives the optimal building orientation but also provides a suitable range of building orientations, which provides designers with a reference for building orientation when designing buildings. As shown in , the relationship between the average indoor temperature and building orientation is not linear; that is, linear expressions cannot be used to describe the quantitative relationship between average indoor temperatures and building orientations. It is difficult to accurately calculate the temperature difference due to building orientation when the orientations deviate from due south. Therefore, in this research, an approximation method was adopted to determine the optimal orientation and suitable orientation for a certain area.
According to the analyses described above, when the solar radiation of an area was ≤5.83 MJ/m2 d, i.e., when the TOMTD was ≤3°C, the energy efficiency of the buildings in the area was not sensitive to orientation. When 5.83 MJ/m2 d < solar radiation ≤ 13.70 MJ/m2 d, i.e., when 3°C < TOMTD ≤ 8.79°C, the decrease in the average indoor temperature was lower among buildings facing 30° east of south or 15° west of south and the average indoor temperature decreased slightly when the orientation deviated from due south; among the buildings facing 45° east of south or 30° west of south, the average indoor temperature decreased by approximately 3°C compared to that among buildings oriented due south. Therefore, the best orientation in this type of area is 30° east of south and 15° west of south; suitable orientations in this type of area are within the range of 30° to 45° east of south or 15° to 30° west of south. When the solar radiation ≥ 13.70 MJ/m2 d, i.e., when the TOMTD > 8.79°C, among buildings oriented 15° east of south or 10° west of south, the average indoor temperature decreased less than in buildings oriented due south; among buildings oriented 30° east of south or 15° west of south, the average indoor temperature decreased by approximately 3°C compared to that among buildings oriented due south. Therefore, the best orientation in this type of area is 15° east of south or 10° west of south; suitable orientations in this type of area are within the range of 15° to 30° east of south or 10° to 15° west of south. The optimal orientation and suitable orientation of a city can be determined by entering the city’s average daily radiation and latitude values into formula (1), as shown in .
Table 7. Optimal orientations and suitable orientations of major cities in the Tibetan areas of western Sichuan.
4.2. The optimal shape design for residential buildings in major cities in western Sichuan
In the Energy Conservation Design Standards for Residential Buildings in Severely Cold and Cold Regions, there are generally regulations that state building size restrictions. If calculated by the steady-state method, then the smaller the shape coefficient is, the smaller the external surface area corresponding to the unit volume enclosed by the building, and the smaller the heat exchange between the building and the outdoor environment under the same conditions. This is favorable in scenarios in which there is relatively little solar radiation. However, in areas with abundant solar radiation, there is a need for more solar radiation effects indoors, which requires a larger south-facing area. Therefore, it is necessary to analyze whether it is better to obtain as much solar radiation as possible or reduce the outer surface area of the enclosure, given the amount of available solar radiation. At present, many researchers have studied the influence of building shape on building energy consumption, often using multiobjective optimization or genetic algorithms to solve for the optimal shape coefficient of a building (Jalali, Noorzai, and Heidari Citation2020; Fang and Cho Citation2019); these studies are also aware of the influence of climatic conditions on building shape design (Zhai and Helman Citation2019; Andrić et al. Citation2017) but rarely examine how solar radiation and geographical latitude affect building shape design and do not provide a reference range for the suitability of shape design (Ciardiello et al. Citation2020). In this study, through a dynamic simulation with EnergyPlus software, the principles of building shape design in areas with abundant solar energy were obtained by integrating the effects of various geometeorological factors.
The quantitative analysis of the influences of geographical and meteorological elements on building shape design showed that when the horizontal solar radiation intensity was not greater than 6.44 MJ/m2 d, the average indoor temperature decreased with the increase in the building shape coefficient. Therefore, the primary consideration for building shape design in this area is the shape coefficient. The smaller the shape coefficient is, the better the thermal performance of the building is. Currently, the building shape design should be determined according to the regulations for the building shape coefficient in the energy-saving design code for residential buildings. When the horizontal solar radiation intensity was greater than 6.44 MJ/m2 d, the average indoor temperature increased with the increase in the southern WGR. Therefore, when designing the shapes of buildings in this type of area, building width should be the main evaluation index, and the shape coefficient should be the auxiliary index. The suitable widths of buildings in major cities in western Sichuan can be obtained from formula (3). The thermal performances of buildings should meet the Energy Conservation Design Standards for Residential Buildings in Severely Cold and Cold Regions, and this formula is applicable to geographical regions with latitudes between 26° and 42°. From the analyses, we obtained the optimal shape designs for residential buildings in major cities in the Tibetan region of western Sichuan, as shown in .
Table 8. Optimal residential building shape designs in major cities in the Tibetan areas of western Sichuan.
In conclusion, few studies have been conducted specifically on the optimal design of building orientation and body shape for energy efficiency, and most of them have only studied the energy efficiency of buildings by using building orientation and body shape as one of several optimization parameters (Pathirana, Rodrigo, and Halwatura Citation2019; Monteiro, Freire, and Soares Citation2021). Similar to this study, Fallahtafti & Mahdavinejad determined the optimal building orientation according to the perspective of the building receiving the most energy in general and analyzed the relationship between the building shape and its optimized orientation (Fallahtafti and Mahdavinejad Citation2015). However, it neither introduced geometeorological data into the simulation nor provided an optimization scheme for the shape of the building. This paper systematically studies the synergistic process of geographic and meteorological factors and design parameters such as building orientation and shape. By quantifying the coupling influence of geographic and meteorological factors on building orientation and shape, this is the first study to propose an energy-saving design optimization scheme for residential building orientation and shape in major cities in western Sichuan.
5. Conclusion
The Tibetan areas of western Sichuan are cold in winter and cool in summer, and residential buildings need heating in winter but not air conditioning in summer. Based on the geographic and climatic characteristics of the Tibetan areas of western Sichuan, this study conducts theoretical analysis and numerical simulation of the relevant parameters for the design of low-energy residential buildings so that energy-saving methods can be organically integrated into the building design to maximize the use of renewable energy and reduce conventional energy consumption; additionally, an optimal design plan for the orientation and shape of low-energy residential buildings suitable for the local area is created. In this paper, the EnergyPlus dynamic simulation method was used to quantitatively study the coupling relationship between building orientation, building shape, and geographic and meteorological factors, thus determining the quantitative relationships among these factors. The main conclusions are as follows.
(i) In this study, we introduced the TOMTD concept, quantified the influence of solar radiation and latitude on building orientation, and created a formula for finding the TOMTD values of buildings. On this basis, we found that the relationship between building orientation and average indoor temperature is not linear, and a linear expression cannot be used to express the quantitative relationship between building orientation and average indoor temperature. In addition, we introduced the MITD concept, quantified the effect of solar radiation intensity, geographical latitude, and average outdoor temperature on building width, and created an equation to calculate the MITD value of a building. Based on this, we found a strong linear relationship between building depth and average indoor temperature so that the corresponding building width can be obtained by a proportional relationship for a given temperature difference.
(ii) Based on the mathematical relationships between important parameters, we propose a building orientation optimization method. When the TOMTD was ≤ 3°C, the buildings in this region were not sensitive to orientation; when 3°C < the TOMTD ≤ 8.79°C, the areas of optimal orientation were from due south to 30° south by east and from due south to 15° south by west; and when the TOMTD > 8.79°C, the areas of optimal orientation were from due south to 15° south by east and from due south to 10° south by west. According to the building orientation optimization method, we proposed a plan for determining the optimal orientation of residential buildings in major cities in western Sichuan.
(iii) Through the quantitative study of the influence of geographic and meteorological factors such as solar radiation, temperature, and latitude on the shapes of buildings, building shape design principles were proposed. When the solar radiation intensity is not greater than 6.44 MJ/m2 d, the shape coefficient should be used as the main evaluation standard in building shape design. When solar radiation is greater than 6.44 MJ/m2 d, the building width should be the main evaluation criterion in building shape design, and the shape coefficient should be used as an auxiliary criterion. Based on the concept of MITD, a formula for calculating the optimal building width that is suitable for residential buildings in the Tibetan areas of western Sichuan was constructed. According to this formula, we provided optimal building designs for residential buildings in major cities in western Sichuan.
Different regions have different building types and geographic and meteorological characteristics, and one set of energy-saving optimization design solutions is not suitable for all regions. Therefore, this study mainly provides certain design methods and theoretical bases for architects to design and research low-energy residential buildings in areas with the same characteristics; in addition, this study provides a new research idea for subsequent research in energy-saving optimization of residential buildings under multifactor coupling. In conclusion, this study provides concrete support for the design of low-energy residential buildings through the energy-saving optimization design of building orientation and shape and has some practical value for the sustainable development of low-energy buildings.
Disclosure statement
The authors declare that they have no known competing financial interests or personal relationships that could have appeared to influence the work reported in this paper.
Additional information
Funding
References
- Abdou, N., Y. E. Mghouchi, S. Hamdaoui, N. E. Asri, and M. Mouqallid. 2021. “Multi-objective Optimization of Passive Energy Efficiency Measures for net-zero Energy Building in Morocco, Build.” Environment 204: 108141. doi:10.1016/j.buildenv.2021.108141.
- Abreu-Harbich, L. V., L. C. Labaki, and A. Matzarakis. 2014. “Thermal Bioclimate as a Factor in Urban and Architectural Planning in Tropical climates-The Case of Campinas, Brazil.” Urban Ecosystems 17 (2): 489–500. doi:10.1007/s11252-013-0339-7.
- Aksoy, U. T., and M. Inalli. 2006. “Impacts of Some Building Passive Design Parameters on Heating Demand for a Cold Region, Build.” Environment 41: 1742–1754. doi:10.1016/j.buildenv.2005.07.011.
- Andrić, I., A. Pina, P. Ferrão, J. Fournier, B. Lacarrière, and O. Le Corre. 2017. “The Impact of Climate Change on Building Heat Demand in Different Climate Types.” Energy and Buildings 149: 225–234. doi:10.1016/j.enbuild.2017.05.047.
- Ascione, F., N. Bianco, G. Maria Mauro, and D. F. Napolitano. 2019. “Building Envelope Design: Multi-objective Optimization to Minimize Energy Consumption, Global Cost and Thermal Discomfort. Application to Different Italian Climatic Zones.” Energy 174: 359–374. doi:10.1016/j.energy.2019.02.182.
- Beausoleil-Morrison, I., M. Kummert, F. MacDonald, R. Jost, T. McDowell, and A. Ferguson. 2012. “Demonstration of the New ESP-r and TRNSYS co-simulator for Modelling Solar Buildings.” Energy Procedia 30: 505–514. doi:10.1016/j.egypro.2012.11.060.
- Boukli Hacene, M. A., and N. E. Chabane Sari. 2020. “Energy Efficient Design Optimization of a Bioclimatic House.” Indoor and Built Environment 29 (2): 270–285. doi:10.1177/1420326X19856668.
- Byrne, J., B. Shen, and X. Li. 1996. “The Challenge of Sustainability: Balancing China’s Energy, Economic and Environmental Goals.” Energy Policy 24 (5): 455–462. doi:10.1016/0301-4215(96)00011-0.
- Cholewa, T., A. Malec, A. Siuta-Olcha, A. Smolarz, P. Muryjas, P. Wolszczak, Ł. Guz, M. R. Dudzińska, and K. Łygas. 2021. “On the Influence of Solar Radiation on Heat Delivered to Buildings for Heating.” Energies 14 (4): 1–16. doi:10.3390/en14040851.
- Ciardiello, A., F. Rosso, J. Dell’Olmo, V. Ciancio, M. Ferrero, and F. Salata. 2020. “Multi-objective Approach to the Optimization of Shape and Envelope in Building Energy Design, Appl.” Energy 280: 115984. doi:10.1016/j.apenergy.2020.115984.
- Crawley, D. B., J. W. Hand, M. Kummert, and B. T. Griffith. 2008. “Contrasting the Capabilities of Building Energy Performance Simulation Programs, Build.” Environment 43: 661–673. doi:10.1016/j.buildenv.2006.10.027.
- Crawley, D. B., L. K. Lawrie, F. C. Winkelmann, W. F. Buhl, Y. J. Huang, C. O. Pedersen, R. K. Strand, et al. 2001. “EnergyPlus: Creating a new-generation Building Energy Simulation Program.” Energy and Buildings 33 (4): 319–331. doi:10.1016/S0378-7788(00)00114-6.
- Delgarm, N., B. Sajadi, F. Kowsary, and S. Delgarm. 2016. “Multi-objective Optimization of the Building Energy Performance: A simulation-based Approach by Means of Particle Swarm Optimization (PSO.” Applied Energy 170: 293–303. doi:10.1016/j.apenergy.2016.02.141.
- Dutta, A., A. Samanta, and S. Neogi. 2017. “Influence of Orientation and the Impact of External Window Shading on Building Thermal Performance in Tropical Climate.” Energy and Buildings 139: 680–689. doi:10.1016/j.enbuild.2017.01.018.
- Energy, B., S. Programss, and D. Energyplus. 2012. “Comparison of Building Energy Simulation Programs: DeST, EnergyPlus and DOE-2, Build.” Science 25: 213–222. doi:10.13614/j.cnki.11-1962/tu.2012.s2.017.
- Fallahtafti, R., and M. Mahdavinejad. 2015. “Optimisation of Building Shape and Orientation for Better Energy Efficient Architecture.” International Journal of Energy Sector Management 9 (4): 593–618. doi:10.1108/IJESM-09-2014-0001.
- Fang, Y., and S. Cho. 2019. “Design Optimization of Building Geometry and Fenestration for Daylighting and Energy Performance, Sol.” Energy 191: 7–18. doi:10.1016/j.solener.2019.08.039.
- Fang, Z., N. Li, B. Li, G. Luo, and Y. Huang. 2014. “The Effect of Building Envelope Insulation on Cooling Energy Consumption in Summer.” Energy and Buildings 77: 197–205. doi:10.1016/j.enbuild.2014.03.030.
- Feng, F., Z. Li, Y. Ruan, and P. Xu. 2016. “An Empirical Study of Influencing Factors on Residential Building Energy Consumption in Qingdao City, China.” Energy Procedia 104: 245–250. doi:10.1016/j.egypro.2016.12.042.
- Ferdyn-Grygierek, J., and K. Grygierek. 2017. “Multi-Variable Optimization of Building Thermal Design Using Genetic Algorithms.” Energies 10 (10): 1–20. doi:10.3390/en10101570.
- Friedman, C., N. Becker, and E. Erell. 2014. “Energy Retrofit of Residential Building Envelopes in Israel: A cost-benefit Analysis.” Energy 77: 183–193. doi:10.1016/j.energy.2014.06.019.
- Gagliano, A., F. Patania, F. Nocera, and C. Signorello. 2014. “Assessment of the Dynamic Thermal Performance of Massive Buildings.” Energy and Buildings 72: 361–370. doi:10.1016/j.enbuild.2013.12.060.
- Geng, J. B., and Q. Ji. 2014. “Multi-perspective Analysis of China’s Energy Supply Security.” Energy 64: 541–550. doi:10.1016/j.energy.2013.11.036.
- Gou, S., V. M. Nik, J. L. Scartezzini, Q. Zhao, and Z. Li. 2018. “Passive Design Optimization of newly-built Residential Buildings in Shanghai for Improving Indoor Thermal Comfort while Reducing Building Energy Demand.” Energy and Buildings 169: 484–506. doi:10.1016/j.enbuild.2017.09.095.
- Harkouss, F., F. Fardoun, and P. H. Biwole. 2018. “Passive Design Optimization of Low Energy Buildings in Different Climates.” Energy 165: 591–613. doi:10.1016/j.energy.2018.09.019.
- He, Q., D. Liu, X. Zhu, L. Yang, and J. Liu. 2015. “Study on Measuring the Indoor Thermal Environment of Tibetan Vernacular Houses on the Chuanxi Plateau.” Journal Xi’an Universität Architecture Technology 47: 402–406. doi:10.15986/j.1006-7930.2015.03.017.
- Jalali, Z., E. Noorzai, and S. Heidari. 2020. “Design and Optimization of Form and Facade of an Office Building Using the Genetic Algorithm.” Science and Technology for the Built Environment 26 (2): 128–140. doi:10.1080/23744731.2019.1624095.
- Khamma, T. R., and M. Boubekri. 2017. “Statistical Analysis of Impact of Building Morphology and Orientation on Its Energy Performance.” Journal Engineers Architecture 5: 15–25. doi:10.15640/jea.v5n1a2.
- Lapisa, R. 2019. “The Effect of Building Geometric Shape and Orientation on Its Energy Performance in Various Climate Regions.” International Journal of GEOMATE 16 (53): 113–119. doi:10.21660/2019.53.94984.
- Li, H., S. Wang, and H. Cheung. 2018. “Sensitivity Analysis of Design Parameters and Optimal Design for zero/low Energy Buildings in Subtropical Regions, Appl.” Energy 228: 1280–1291. doi:10.1016/j.apenergy.2018.07.023.
- Li, W., L. Yang, Y. Ji, and P. Xu. 2019. “Estimating Demand Response Potential under Coupled Thermal Inertia of Building and air-conditioning System.” Energy and Buildings 182: 19–29. doi:10.1016/j.enbuild.2018.10.022.
- Liu, Y., W. Zhou, X. Luo, D. Wang, X. Hu, and L. Hu. 2021. “Design and Operation Optimization of multi-source Complementary Heating System Based on Air Source Heat Pump in Tibetan Area of Western Sichuan, China.” Energy and Buildings 242: 110979. doi:10.1016/j.enbuild.2021.110979.
- MacNaughton, P., U. Satish, J. G. C. Laurent, S. Flanigan, J. Vallarino, B. Coull, J. D. Spengler, and J. G. Allen. 2017. “The Impact of Working in a Green Certified Building on Cognitive Function and Health, Build.” Environment 114: 178–186. doi:10.1016/j.buildenv.2016.11.041.
- Monteiro, H., F. Freire, and N. Soares. 2021. “Life Cycle Assessment of a South European House Addressing Building Design Options for Orientation, Window Sizing and Building Shape.” Journal of Building Engineering 39: 102276. doi:10.1016/j.jobe.2021.102276.
- Ng, E. Y. Y., L. K. Poh, W. Wei, and T. Nagakura. 2001. “Advanced Lighting Simulation in Architectural Design in the Tropics.” Automation in Construction 10 (3): 365–379. doi:10.1016/S0926-5805(00)00053-4.
- Oti, A. H., E. Kurul, F. Cheung, and J. H. M. Tah. 2016. “A Framework for the Utilization of Building Management System Data in Building Information Models for Building Design and Operation.” Automation in Construction 72: 195–210. doi:10.1016/j.autcon.2016.08.043.
- Pacheco, R., J. Ordóñez, and G. Martínez. 2012. “Energy Efficient Design of Building: A Review, Renew.” Renewable and Sustainable Energy Reviews 16 (6): 3559–3573. doi:10.1016/j.rser.2012.03.045.
- Pacheco-Torgal, F., and S. Jalali. 2011. “Nanotechnology: Advantages and Drawbacks in the Field of Construction and Building Materials, Constr.” Construction and Building Materials 25 (2): 582–590. doi:10.1016/j.conbuildmat.2010.07.009.
- Pathirana, S., A. Rodrigo, and R. Halwatura. 2019. “Effect of Building Shape, Orientation, Window to Wall Ratios and Zones on Energy Efficiency and Thermal Comfort of Naturally Ventilated Houses in Tropical Climate.” International Journal of Energy and Environmental Engineering 10 (1): 107–120. doi:10.1007/s40095-018-0295-3.
- Rian, I. M., and S. Asayama. 2016. “Computational Design of a nature-inspired Architectural Structure Using the Concepts of self-similar and Random Fractals.” Automation in Construction 66: 43–58. doi:10.1016/j.autcon.2016.03.010.
- Saeed, S. A. R. 1987. “Indoor Climate as a Function of Building Orientation.” International Journal of Ambient Energy 8 (1): 41–47. doi:10.1080/01430750.1987.9675513.
- Shi, X., Z. Tian, W. Chen, B. Si, and X. Jin. 2016. “A Review on Building Energy Efficient Design Optimization Rom the Perspective of Architects, Renew.” Renewable and Sustainable Energy Reviews 65: 872–884. doi:10.1016/j.rser.2016.07.050.
- Sowell, E. F., and P. Haves. 2001. “Efficient Solution Strategies for Building Energy System Simulation.” Energy and Buildings 33 (4): 309–317. doi:10.1016/S0378-7788(00)00113-4.
- Strachan, P. A., G. Kokogiannakis, and I. A. Macdonald. 2008. “History and Development of Validation with the ESP-r Simulation Program, Build.” Environment 43: 601–609. doi:10.1016/j.buildenv.2006.06.025.
- Sun, Q., M. Li, J. Lu, and M. Liu. 2018. “Energy Consumption Analysis of College Dormitory Building Based on Multiple Linear Regression Method.” Journal Xi’an Universität Architecture Technology 50: 919–924. doi:10.15986/j.1006-7930.2018.06.024.
- Tian, Z. C., W. Q. Chen, P. Tang, J. G. Wang, and X. Shi. 2015. “Building Energy Optimization Tools and Their Applicability in Architectural Conceptual Design Stage.” Energy Procedia 78: 2572–2577. doi:10.1016/j.egypro.2015.11.288.
- Weißenberger, M., W. Jensch, and W. Lang. 2014. “The Convergence of Life Cycle Assessment and Nearly zero-energy Buildings: The Case of Germany.” Energy and Buildings 76: 551–557. doi:10.1016/j.enbuild.2014.03.028.
- Yu, S., Y. Cui, X. Xu, and G. Feng. 2015. “Impact of Civil Envelope on Energy Consumption Based on EnergyPlus.” Procedia Engineering 121: 1528–1534. doi:10.1016/j.proeng.2015.09.130.
- Zhai, Z. J., and J. M. Helman. 2019. “Implications of Climate Changes to Building Energy and Design, Sustain.” Sustainable Cities and Society 44: 511–519. doi:10.1016/j.scs.2018.10.043.
- Zhang, L., L. Zhang, and Y. Wang. 2016. “Shape Optimization of free-form Buildings Based on Solar Radiation Gain and Space Efficiency Using a multi-objective Genetic Algorithm in the Severe Cold Zones of China, Sol.” Energy 132: 38–50. doi:10.1016/j.solener.2016.02.053.
- Zhang, S., T. Hu, J. Li, C. Cheng, M. Song, B. Xu, and T. Baležentis. 2019. “The Effects of Energy Price, Technology, and Disaster Shocks on China’s Energy-Environment-Economy System.” Journal of Cleaner Production 207: 204–213. doi:10.1016/j.jclepro.2018.09.256.
- Zhou, X., T. Hong, and D. Yan. 2014. “Comparison of HVAC System Modeling in EnergyPlus, DeST and DOE-2.1E, Build.” Simulation 7: 21–33. doi:10.1007/s12273-013-0150-7.