
 ?Mathematical formulae have been encoded as MathML and are displayed in this HTML version using MathJax in order to improve their display. Uncheck the box to turn MathJax off. This feature requires Javascript. Click on a formula to zoom.
ABSTRACT
Impact tests were conducted using a specially made drop hammer impact device on concrete specimens (C60–C90) containing lean iron ore from mine waste as coarse aggregate to realize enhanced impact resistance in applications such as pile driving. Impact resistance tests were also conducted on equivalent conventional limestone concrete specimens for comparison. The statistical analysis results show that the number of impacts at the initial and final cracking of lean iron ore concrete conformed to the Weibull distribution of the strength grade. The impact resistance of lean iron ore concrete was ~0.65–2.03 times greater than that of conventional limestone concrete. In this study, as the impact fracture energies of the C80 and C90 specimens were the maximum and the damage to the lean iron ore aggregate was obvious, the properties of the lean iron ore were completely utilized. Consequently, a linear relationship between the failure resistance of lean iron ore concrete and its strength grade was identified. Finally, the use of lean iron ore as a coarse aggregate in concrete was shown to effectively reduce the probability of the precast concrete pile head bursting during driving.
1. Introduction
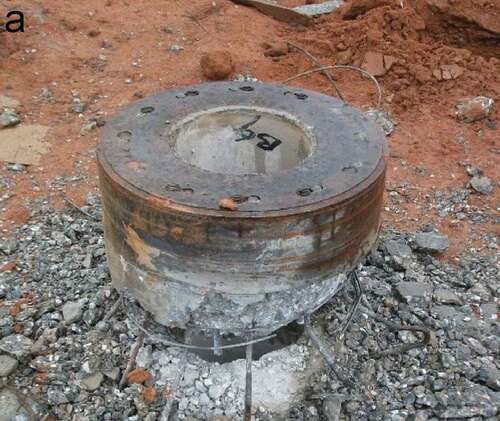
Following the rapid advancement of the construction industry, unpredictable impact loads have begun to affect the integrity of engineering components in different applications, and must therefore be properly accounted for. Under repeated dynamic impact loading, concrete components are subjected to repeated compression and tension, which continually induces and spreads microcracks. In particular, when a concrete component is connected to a fixed support, the shock wave generated after impact loading continuously reverberates inside the component, significantly reducing its service life. For example, in the case of precast pile installation, the pile top can burst after being subjected to multiple hammer blows (); this adversely affects the continued use of precast piles. Many scholars have accordingly studied the impact resistance of different concrete materials using the drop-hammer impact tester; for example, Li and Yu (Citation2019) and Zhidan, Yali, and Maopeng (Citation2021) studied the impact response and resistance of ultra-high-performance fiber-reinforced concrete; Gopinath, Prakash, and Ahamed (Citation2020), Weiguang, Lumin, and Huailiang (Citation2022), Alrshoudi et al., Fahed, Hossein, and Rayed (Citation2020), Yuan et al., Feng, Seok, and Hwi (Citation2022), and Jian, Bojian, and Wei (Citation2022) studied the synergistic effects of different types of fiber reinforcement in concrete under impact loads; Yang, Yang, and Zhang (Citation2020) studied the impact resistance of concrete in composite structures; Srikanth, Murthy, and Rao (Citation2021), Rahul and Nirendra (Citation2021), Xiaoe (Citation2019), and Vijayaprabha, Siva, and Mugahed (Citation2021) studied the impact resistance of concrete containing different aggregates; Sadi, Han, and Wenlixia (Citation2021) studied the impact resistance of reinforced concrete; and Nv et al., Linnv, Yisa, and Yijia (Citation2021) studied the influence of curing methods on the impact resistance of concrete. In recent years, numerous studies have applied the drop-hammer impact test. At present, ordinary concrete is mainly taken as the research object, and the influence of adding fibers and replacing aggregate on the impact resistance of concrete is discussed. Studies on the properties of concrete materials and the methods used to enhance their impact resistances are currently research hotspots.
Figure 1. Hammer failure of precast pile: (a) pile top burst and (b) post-burst pile.
China’s open-pit iron mines strip hundreds of millions of tons of lean iron ore every year. This ore is discharged as waste to dumping grounds, not only occupying land but also presenting safety hazards (Bie Citation2002). To protect the environment and reduce the potential for harm, China has conducted assorted preliminary research into the treatment and utilization of such mine waste resources. Chen, Ni, and Wu (Citation2015) reported that hematite iron ore, which accounts for ~10% (by mass) of the available iron (herein referred to as lean iron ore) can be used as a coarse aggregate in high-strength concrete after being crushed into particles. Wang, Kang, and Han (Citation2015) used lean iron ore sand to replace natural river sand as a fine aggregate in concrete; the resulting product could replace conventional concrete in many structures. Furthermore, Zhang, Tang, and Liu (Citation2021) studied the gelling activity of lean iron ore, Zhao et al. (Citation2021) studied the characteristics of lean iron ores, and Cheng et al. (Citation2016) studied the influence of lean iron ore on the compressive strength of concrete. Although these studies reported meaningful research results, the efficient and comprehensive development and utilization of lean iron ore remains a vital research topic for effectively utilizing mine waste resources in construction materials.
Therefore, in this study, lean iron ore was crushed into a coarse aggregate following the coarse particle size standard. Such aggregate materials have previously been applied in experimental studies of concrete in its early curing stages to improve the relevant theory and associated applicability (Zhu Citation2018); however, the results showed that the failure phenomena observed in previous experiments fail to account for the characteristics and contributions of lean iron ore coarse aggregate and its contribution to the performance of high-strength concrete. Using lean iron ore as coarse aggregate to improve the mechanical properties of high-strength concrete is a novel approach. At present, only few studies have been conducted on the impact resistance of high-strength concrete at home and other foreign countries, especially on strengthening the impact resistance of high-strength concrete from the perspective of hard coarse aggregates.
To discuss the feasibility of improving the impact resistance of high-strength concrete using lean iron ore coarse aggregate, based on the existing literature, in this study, high-strength concrete specimens (C60–C90) containing lean iron ore as a coarse aggregate were examined under impact tests using the standard free-drop hammer method recommended by the ACI 544 Committee. The experimental data and analysis results of this study can provide a reference for the effective utilization of lean iron ore and the performance optimization of high-strength concrete.
2. Materials and methods
2.1. Experimental materials
The cement used in this study was P.O52.5 ordinary Portland cement; its parameters all satisfied the requirements of the National Standard of Ordinary Portland Cement (GB 175-Citation2007 Citation2007). The crushed particle size of the lean iron ore coarse aggregate was 4.75–25 mm, thereby conforming to the requirements for continuous gradation; the physical and mechanical properties of the lean iron ore coarse aggregate are compared in against the various specifications for coarse aggregates. The data in the table indicate that the apparent density of the coarse aggregate slightly exceeds that of the ordinary aggregate; meanwhile, its void ratio, locking effect, hardness, crushing value, abrasion value, and impact value are all smaller. Comparing the coarse aggregate requirements (GB/T 14685-Citation2011 Citation2011; JTG/T, F30-Citation2014 2014; JTT/T F50-Citation2011 Citation2011) expressed in different specifications, it can be concluded that lean iron ore can be treated as a Grade I material when applied as a coarse aggregate. The harmful chemical components and iron content in the aggregate are shown in , which indicates that the contents of Fe, MgO, and Na2O in the lean iron ore were considerably low, satisfying the requirements for use as a coarse aggregate. The aggregate is shown in ). The coarse aggregate used in the benchmark concrete was ordinary limestone macadam with an apparent density of 2706 kg/m3, hardness of 1.39%, crushing value of 18.79%, abrasion value of 19.4%, and impact value of 13.2%; these properties specify it as a Grade I coarse aggregate. The aggregate is shown in ). The fine aggregate in all mixes was river sand, with a fineness modulus of 2.73, apparent density of 2610 kg/m3, and silt content of 1.8%. The gradation curve of coarse aggregate and fine aggregate is shown in . A polycarboxylate water-reducing agent was selected as the admixture to realize a water reduction rate of 30% in all mixes. The water used in all mixes was tap water, which meets the appropriate standard of water for concrete.
Figure 2. Coarse aggregate used in the experiment: (a) lean iron ore coarse aggregate and (b) limestone coarse aggregate.
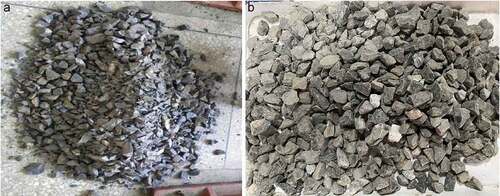
Figure 3. Gradation curve of aggregate.
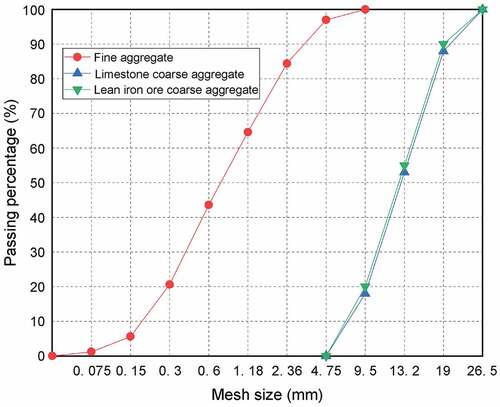
Table 1. Physical and mechanical properties of various coarse aggregates.
Table 2. Statistical distribution of harmful chemicals and iron content in lean iron ore.
2.2. Sample preparation and strength testing
2.2.1. Preliminary mix design
The high-strength concrete mix used in this study was designed according to the JGJ55-2011 Specification for the Mix Proportion Design of Ordinary Concrete and the related technical specifications (JTG E42-2005 (Citation2005), JGJ/T, 281–2012 (Citation2012)). The absolute volume method was used to calculate the preliminary mix proportions presented in . As shown in the table, two mix types were prepared: Type A mixes used lean iron ore as the coarse aggregate to prepare C60, C70, C80, and C90 strength grade concrete specimens, whereas i Type B mixes used the conventional limestone coarse aggregate instead to prepare the same concretes.
Table 3. Preliminary mix proportions.
2.2.2. Strength testing
Compressive strength test specimens for the mixes reported in were prepared by manual mixing followed by casting in 100 mm cubes on a shaking table, demolding after 24 h, and 28 d of curing. The temperature and relative humidity of the concrete specimens in the laboratory during curing were 20°C and 95%, respectively. Each mix was then tested using the standard test method on three identical specimens; the results are shown in . The measured compressive strengths of both concrete mix types were found to be higher than the specified value. Because the strengths of these mixes clearly satisfied the requirements, the impact resistance tests were conducted following the mix proportions shown in .
Table 4. Compressive strengths of mixes.
2.3. Experimental method
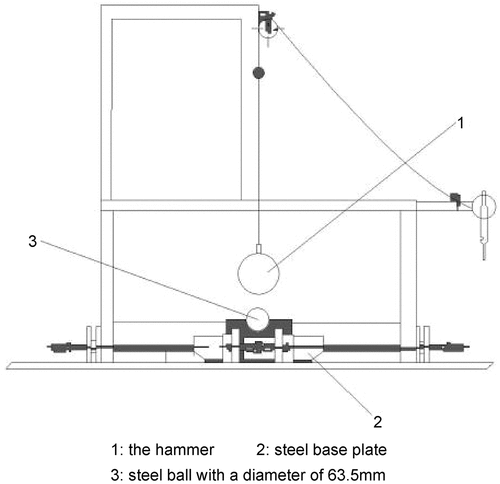
Following the standard test method recommended by the ACI 544 Committee (American Concrete Institute (ACI) Citation1988), a multifunctional drop-hammer impact testing apparatus was developed for use in this study, as shown in . The bottom of the instrument comprised a steel base plate. The instrument itself fixed the specimen in place and helped it to maintain its shape during impact. A 63.5 mm diameter steel ball was placed in the center of the upper surface of the specimen and fixed with a specially designed fixing pad. Prior to the installation of the fixing pad, the central region of the specimen was checked to ensure that it was flat and free of concavity or convexity. During the test, a steel hammer weighing 4.55 kg fell freely from a height of 460 mm to impact the steel ball; this then transferred energy to the specimen. Twelve specimens, 150 mm in diameter and 63.5 mm thick, were prepared for each concrete mix, resulting in a total of 96 trials.
Figure 4. Self-made drop hammer impact test device.
The following test procedure was followed until specimen destruction: The impact was repeatedly applied to the specimen; when the first crack was observed on the specimen surface, the number of impacts N1 and the length L, width c, and depth d of the crack were recorded using a reading microscope; the impact testing was repeated and the surface of the specimen was observed after each impact; when the number of cracks on the specimen surface no longer increased from impact to impact, the specimen was considered to be completely destroyed; meanwhile, the number of impacts to destruction (final cracking) N2 was recorded together with the corresponding L, c, and d. The crack depth at this time was defined as the full thickness of the specimen, in accordance with phenomena observed during the tests.
An impact test evaluates the impact resistance of a specimen using the number of impacts to initial cracking, N1; the number of impacts to final cracking, N2; the difference between N1 and N2, ΔN; the energy absorbed by the initial or final cracking of the specimen, W’; and the resistance of the specimen to initial or final cracking, P.
According to ACI 544, the impact energy of concrete can be calculated as
where N is the number of impacts, h is the drop height, m is the hammer mass, and g is the acceleration due to gravity (9.81 m/s2).
The resistance of the specimen to initial and final cracking can be determined using
where Δs is the crack volume, calculated as
3. Results and statistical analysis
3.1. Experimental phenomenon
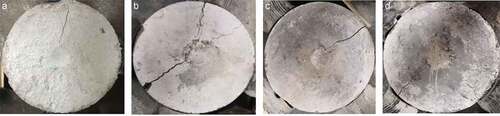
The photographs showing the initial cracking for Type A and B concrete mix specimens in , respectively, were selected from among the specimens exhibiting clear cracks and representative test values. During each experiment, repeated impacts first resulted in the formation of a dent in the center of the specimen; then, an initial crack spread outward from this dented region. The initial cracks formed in the two concrete mix types were similar; however, only one initial crack formed on the surface of the Type A specimens in all grades, whereas multiple initial cracks formed on the benchmark Type B concrete specimens. These cracks were scattered across the specimen surface, causing severe surface damage.
Figure 5. Initial cracking of lean iron ore concrete: (a) A1, (b)A2, (c) A3, and (d) A4.
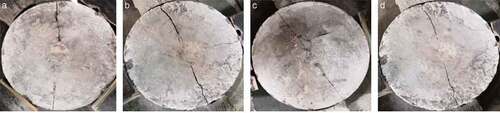
Figure 6. Initial cracking of benchmark concrete: (a) B1,(b) B2, (c) B3, and (d) B4.
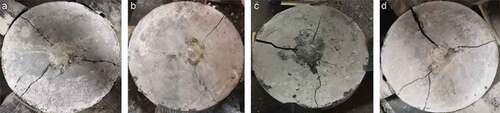
show the final crack failure modes for the Type A and B concrete mix specimens, respectively. As shown in , the final cracks on the surface of the Type A specimens were approximately straight lines. During the test, the sound of the hammer impacting these specimens was clean and crisp, and when the initial crack appeared, this sound gradually decreased. If the sound is crisp and high pitched, it indicates that the hammered concrete is in good condition internally; if the sound becomes softer and the intensity becomes weaker, it indicates that the hammered concrete is internally deteriorated and broken. As shown in , the final cracks on the surfaces of the Type B specimens randomly spread across the specimens according to the different initial crack positions, exhibiting an irregular radial pattern.
Figure 7. Final cracking of lean iron ore concrete: (a) A1, (b) A2, (c) A3, and (d) A4.
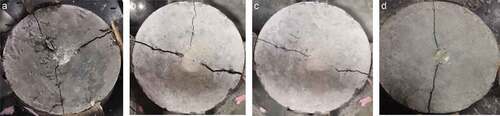
Figure 8. Final cracking of benchmark concrete: (a)B1, (b) B2, (c) B3, and (d) B4.
Because of the use of recycled aggregate, the final crack of the specimens in Nune Srikanth, Murthy, and Rao (Citation2021)’s study presents a “T” shape similar to the final crack failure of the benchmark concrete. For the experimental specimen of Fahed, Hossein, and Rayed (Citation2020), the use of polypropylene fiber indicated that when the final crack appeared, the radial shape was more notable. In contrast, the number of final cracks in the lean iron ore concrete was the lowest, which clearly indicates the brittleness of this concrete.
The internal section characteristics of each group of concrete specimens also differed after failure, as indicated by the fractures observed in the coarse aggregate. This phenomenon is closely related to the properties of the coarse aggregate in the two concrete types. Therefore, to study the influence of the degree of coarse aggregate fracture on the crack propagation and impact resistance of the concrete mixes, the ratio of surface fractures in the coarse aggregate to those in the hardened cement paste (referred to as the “fracture ratio” in this study) was statistically determined for each specimen ().
Table 5. Surface fracture ratio of coarse aggregate to hardened cement paste.
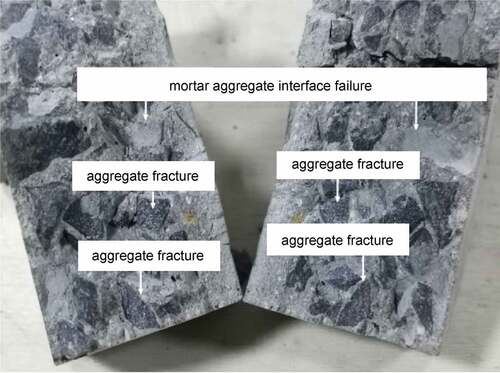
It can be observed in that the fracture ratio of the A3 specimen was the largest; as shown in , the surface of its damaged section was relatively flat, and the broken coarse aggregate was symmetrical about that section. The fracture ratios of the Specimens A1 and A2 were smaller than that of Specimen A3, the surfaces of their damaged sections were unevenly distributed, and failure cracks were clearly observed to propogate through the hardened cement paste and coarse aggregate at their interfaces, as shown in . The damaged sections of Type B concrete specimens were similar for all strength grades. Coarse aggregate and mortar-aggregate interface fractures were clearly visible in all sections, as shown in . When the strength grade increased, the surface fracture ratio also gradually increased. This phenomenon is related to the crushing value and particle shape of the coarse aggregate. Coarse aggregate particles of iron tailings primarily exhibited crushing value characteristics in A1 and A2. In A3 and A4, the crushing value characteristics of coarse aggregate particles were not obvious, exhibiting flaky blocks and clear brittle fracture. The crushing value of limestone coarse aggregate was lower than that of iron tailings coarse aggregate, and the particle shape outperformed that of the iron tailings aggregate. In Specimen B, the crushing value and particle shape characteristics of the coarse aggregate are reflected together. Therefore, the fracture surface ratios of the benchmark concrete specimens were similar.
Figure 9. C80 lean iron ore concrete (A3) section.
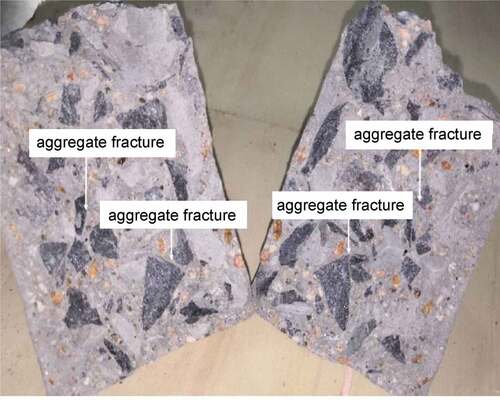
Figure 10. C60 lean iron ore concrete (A1) section.
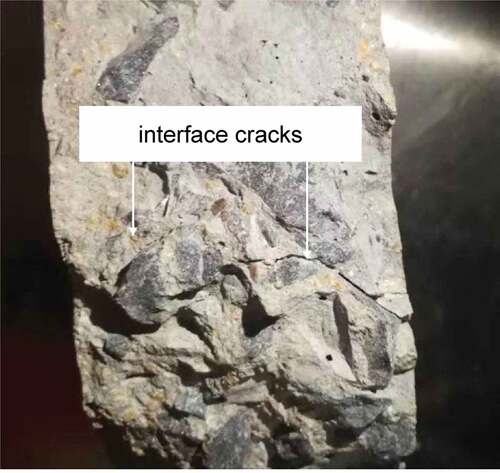
Figure 11. C70 benchmark concrete (B2) section.
3.2. Statistical analysis of experimental results
A total of 96 specimens were tested to determine their impact resistances. lists the N1,N2, and ΔN index values for the specimens of Mix Types A and B, in which it can be clearly observed that the test results exhibit a certain discreteness. This could be caused by the different orders followed during the feeding of aggregate materials while preparing the concrete mix, or the formation of uneven surfaces due to vibration during preparation.
Table 6. Test results for each mix.
To ensure that the test results were representative, the average index value for each mix type was taken as the basis for the corresponding analysis. To ensure the accuracy of the average test results, the Grubbs method was used to determine the number of impacts at initial and final cracking. The average of the valid data was taken as the analysis result, as shown in . The loading conditions in Nv et al., Linnv, Yisa, and Yijia (Citation2021)’s experiment were the same as those used in this study. The energy absorbed by the C60 specimen at initial cracking was 1900 J, which is very close to those of Specimens A1 and B1 in this study. This suggests that the impact test data presented here have certain credibility.
Table 7. Average results of impact test indexes.
At present, the application of reliability theory in engineering is particularly popular and has yielded significant advances. Numerous experimental studies have shown that the impact lifespan of concrete obeys the Weibull distribution (Wang, Wang, and Liu Citation2010). Therefore, a Weibull distribution failure probability analysis was performed for the impact resistance of lean iron ore concrete, as described in this section.
First, the distribution laws describing the impact resistances of Specimen Types A and B were expressed using the following Weibull density function:
.
Here, N0 is the minimum life parameter, Na is the characteristic life parameter, and b is the Weibull shape parameter.
To simplify the calculation model, let the minimum life N0 = 0; then, EquationEquation. (4)(4)
(4) can be simplified to a two-parameter Weibull distribution as follows:
Based on EquationEquation. (5(5)
(5) ), the failure probability function P(N) of the Weibull distribution can be determined using
which can be transformed into
Applying logarithms on both sides of EquationEquation. (7)(7)
(7) yields
The statistical properties of the data indicate that the expectation estimation of the average ranking method can be used to obtain the failure probability function P(N) of the Weibull distribution as follows:
where i is the serial number of a given sample and n is the total sample size.
The failure probability functions were calculated for each specimen according to EquationEquation. (10)(10)
(10) . The resulting fitting functions are shown in , in which the scatter points were fitted using the least squares method to obtain the corresponding regression parameters α and β in EquationEquation. (9)
(9)
(9) as well as the correlation coefficient R. The Weibull fitting results for the N1 and N2 of the lean iron ore concrete specimens are listed in , exhibiting a clear linear relationship with good correlation. The average correlation coefficient of initial crack impact time was 0.862. The average correlation coefficient of final crack impact time was 0.865. The linear relationship for the A3 specimen was the most obvious; the presence of clearly abnormal data in the impact test results for Specimens A1 and A2 resulted in slightly smaller R values than Specimens A3 and A4.
Figure 12. Linear regression results for number of impacts N1 at initial cracking: (a) A1, (b) A2, (c) A3, and (d) A4.
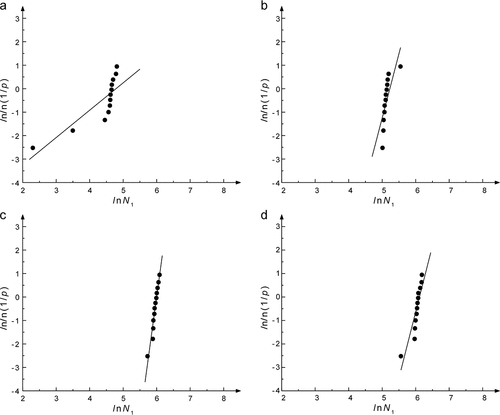
Figure 13. Linear regression results for number of impacts N2 at final cracking: (a) A1, (b) A2, (c) A3, and (d) A4.
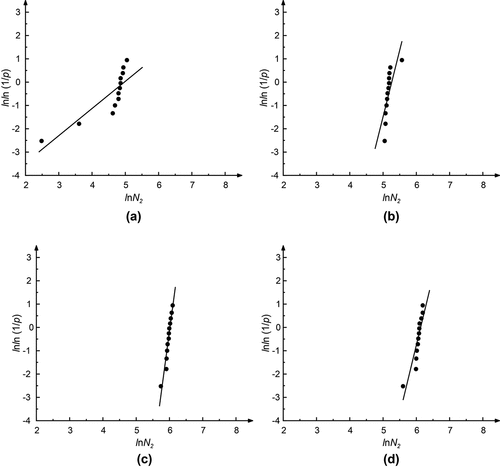
Table 8. Weibull fitting results.
Thus, the fitting results show that N1 and N2 for each grade of lean iron ore concrete can be determined using the Weibull distribution. As a result, the impact resistance of lean iron ore concrete can be considered highly reliable throughout its life, regardless of the concrete strength.
3.3. Enhancement mechanism analysis
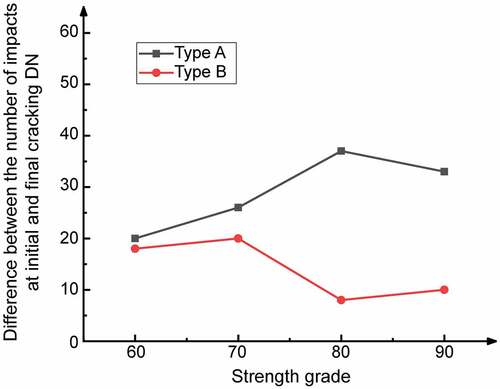
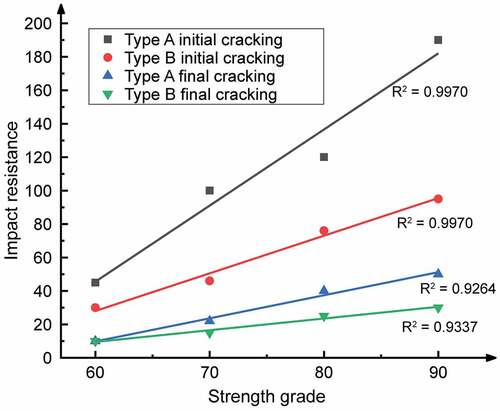
According to statistical analyses of the impact test results, the relationships between N1, N2, ΔN, W’, and the strength grade for each concrete mix type were identified, as shown in .
Figure 14. Relationship between strength grade and number of impacts.
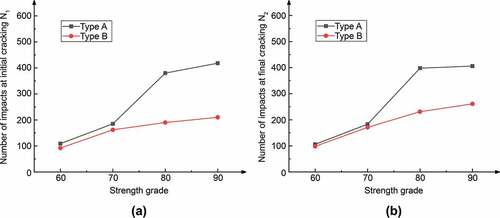
Figure 15. Relationship between strength grade and fracture energy.
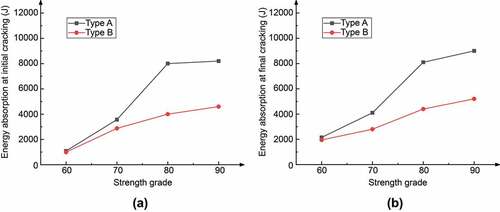
Figure 16. Relationship between strength grade and number of impacts between initial and final cracking.
From these figures, it can be concluded that the increase in strength grade corresponds to marked increases in N1, N2, and W’ for both types of concrete, which follow approximately consistent change rules. The data indicate that the N1, N2, and W’ of all lean iron ore concrete strength grades were consistently 0.65–2.03 times higher than those of the benchmark concrete. When the strength reached that of the C90 grade, the N1, N2, and W’ for lean iron ore concrete exhibited their largest values. For the C80 grade concrete, the improvement ratio of lean iron ore concrete was the largest. In terms of the damage degree, the fracture ratio was relatively high for the C80 grade. Furthermore, between Grades C70 and C80, the slope corresponding to Type A in indicates a general increasing trend.
As shown in , the ΔN of the benchmark concrete consistently exceeded that of the lean iron ore concrete. When the concrete strength grade increased, the difference between the ΔN values of the Type A and B concretes gradually increased; this difference was the largest between the two C80 concretes. When an initial crack failure occurred during the test process, the final failure of the specimen occurred quickly thereafter, indicating that when lean iron ore is applied in high-strength concrete, the impact resistance of the concrete is enhanced, though its brittleness is also increased. This result was confirmed by the observed change in the hammering sound during the experiment. To reflect the influence of ΔN on the impact resistance of concrete more intuitively, the ductility index β was used to evaluate the concrete performance as follows:
The results obtained using EquationEquation. (11)(11)
(11) are presented in and show that the ductility of each lean iron ore concrete strength grade was ~1.31–10.44 times smaller than the equivalent benchmark concrete strength grade. However, owing to the considerable difference between ΔN and N1, the β values compared for the two concrete types were fairly small, indicating that ΔN has a smaller influence on the impact resistance of lean iron ore concretes for all grades.
Table 9. Ductility index.
Rahul and Nirendra (Citation2021) added 10% rubber powder into concrete, and the impact resistance was consequently improved by 7.3%. Through experimental research, Cong, Wenchang, and Xiangqing (Citation2021) found that the ductility index β of C40 ordinary concrete under impact is 0.13–0.22. In contrast, in this study, the impact resistance of concrete mixed with lean iron ore coarse aggregate exceeds that with rubber powder, and the ductility index decreases with the increase in concrete grade.
Each specimen’s ability to resist initial and final cracking was calculated using EquationEquation. (2)(2)
(2) and the measured crack L, d, and c. The regression results shown in indicate a linear correlation between the impact resistance index and strength grade of the two types of concrete: when the strength grade increased, the ability of both concrete types to resist impact damage improved. However, the lean iron ore concrete exhibited a stronger impact resistance to both initial and final cracking than the benchmark concrete. Furthermore, when the strength grade increased, the impact resistance of the lean iron ore concrete was primarily realized through its ability to resist initial cracking.
Figure 17. Relationship between impact resistance and strength grade according to different concrete mix types (conventional and lean iron ore mix).
Because the two concrete types investigated in this study are solid materials, their dynamic responses under impact load will differ substantially from those under static loads; this difference is primarily reflected in the rate effect (Cui, Wang, and Zhang Citation2017). When a solid material is either combined with or transformed into a rigid body in an ideal state, all the energy inputted to it from the outside can be converted into kinetic energy. However, in the non-ideal state, the external input energy can be converted into solid kinetic energy and solid potential energy. The physical equilibrium equation for a solid rigid body under impact load can therefore be expressed as
where Wi,Wk, and Wp are the input energy, kinetic energy, and potential energy, respectively; is the unit vector of the spatial position of the micro-element; ρ is the continuous medium density;
is the velocity of the micro-element medium in the load field;
is the stress per unit cell of the medium
; s is the surface area of the unit cell; V is the medium volume; and f is the viscous force counteracting the interfacial dislocation fracture of the microelements.
Solid microscopic particles exhibit poor performance when transforming external kinetic energy into internal energy. By neglecting the internal energy effect and considering practicality and operability, the energy conservation equation of the particle field for a solid microscopic material under impact can be expressed as
where is the material strain rate, D is the medium damage coefficient, Ud is the thermal activation energy during the process of micro-damage, W is the kinetic energy inputted by the impact load into the solid, W is the inertial energy of the material particles, Wρ is the plastic energy of the particles, and Wτ is the material damage fracture energy.
Particle velocity attenuation is caused by external constraints, material deformation, and friction between particles at fracture. It is a macroscopic representation of the transformation from external impact kinetic energy to the potential energy of a material (Einav Citation2007). The potential energy of a material can be expressed as
where is the equivalent mass of the solid medium, ψ is the nominal equivalent velocity of the particle, Δl is the displacement of the particles under impact load, Dt is the damage coefficient of the material at moment t, and σ(ε,t) is the stress function of the material under impact load.
Many scholars have derived theoretical equations describing the fracture energy of solid materials from the perspectives of thermal activation and damage degree (Einav Citation2007; Petrov et al. Citation2017). The “G-formula” for fracture energy, as recommended in the CEB-FIP (Citation1993), is given by
where fc is the compressive strength of the material and α is the related coefficient for the properties of the cementitious matrix; generally, α = 0.03 for aggregate concrete.
The fracture energy released by impact fracture damage (Citation1993) can be expressed by wτ, which is obtained as
where DIF is the dynamic enhancement coefficient, fd is the dynamic compressive strength of the material, and fs is its static compressive strength.
Multiple scholars have concluded that DIF is related to the loading rate, and is usually in the range 1.25–1.92 (Watstein Citation1953; Atchley and Furr Citation1967; Hughes and Watson Citation1978). In view of the low loading rate applied in the impact tests conducted in this study, DIF was set to 1.25. By combining EquationEquations. (17)(17)
(17) and (Equation18
(18)
(18) ), the fracture energy values of the two types of concrete under quasi-static load and impact fracture damage were calculated, with the results shown in .
Figure 18. Relationship between fracture energy and fitted values according to strength grade.
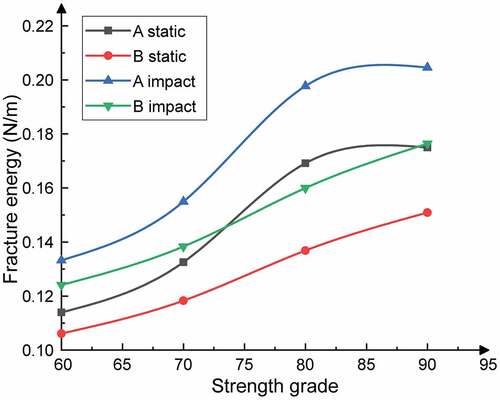
shows that the fracture energy of the two types of concrete evaluated in this study increased with increasing strength grade. Compared with the benchmark (Type B) concrete, the static and impact fracture energies of lean iron ore (Type A) concrete were noticeably stronger. The impact fracture energy of the Type A concrete essentially reached its maximum for the C80 concrete strength grade. The impact fracture energy of this concrete was 1.236 times that of the benchmark concrete and 1.169 times that of its own static fracture energy. The change laws describing the curves in are similar to those describing the curves in , all showing that lean iron ore aggregate is the main factor enhancing the impact fracture energy of concrete at Grades C80 and above. EquationEquation (18)(18)
(18) can therefore be used to calculate the impact fracture energy of different concrete grades containing lean iron ore.
3.4. Engineering feasibility analysis
A high-strength precast concrete pile driving example was used to conduct a lifespan assessment and analysis of lean iron ore aggregate concrete in application. A high-strength precast concrete pile with a diameter of 550 mm and a section length of 10 m was used. The vertical pullout and bearing capacity of the single pile were 400 kN and 2000 kN, respectively. After foundation treatment, a geological survey of the soil underlying the subject construction area was conducted; the obtained soil data are presented in .
Figure 19. Construction soil survey data.
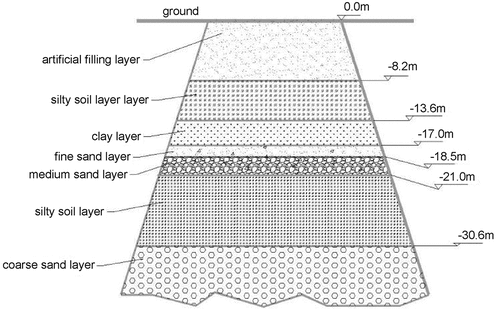
Following the geological survey results (as well as the relevant requirements of the pile driving project), the constructor used a #50 diesel hammer machine to drive the precast pile by dropping an 11 metric ton hammer at a distance of 2 m. The resulting construction records are provided in . Several piles driven under normal construction conditions were selected from these records to analyze their damage phenomena after driving. According to the recorded data and field construction situation, the penetration rates of Piles 8, 9, 12, and 17 decreased notably when they entered the medium sand layer. Furthermore, clear cracks (~50 mm long and 1 mm wide) occurred at the head of the second pile section; indeed, the main damaged parts of all four piles were located at their heads. The total numbers of hammer blows applied to the damaged piles were generally higher than those of the piles that exhibited intact bodies after installation; a maximum of 955 impacts were applied. When Piles 13 and 19 penetrated the coarse sand, they burst in their third sections and the damage to the pile head was significant; hence, the construction was stopped immediately.
Table 10. Construction records.
According to the statistical and failure analyses of the above-mentioned pile-driving cases, when an ordinary high-strength concrete precast pile was used, the probability of breakage at the pile head was ~60%. This represents a technical problem that occurs frequently during precast pile driving. Furthermore, these results indicate that the use of lean iron ore concrete has a much larger influence on the impact life of a pile than the initial crack shape or ductility. For piles, impact life is defined in terms of the number of hammer blows that can be withstood before failure. According to test experience and the engineering lifespan theory, the impact life of a precast iron ore concrete pile can be expressed in terms of the impact life of a conventional benchmark concrete pile as
where N is the estimated impact life of the iron ore concrete pile, Nb is the impact life of a benchmark concrete pile, e is the impact resistance parameter of the concrete, e0 is the minimum enhancement factor, e1 is the maximum enhancement factor, k is the engineering construction safety coefficient, ζ is the impact reliability correlation enhancement coefficient, β1 is the impact reliability correlation ductility coefficient, β2 is the ductility of the concrete material (where β2 = 1 – β, in which β is the ductility index).
The impact life of a lean iron ore concrete pile was then estimated using EquationEq. (19(19)
(19) ); the results indicated that the use of lean iron ore as coarse aggregate enhances the impact resistance of high-strength concrete by a factor of ~0.65–2.03. For the iron ore concrete piles investigated in this study, k was determined to be 0.95, α and β1 were both 0.9, and β2 was calculated using the β values reported in . The probability of pile head bursting failure was found to decrease by ~8.6–51.2% when using lean iron ore concrete. However, pile heads can fail because of geological conditions. The reference values for the impact life of precast piles comprising lean iron ore concretes of various grades are shown in .
Table 11. Lifespan extension of precast lean iron ore concrete piles under harsh geological conditions.
4. Conclusions
The results obtained from an experimental study on the impact resistance of lean iron ore concrete were compared with those of a conventional limestone benchmark concrete to draw the following conclusions.
(1) In terms of the number of impacts at initial and final cracking for each grade of lean iron ore concrete, the fitting results of the Weibull probability distribution show a linear function relationship. The average correlation coefficient of initial crack impact times was 0.862. The average correlation coefficient of final crack impact time was 0.865. This is a good correlation and can pass the Weibull probability distribution test.
(2) Compared with benchmark concrete, lean iron ore concrete exhibited low ductility and clear brittle fracture. The ductility was reduced by a factor of ~1.31–10.44. At the initial cracking, the surfaces of most specimens exhibited one crack; at the final cracking, the specimen surface crack was almost a straight line with no radial characteristics. After the initial crack, the lean iron ore concrete broke along the initial crack and failed quickly.
(3) The impact resistance of the lean iron ore concrete was significantly enhanced compared to the conventional benchmark concrete. When the number of impacts at failure and the impact fracture energy were evaluated, the impact resistance of the lean iron ore concrete was found to be ~0.65–2.03 times greater than that of the benchmark concrete, with the C80 and C90 concrete specimens exhibiting the maximum impact resistance. When the strength of concrete was between C70 and C80, the impact energy balanced by lean iron ore exhibited a general increasing trend, and C80 represented the cut-off point for the coarse aggregate of lean iron ore to be fully utilized.
(4) A linear relationship was observed between the impact fracture resistance of the lean iron ore concrete and its strength grade. The C80 lean iron ore concrete exhibited the greatest impact fracture energy (1.236 times that of the corresponding benchmark concrete and 1.169 times its own static fracture energy) and its aggregate characteristics were observed to be fully utilized. However, whilst the application of lean iron ore in high-strength concrete was found to considerably enhance the impact resistance of concrete, it also increased its brittleness. Lean iron ore coarse aggregate is the main factor to enhance the impact fracture energy of concrete.
(5) In a field application experiment, pile-driving activities were observed to frequently break conventional concrete pile heads, owing to geological conditions. The probability of pile-head bursting failure was reduced by ~8.6–51.2% when using lean iron ore as the coarse aggregate in precast pile concrete. For precast piles with C60–C70 concrete, the life extension rate was 8.6–13.5%; for precast piles with C80–C90 concrete, the life extension rate was 48.9–51.2%.
Acknowledgments
This work was supported by the scientific research project of Liaoning Education Department under Grant [2020LNJC02]; and the Excellent Talents training project of Liaoning University of Science and Technology Grant [2019RC01].
Disclosure statement
No potential conflict of interest was reported by the authors.
Additional information
Funding
References
- American Concrete Institute (ACI). 1988. “Committee 544. Measurement of Properties of Fiber Reinforced Concrete.” ACI Materials Journal 85 (6): 583–593.
- Atchley, B. L., and H. L. Furr. 1967. “Strength and Energy Absorption Properties of Plain Concrete under Dynamic and Static Loading.” [J].American Concrete Institute 64 (11): 745–756.
- Bie, Q.2002.The Study on Industrialization for Reutilization of the Mine’s Resources and Improving Ecological Environment [D].Beijing: China University of Geosciences.in Chinese
- Chen, X., W. Ni, and H. Wu. 2015. “Experimental Study of high-strength Concrete with Waste Rocks and Iron Tailings as Aggregates.”Metal Mine 44 (2): 166–172. in Chinese
- Cheng, Y. H., F. Huang, W. C. Li, R. Liu, G. Li, and J. Wei. 2016. “Test Research on the Effects of Mechanochemically Activated Iron Tailings on the Compressive Strength of Concrete.” Construction & Building Materials 118: 164–170. doi:10.1016/j.conbuildmat.2016.05.020.
- Cong, Z., H. Wenchang, and K. Xiangqing. 2021. “Study on Impact Behavior of Steel Fiber Recycled Concrete.” Concrete 5 36–41. in Chinese
- Cui, S., B. Wang, and K. Zhang. 2017. “Mechanical Behavior and Absorption of Honeycomb with Negative Poisson’s Ratio under in-plane Dynamic Compression.”Chinese Journal of Applied Mechanics 34 (5): 919–924. in Chinese
- Einav, I. 2007. “Breakage mechanics—Part I: Theory.” Journal of the Mechanics & Physics of Solids 55 (6): 1274–1297. doi:10.1016/j.jmps.2006.11.003.
- Fahed, A., M. Hossein, and A. Rayed. 2020. “The Impact Resistance and Deformation Performance of Novel pre-packed Aggregate Concrete Reinforced with Waste Polypropylene Fibres.” Crystals 10 (9): 788. doi:10.3390/cryst10090788.
- Feng, Y. T., C. J. Seok, and K. Y. Hwi. 2022. “Influence of Metallic Grid and Fiber Reinforced Concrete Strengthening on the Shielding and Impact Resistance of Concrete Walls.” Archives of Civil & Mechanical Engineering 22 (3): 1–16.
- GB 175-2007. 2007. National Standard of Ordinary Portland Cement [S]. Beijing: China standard press. in Chinese.
- GB/T 14685-2011. 2011. Pebble and Crushed Stone for Construction [S]. Beijing: China standard press. in Chinese.
- Gopinath, S., A. Prakash, and A. K. F. Ahamed. 2020. “Synergy of Hybrid Textile Reinforced Concrete under Impact Loading.” Sadhana – Academy Proceedings in Engineering Sciences 45 (1): 1–11.
- Hughes, B. P., and A. J. Watson. 1978. “Compressive Strength and Ultimate Strain of Concrete under Impact Loading.” Magazine of Concrete Research 30 (105): 189–199. doi:10.1680/macr.1978.30.105.189.
- JGJ/T, 281-2012. 2012. Technical Specification for Application of High Strength Concrete [S]. Beijing: Ministry of housing and urban-rural development of the people’s Republic of China. in Chinese.
- Jian, Z., W. Bojian, and L. Wei. 2022. “Study on Mechanical Properties and Impact Resistance of Nano-SiO 2 and PVA Fiber Reinforced Recycled Concrete.” China Concrete & Cement Products 2 52–55. in Chinese
- JTG E42-2005. 2005. Test Methods of Aggregate for Highway Engineering [S]. Beijing: People’s Communications Publishing House. in Chinese.
- JTG/T, F30-2014. 2014. Technical Guidelines for Construction of Highway Cement Concrete Pavements [S]. Beijing: People’s Communications Publishing House. in Chinese.
- JTT/T F50-2011. 2011. Technical Specification for Construction of Highway Bridge and Culvert [S]. Beijing: People’s Communications Publishing House. in Chinese.
- Li, P. P., and Q. L. Yu. 2019. “Responses and post-impact Properties of ultra-high Performance Fibre Reinforced Concrete under Pendulum Impact.” Composite Structures 208: 806–815. doi:10.1016/j.compstruct.2018.10.071.
- Linnv, L., W. Yisa, and H. Yijia. 2021. “Effect of self-heating Insulation Curing on Microstructure and Impact Toughness of Concrete Products.”Journal of Wuhan University of Technology 43 (1): 7–13. in Chinese
- Petrov, Y. V., I. V. Smirnov, G. A. Volkov, A. K. Abramian, А. M. Bragov, and S. N. Verichev. 2017. “Dynamic Failure of Dry and Fully Saturated Limestone Samples Based on Incubation Time Concept.” Journal of Rock Mechanics & Geotechnical Engineering 9 (1): 125–134. doi:10.1016/j.jrmge.2016.09.004.
- Rahul, K., and D. Nirendra. 2021. “Assessment of Mechanical and Impact Resistance Properties of Rubberized Concrete after Surface Modification of Rubber Crumb [J].” Iranian Journal of Science & Technology, Transactions of Civil Engineering 46, 1–17.
- Sadi, I. H., Z. Han, and J. Wenlixia. 2021. “Evaluation of Impact Resistance Properties of polyurethane-based Polymer Concrete for the Repair of Runway Subjected to Repeated drop-weight Impact Test [J].” Construction & Building Materials 309: 125152–125169. doi:10.1016/j.conbuildmat.2021.125152.
- Srikanth, N., N. R. D. Murthy, and M. V. S. Rao. 2021. “Studies on Impact Resistance of Self-Compacting Concrete with Mechanically Treated Recycled Coarse Aggregate[J].” IOP Conference Series: Materials Science & Engineering 1197 (1): 012051. doi:10.1088/1757-899X/1197/1/012051.
- 1993. The Comité Euro-International du Béton, CEB-FIP Model Code [S]. Lausanne: Thomas Telford Services Ltd.
- Vijayaprabha, C., A. Siva, and A. Mugahed. 2021. “Impact Resistance of Polypropylene fibre-reinforced alkali–activated Copper Slag Concrete [J].” Materials 14 (24): 7735. doi:10.3390/ma14247735.
- Wang, L., H. Wang, and H. Liu. 2010. “Experimental Study and Statistical Evaluation for Impact Resistance of Steel Fiber Reinforced Lightweight Aggregate Concrete.” Journal of Dalian University of Technology 4 557–563. in Chinese
- Wang, G., H. Kang, and J. Han. 2015. “Strength of Concrete with Iron Tailings and Its Preparation.”Journal of Hebei University (Natural Science Edition) 37 (2): 106–110. in Chinese
- Watstein, D. 1953. “Effect of Straining Rate on the Compressive Strength and Elastic Properties of Concrete.” [J].American Concrete Institute 24 (8): 729–744.
- Weiguang, T., C. Lumin, and W. Huailiang. 2022. “Influence of Polypropylene Fiber Characteristics on the Impact Resistance of Concrete.”Concrete 388 (2): 31–37. in Chinese
- Xiaoe, Z. 2019. “Effect of Silica Fume Content and Phase Change Aggregate Content on Impact Resistance of Concrete [J].” New Building Materials 2 36–39. in Chinese
- Yang, X. Q., H. Yang, and S. M. Zhang. 2020. “Transverse Impact Behavior of high-strength Concrete Filled normal-/high-strength Square Steel Tube Columns.” International Journal of Impact Engineering 139: 103512. doi:10.1016/j.ijimpeng.2020.103512.
- Zhang, N., B. W. Tang, and X. M. Liu. 2021. “Cementitious Activity of Iron Ore Tailing and Its Utilization in Cementitious Materials, Bricks and Concrete.” Construction & Building Materials 288: 123022. doi:10.1016/j.conbuildmat.2021.123022.
- Zhao, J. S., K. Ni, Y. P. Su, and Y. Shi. 2021. “An Evaluation of Iron Ore Tailings Characteristics and Iron Ore Tailings Concrete Properties.” Construction & Building Materials 286: 122968. doi:10.1016/j.conbuildmat.2021.122968.
- Zhidan, R., W. Yali, and J. Maopeng. 2021. “Impact Compressive Performance and Damage Evolution of ultra-high Performance concrete[J].”Journal of the Chinese Ceramic Society 49 (11): 2322–2330. in Chinese
- Zhu, S. 2018. Applied Research on Dagushan Waste Rock and Tailings in Concrete Roadway [D]. Anshan: University of Science and Technology Liaoning. in Chinese