
 ?Mathematical formulae have been encoded as MathML and are displayed in this HTML version using MathJax in order to improve their display. Uncheck the box to turn MathJax off. This feature requires Javascript. Click on a formula to zoom.
ABSTRACT
China’s mountainous village relocation planning faces the problems of extensive survey ranges and high travel costs, and current planning still depends on traditional field visits and census data survey method. To improve efficiency and control costs, digital survey methods are proposed to support efficient data collection and produce data with accurate spatial reference . This research discusses a specific survey method for relocation planning using virtual imaging space modeling based on 3D GIS combined with neural network algorithm. A digital village model of a pilot village is established by oblique photography and WEBGIS technology, while the improved Mask R-CNN algorithm is adopted to identify and classify different buildings in the village. A relocation plan including the number of buildings in each class and the reclamation area is provided and the cost and value of the plan is fully evaluated. The results demonstrate that compared with the traditional survey method, the proposed method of digital survey can better address the issue of remote mountain areas, including provide more accurate, complete and sustainable information, make the surveying and planning more convenient, efficient and smart and improve the objectivity of village relocation planning.
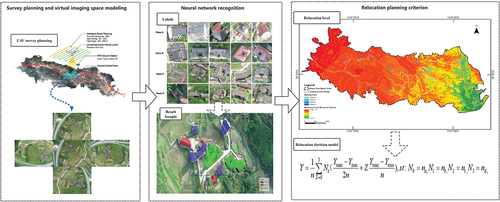
GRAPHICAL ABSTRACT
1. Introduction
With urbanization, mountainous rural areas experience a workforce outflow and decreased production. Only a small aging population remains behind to take care of villages with a large number of long-term vacant houses and abandoned arable land (Du, Zhang, and Chen Citation2021). the hollowing villages is the result of blind expansion which cause the current situation of a large number of idle rural land resources (Hu and Chen Citation2021). Under the rural revitalization strategy, the government of Lishui city proposed to carry out a “large-scale relocation and rapid gathering” project for the Beibu area that would determine villages with problems such as poor living conditions, fragile environments, frequent natural disasters, and continuing serious population loss; implement whole village relocation; and study village-merging scenarios (Zhang, Zhai, and Zong Citation2021). The orderly development of this project was prescribed to optimize contiguous cultivated land resources (Tang, Pan, and Liu et al. Citation2016), to encourage the planning and construction of villages with concentrated investment on rural infrastructure promotion, and to protect the interests of villagers, including working and living conditions (Liu, Yang, and Yun Citation2018).
Rural relocation is complex, both in implementation and resettlement, including the challenges of community construction, production development, and social governance (Bai and Ning Citation2018). The key to optimal scientific planning is the detailed research and evaluation of target relocation villages (King et al. Citation2014). The local government, in dealing with the Beibu area relocation project, proposed that planning should be based on land use classification and should consider individual housing conditions. In other words, relocation planning should first protect permanent farmland and natural resources, and then evaluate and classify individual buildings from the perspective of living risks and villagers’ vital interests. However, the remote distributed location, rugged topography, and large number of target buildings posed a challenge to the timeliness of the research and the allocation of human resources. The traditional ground survey method, with low efficiency and high cost (Liu Citation2016), cannot guarantee planners are always on call at research sites (Dang, Zhuang, and Chang Citation2020), which means that survey data are not intuitively connected with planning decisions. To solve these problems, planners focused on the application of aerial imagery, especially unmanned aerial vehicle (UAV) technology that supports fast data collection and tilt photography modeling (Feng Citation2019). With an improved route planning algorithm, UAV RTK module, and effective sensor pixels, tilt photography results can provide both high-precision spatial information and rich texture information (He, Dong, and Wang et al. Citation2020). UAV technology and product is in a phase of rapid development, by implementing an optimized image registration algorithm, a tilted photographic model is produced with three-dimensional multi-faceted information, which can improve off-site content identification and analysis. Ding and Yu tested the ability of virtual imaging space model of consumer – grade UAV, the projects results show the consumer UAV now have precise positioning system and high resolution aerial imaging. These studies confirm that the new consumer UAVs will greatly facilitate the survey of large area, and the cost and operation difficulty will be further reduced, and it is expected that more rural planning applications will be developed in the future(Ding Citation2021; ZD, H, and BA et al. Citation2018). Researchers often combine tilted photography model with spatial reference into other platform (Liu and Bai Citation2018; Peng and Lv et al. Citation2020) and relate to WebGL product (Zhang et al. Citation2020; Sánchez-Aparicio et al. Citation2020), thereby interactive visualisation of an urban simulation can realistically present and assist in developing good decisions that help create consensus (Wang and Zhang Citation2018). Moreover, tilt photography images, which record more information on surface texture and structural characteristics, can better facilitate rural building identification. Liu applied the 3DGIS for cadastral management and real estate investigation in countryside, this method records the real rural world situation directly in the form of three-dimensional model (M. Liu Citation2016), which can effectively help solve the villagers misunderstanding and ownership disputes when compare to the two-dimensional data. Campiani Leveraged 3D data and GIS for monitoring earthen architecture, and build the environmental risk maps for monitoring mud-brick decay and help to plan conservation actions (Campiani, Lingle, and Lercari Citation2019). Sun designed a visualization algorithm based on BIM and oblique photography through the open-source graphics engine (OSG) (Sun et al. Citation2017), which combined the three-dimensional model of the target building with the surrounding environment and created a virtual reality experience that can assist in evaluating the housing price . In Lee’s study, they built the 3D mesh model of building for automated building occupancy authorization, and tested reliability of models in small size (Lee et al. Citation2019). To identify and analysis building model results more efficiently, the researchers began to incorporate computer science into the project (Tremblay-Gosselin and Cretu Citation2014), Vetrivel developed a method to delineate buildings from a point cloud and applied the machine learning to perform the building damage assessment (Vetrivel et al. Citation2015). Xiong introduced method use tilt photography model to automated perform building damage assessment, and a CNN model based on VGGNet is adopted to identify and assess the damage for each building (Xiong, Li, and Lu Citation2020). Since rural self-built houses can have a range of unique materials and structures, traditional methods are increasingly unable to fully express the building type, especially regarding whether a building meets relocation requirements. The 3D GIS method contains three-dimensional multi-face information, and can store and visualize multi-type GIS big data based on WEBGL. It can improves the accuracy of 3D building model recognition by combining deep learning and computer vision, and has a high application prospect in rural building recognition.
Neural network is a mathematical model that simulates the structure and function of biological neural network, which is used to solve different problems. With the emergence of various neural network models, such as VGG, GoogleNet, and ResNet (Loffe and Szegedy Citation2015; Szegedy, Liu, and Jia et al. Citation2015), the field of image recognition has been greatly improved. Those deep learning networks perform better than traditional machine-learning-based recognition methods, especially regarding building identification. Recently, networks such as ECNN (Guo et al. Citation2017) and YOLO (Gao et al. Citation2021) have been widely used in building recognition and achieved good results. However, due to the orthography of remote sensing images, fewer building features were identified in these networks, and this affected the accuracy. To include more building features for identification, Mao used close-range photos to classify buildings and proposed multi-feature calibration building recognition based on transfer learning. This study defined building features manually and used a CNN network to extract features that were input to the network for final classification (Mao, Yu, and Yu et al. Citation2020). This method can somewhat improve the accuracy of building classification, but it does not support numerous classification types and is prone to interference from irrelevant objects, which reduces classification efficiency. Therefore, to improve the performance of building classification, we should not only consider the multi-layer architectural features, but the number of features type contained in the image, which has a direct effect on classification performance. Furthermore, the above studies focused on urban environments, which are well-planned when compared to mountain villages, and have the same types of building clusters, with similar materials and clear boundaries. The identification of buildings in mountain villages is greatly affected by the surrounding environment and the use of a variety of different materials and structures. As rural areas occupy nearly 60% of the area of China, it will be highly expensive and time-consuming to survey the mountainous countryside with scattered distribution and rugged terrain unless better methods are developed. Therefore, an optimized solution is required for building identification in mountain villages.
In this study, we selected pilot villages, established an online virtual space model of digital villages in 3D GIS, used a neural network model to build intelligent recognition and classification of relocation buildings, and established a set of three-dimensional technical information for mountain village relocation planning, seeking to provide theoretical and scientific support for relocation, planning, and development in rural revitalization.
2. Research area
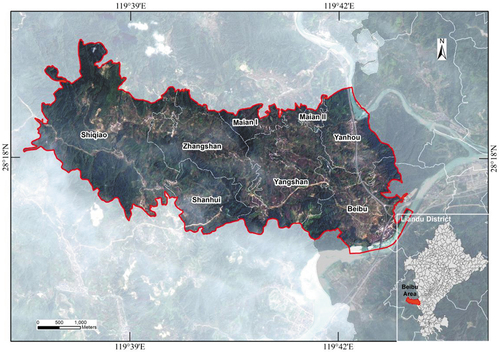
Beibu town is located in the southwest portion of Zhejiang Province, China. The range is about 119°37′20″E–119°43′5″, 28°19′30″–28°15′45″. Its total area is 29.7 km2, with seven administrative villages containing 25 unincorporated villages (). The central administrative village is in the southeast part of this area, with flat terrain and a river. The location of central administrative village is about 2 km west of the Dagangtou center town, and about 27 km from the center of Liandu District. West and north of the central administrative village are other large administrative villages. Its 25 natural villages are scattered in the mountains in the north and are highly affected by the topography; the villages come with imperfect infrastructure, tortuous and uneven roads, high traffic time, and dilapidated living facilities. By the end of 2021, Beibu town had 1265 households and a population of 2669. The economy was dominated by agriculture and forestry, with arable land and forest areas of 106.67 hectares and 2515.33 hectares, respectively.
Figure 1. Layout of Beibu town.
3. Research methods
The research was divided into two stages.
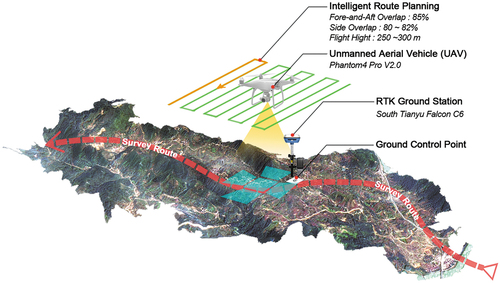
First, the 3D GIS real space digital village model of the pilot village was established by oblique photography and WEBGIS technology, support both offline discussion and cloud sharing. The construction of this WEBGL based 3D model consists of two data collection parts. The first part is unmanned aerial vehicle(UAV) 3D mapping (). In this survey part, we used Phantom 4 pro and ground RTK as aerial image capture devices and applied oblique photography record each research village. The data acquisition environment was a sunny, cloudless day with high air visibility. Oblique Photos that have been selected and reordered were imported into Bently context capture and output mesh point cloud models in OSGB format, and an online platform for real spatial visualization was constructed based on WEBGL. The second part comes with traditional methods, such as textual material collection and field surveys, were also used to conduct geo-information research, and the collected data were placed in the three-dimensiona digital village model. The collected content included the following aspects: 1) topography, location, and transportation; 2) land resources of villages, and records by classification, quantity, structure, characteristics, utilization, and utilization potential; 3) assessment of buildings and structures in each village in regard to quantity, volume, age, structure, valuation, and usage; and 4) population, number of households, family structure, jobs, and income levels.
Figure 2. Oblique photography and field survey setting.
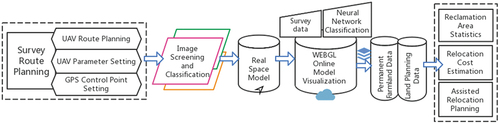
The second stage included the following: 1) we explored the industrial layout, development status, and development potential of each village based on model information, and discussed the industrial and demographic aggregation ability and potential problems of administrative villages and surrounding aggregation points; 2) we determined the willingness of residents to relocate, and analyzed the feasibility of relocation of each village by considering the potential industrial and land resources that could be moved and utilized; 3) we used a neural network model to identify village relocation buildings and count their numbers and areas; and 4) we established a land value information analysis model, through the analysis of land use value surplus, the advantages and disadvantages of industrial development, capital balance pressure, and other aspects, and provided results to support land space transfer and replacement schemes and assist in relocation planning. shows the technical route of the survey.
Figure 3. Technical route of investigation.
MaskR-CNN (He, Gkioxari, and Dollar Citation2017) is a instance segmentation algorithm which was used in building recognition and classification in this paper. The network included target detection and an FCN network. The target detection algorithm used Faster R-CNN, which uses a CNN to extract image features, and RoiAlign replaces Roipooling, which makes the error smaller when returning to the original image, also a region proposal network (RPN) is used to extract regions of interest. RPN is a lightweight neural network, which uses sliding windows to scan images and find areas where targets exist. Finally, a full connection layer is used for bounding box regression and classification prediction. The target detection part of Mask R-CNN used a feature pyramid network (Zhou, Li, and Dong et al. Citation2020). The shallow network features paid more attention to spatial information, and the deep network features to semantic information. A feature pyramid network integrated multiscale features, where each prediction considered different levels of feature information. This can reduce the missed detection rate, especially for small targets. The FCN network structure in the second part could segment candidate regions and classify their pixels into foreground and background. Because the whole regression frame was classified in the first part, the pixels where the foreground was located were the corresponding categories.
4. Results and analysis
4.1. 3D GIS real space model of village
The virtual imaging space model of pilot villages was established through UAV aerial oblique photography, which can quickly fit into the WEBGL map platform (). The model is used for the digital survey, multiparty discussion and providing image sources for the intelligent identification of buildings in the next step.
Figure 4. Three-dimensional digital model of pilot villages overlooking panorama.
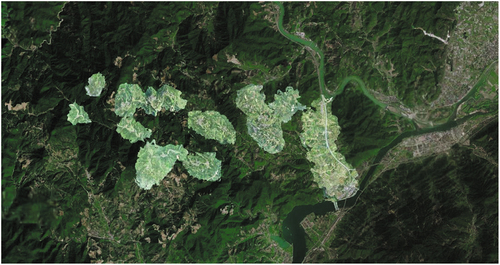
Figure 5. Oblique photographic modeling on some pilot villages.
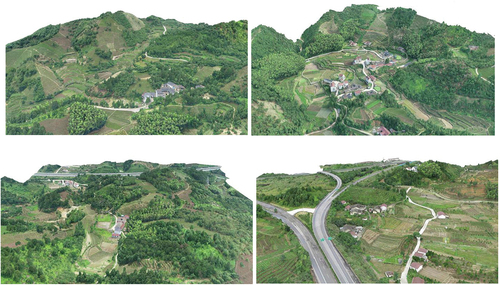
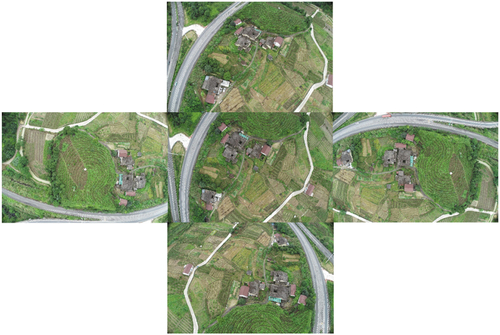
Figure 6. Sample of Oblique photographic in different angles oone village.
4.2. Intelligent identification of mountainous rural buildings
4.2.1. Building classification model
To facilitate rural planning for relocation and agglomeration, a classification model was established for mountain village buildings. Unincorporated village buildings were placed in four classes with different features, as discussed below and summarized in .
Table 1. Village building classification model.
Class A: Reinforced concrete or brick-concrete structures, which are generally new buildings, mostly residential with three or more floors. It is recommended that these buildings should be retained and modified in planning.
Class B: Mixed structures, such as mud and masonry, mostly old mud buildings, which have potential safety hazards and do not meet the requirements of architectural planning. These are recommended to be demolished to encourage household relocation.
Classes C: Old buildings with no historical value, destroyed buildings but with a complete building outline; recommended for relocation and demolition.
Class D: Old buildings with no historical value, destroyed buildings and not having a full building outline; recommended for relocation and demolition.
4.2.2. Neural network recognition and result analysis
Based on the building classification model, the buildings of the village are automatically recognized and classified using a neural network model with massive images. Previous studies have often used a fixed image angle to shoot ortho – photos, i.e., to shoot on the tops of different buildings, which can improve the extraction efficiency of architectural features and improve the recognition performance of the classification model. However, the collection of images in this way cannot include the building exterior features in different angles, and is susceptible to external factors. For example, the angle of the frontal image and shooting height will directly affect the quality of the images and reduce the accuracy of classification. Therefore, the use of fixed-angle orthophoto images for classification has limitations. Based on this, we selected architectural images from different angles, which contain the features of different sides of a building. After training, the model can recognize images from different angles, thus improving the efficiency and accuracy of recognition and classification.
Based on the real space model, the image were used to train a neural network, with the following steps.
Step 1: Data preprocessing: Orthographic images with clear building features were selected, and images of buildings with different orthophotos were also be selected (Figures in ). Labelme was used to label buildings, and different buildings have been labeled with different labels. ML-DBR (Wang and Zhang Citation2018) was adopted to enhance the data of images and generate new samples for training.
Step 2: Model construction: Mask-R-CNN was used as the classification model, and TensorFlow and Keras formed the framework. Mask-R-CNN can comprise different backbone networks, and different backbone networks have different performance. ResNet101 (KM, Xy, and Ren et al. Citation2016) was selected as the backbone network, and the network optimization adopted stochastic gradient descent (SGD).
Step 3: Parameter setting: Parameters play a key role in the performance of a neural network, and their selection affects the final classification results. We set the learning rate of Mask-R-CNN to 0.0001, the weight attenuation coefficient was 0.001, and the number of training steps was 10,000 ().
Table 2. The settings and parameters of mask-R-CNN model.
Step 4: Model training: Preprocessed images were placed into Mask-R-CNN for training.
Step 5: Evaluation metrics: Precision and Recall were selected as evaluation indicators. Precision measures true positive samples as a proportion of all samples predicted to be positive. The prediction of positive samples includes the prediction of positive samples as positive (TP) and of negative samples as positive (FP). Recall indicates the degree to which positive samples are predicted correctly. It also has two cases: the prediction of positive samples as positive (TP) and of positive samples as negative (FN). Generally, a better performing model has higher Precision and Recall. The metrics are calculated as:
Ten-fold cross-validation was used. Ten experiments were performed on each dataset, and the results were averaged. shows the experimental results assessed with Precision and Recall, where class A achieves the best results. The Precision and Recall of class B are both relatively low. The Precision of class C is lower, but the Recall is higher, and the Precision and Recall of class D are both higher. This is because the number of class A samples is large, their building sizes are also large, and the building features are more obvious and are generally not blocked by other obstacles, with the result that the recognition effect of class A is far better than that of other classes. The recognition effect of class B is poor because its numbers are small, and the features of classes B and C are difficult to distinguish in rural buildings, which causes confusion between the classes. Feature deviation caused by a UAV at different shooting angles can also lead to incorrect identification of classes B and C. The number in class D is small, but its recognition effect is better, because class D buildings features are irregular, the features are more obvious.
From and , the degree of building dispersion and the number of buildings in the image also have an effect on recognition results. As shown in , images with scattered buildings tend to have a small number of buildings, and images with densely distributed buildings tend to have more buildings. Images with a large number of scattered buildings have a better recognition effect than those with a large number of densely distributed buildings. This is because images with a small number of scattered buildings can completely extract their architectural features, while images with a large number of densely distributed buildings have the problem of missing architectural features due to mutual occlusion, which may lead to omissions and false detection.
Figure 7. Recognition results of different samples.
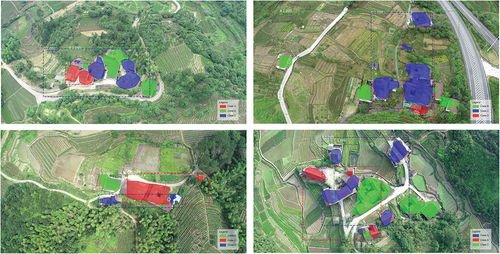
Table 3. Recognition results of different classes of buildings.
According to the recognition and statistics, in addition to administrative villages, pilot villages had a total of 890 buildings, covering an area of about 185,000 m2. Among them, class C buildings accounted for 53% in quantity and 48% in area, while class A buildings account for nearly 29 % in quantity and 28% in area; Class B buildings account for nearly 12% in quantity, but in area reaches 18%; class D buildings only account for 6% in quantity and 5% in area (see and for details). The results provide the important basis for the relocation planning of each natural village.
Figure 8. Number of existing buildings in pilot villages and their area percentages (excluding administrative villages).
Table 4. Summary statistics of existing buildings in pilot villages by type and volume (excluding administrative villages).
4.3. Relocation criterion of single village and results
Relocation planning needs to think deeper about the rationality and fairness in a diversified perspective (He and Dang Citation2015), it is important to reduce the burden and real property loss of native residents. We took the Beibu area as the mountainous rural area relocation research object, conducted field investigations, analyzed the status quo of natural villages, and constructed a preliminary relocation plan based on both the relocation necessity grade and restricted land-use evaluation. The relocation necessity grade scores the whole region from the perspectives of safety and convenience. The land-use evaluation is designed to distinguish buildings that whether its encroachment permanent farmland and nature conservation land. This two-step assessment allows for a specific analysis of each building. Planners can make visit plans and get feedback In less time, and ensure that every household’s relocation plan has an objective and practical basis (see and for details of the evaluation index system and results). is the relocation rationality evaluation index system, with 2 indicator classes and 5 detailed evaluation indicators. According to the national standards and native survey result, we graded each value from low to high based on construction safety and living convenience. The indicators grade is reclassified to raster data, and added to GIS software to complete spatial calculation. shows the visualization of the spatial weighted sum results of , and the legend of relocation level shows the unsuitable living condition from high to low.
Figure 9. Illustration of relocation level.
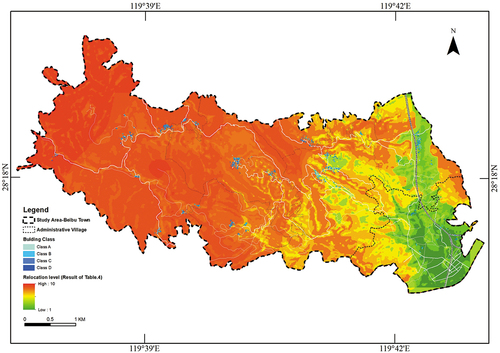
Table 5. The relocation rationality evaluation index system for Beibu relocation project.
Under the village scale and Quality of life, when class C and D buildings account for a large proportion of a village, it will be nearly totally relocated. Under this circumstance, the original structure and function of the village will be greatly or completely weakened and will directly impact the retained class A and B buildings. Therefore, for the relocation decision (), the Y value was designed to combine the Y1 (nor relocation urgency level) with the Y2 (nor relocation proportion) as an adjustment parameter to deeper consider the specific relocation situation of the building, and further help to determine the order of relocation phase, the coefficient of the Y1 is 0.4, and the coefficient of the Y2 is 0.6.
Table 6. Relocation decision for each building class.
Where Y is the relocation index for Beibu area, N is the number of buildings in each class, n is the total number of buildings, c is the number of building classes, and we let Rmax = 10.0 and Rmin = 0.0.
4.4. Multivariate data superposition analysis and reclamation area computation
Based on the relocation plan and classification results, the possible reclamation area and the economic value of a project can be calculated. The occupied area of buildings to be demolished is computed by automatic identification and classification with the 3D GIS and neural network models. The multivariate data of the 3D GIS model, DEM, urban planning, permanent farmland, and field survey are analyzed with a spatial superposition method to obtain the permanent farmland and nature reserve areas, which are overlaid with the occupied area of the buildings to be demolished. The effective reclamation area is obtained by removing the overlaid area and modifying it with the slope coefficient from the DEM as:
where Ba is the occupied area of the buildings to be demolished; and Fa and Na are the permanent farmland area and nature reserve area, respectively, which are overlaid with Ba. After the computation and field survey, the relocating population, relocating households, occupied area of buildings to be demolished, and possible reclamation area are calculated (listed in ) and the final relocation plan can be concluded.
Table 7. Reclamation area with different relocation plans.
4.5. Cost and value of relocation project
Finally, the cost and value of the relocation project can be calculated, serving as the economic evaluation for the government and villagers. According to the local land price of 974.5 RMB/m2, the reclamation land of 254,986.1 m2 could generate 248,483,954 RMB. Based on the local conditions, including the average number of persons per household, average living space per person, and construction cost of settlement houses, two compensation plans are proposed, as shown in , which indicate that monetary compensation is 171,950,000 RMB in total, leaving a net value of 76,533,954 RMB. If house compensation is adopted, the cost is the occupied area of 50,450 m2 and 189,187,500 RMB, which leaves a net value of 10,132,929.45 RMB (See ).
Table 8. Cost assessment of monetary compensation.
Table 9. Cost assessment of house compensation.
Relocation and reclamation can provide social and economic benefits, including the implementation of industrial farming, aggregation of population, adjustment of industry, and improvement of infrastructure.
5. Conclusion and prospects
This paper established a digital relocation planning method for the mountainous village and applied it to the relocation survey and planning of Beibu area. A digital 3D online model of the village was generated using the 3D GIS virtual imaging space model. The buildings of the village were automatically identified and classified using a neural network model. Statistical computations were made and a relocation plan was proposed, which has been adopted by local authorities. The method could provide accurate and complete information and help to improve the objectivity of village relocation planning. Compared to the traditional field planning survey, this method had the following advantages.
(1) The 3D digital space model could provide complete and accurate data and information of the village, including the appearance, building distribution, dimension, sunlight analysis, and visibility analysis, thus avoiding the use of traditional 2D information and text documents. The model could also serve as an interactive platform for different project participants. Even those who had not been to the field could easily and quickly obtain the required information, join the discussion, and make decisions, thus enhancing efficiency and productivity.
(2) The traditional field survey for a large mountainous village can be costly in terms of labor, supplies, and time, and would require an investigator with technical skills and a certain physical capacity. Virtual imaging space modeling, as used in this paper, could complete data collection in one or two days, even in a mountainous district with a large area. Therefore, it could save substantial time and resources and avoid repeated field trips and data omissions, making the survey more convenient and efficient. Compared with traditional visual building identification, the intelligent identification and classification method using a neural network model could make this process smart and efficient.
(3) The constructed digital village model could be loaded and saved on an online platform or through software. Authorized participants could review the model and acquire data and information anytime and anywhere with a computer or mobile device.
(4) The system containing the digital village model could be upgraded by adding more functions, e.g., intelligent data analysis, or integrated into the digital city model on a larger scale.
Therefore, it is evident that the digital relocation planning method could serve as an assistant method for traditional methods and gradually replace them with further project verifications. In addition, with the help of 5G technologies, this method shows great prospects in the relocation planning of towns and cities.
Acknowledgments
This research was supported by Public Technology Application Research of Zhejiang Province (LGG20F020020), Lishui Major Research and Development Program (2019ZDYF03), Postdoctoral Research Program (236527) of Zhejiang University of Technology, General Scientific Research Projects of Zhejiang Education Department(Y202044840); Public Technology Application Research of Lishui (2020SJZC078) and Science and Technology Key Research Planning Project of Zhejiang Province, China (2021C03136). These supports are appreciated. The authors also acknowledge support from government agencies during the research.
Disclosure statement
No potential conflict of interest was reported by the author(s).
Additional information
Funding
Notes on contributors
Zhe Wang
Zhe Wang, PhD Researcher, College of information Engineering, Zhejiang Univ. of Technology, 288 Liuhe Rd, Xihu District, Hangzhou City 310000, Zhejiang Province, China. Associate professor, College of Engineering, Univ. of Lishui, 1 Xueyuan Rd, Lishui City 32300, Zhejiang Province, China. Email: [email protected]
Zhixin Zhu
Zhixin Zhu College of Celadon, Univ. of Lishui, 1 Xueyuan Rd, Lishui City 32300, Zhejiang Province, China. (Corresponding Author). Email: [email protected]
Shuyue Zhou
Shuyue Zhou College of Engineering, Univ. of Lishui, 1 Xueyuan Rd, Lishui City 32300, Zhejiang Province, China. Email: [email protected]
Xiaocui Tang
Xiaocui Tang Associate professor, College of Engineering, Univ. of Lishui, 1 Xueyuan Rd, Lishui City 32300, Zhejiang Province, China. Email: [email protected]
Wenyao Zhu
Wenyao Zhu, PhD Associate professor, College of Engineering, Univ. of Lishui, 1 Xueyuan Rd, Lishui City 32300, Zhejiang Province, China. Email: [email protected]
Pan Zhou
Pan Zhou College of Engineering, Univ. of Lishui, 1 Xueyuan Rd, Lishui City 32300, Zhejiang Province, China. Email: [email protected]
Gang Xiao
Gang Xiao, PhD Professor, College of information Engineering, Zhejiang Univ. of Technology, 288 Liuhe Rd, Xihu District, Hangzhou City 310000, Zhejiang Province, China. Email: [email protected]
References
- Bai, Y. X., and Q. Ning. 2018. “Study on Mechanism System of Relocation of Poverty Alleviation[J].” Journal of Northwest University (Philosophy and Social Sciences Edition) 48 (4): 62–74.
- Campiani, A., A. Lingle, and N. Lercari. 2019. “Spatial Analysis and Heritage Conservation: Leveraging 3-D Data and GIS for Monitoring Earthen Architecture[J].” Journal of Cultural Heritage 39: 166–176. doi:10.1016/j.culher.2019.02.011.
- Dang, T. Y., W.M. Zhuang, and Q. Chang. 2020. “A New Method for Rural Architecture Design: Analysis of UAV Oblique Photography Acquiring True 3D Model Technology[J].” Huazhong Architecture 38 (2): 32–37.
- Ding, Y. Y. 2021. “Study on High Precision Naked-eye 3D Mapping Method Based on Oblique Image of Consumer Unmanned Aerial Vehicle[J].” ShangDong Land and Resources 37 (8): 57–61.
- Du, G. M., M.Q. Zhang, and L. Chen. 2021. “Study on the Promotion of Poverty Villages Regional Development by Relocation of Poverty Alleviation - Taking Lujia Village, Tongyu County, Jilin Province as an example[J].” Chinese Journal of Agricultural Resources and Regional Planning 42 (9): 90–98.
- Feng, W. 2019. “Application of Unmanned Aerial Vehicle Survey Technology in Alpine and High Altitude Complex and Difficult Mountainous area[J].” Journal of Railway Engineering Society 36 (8): 9–13.
- Gao, J., Y. Chen, Y. Wei, and J. Li. 2021. “Detection of Specific Building in Remote Sensing Images Using a Novel YOLO-S-CIOU Model. Case: Gas Station Identification[J].” Sensors 21 (4): 1375. doi:10.3390/s21041375.
- Guo, Z., Q. Chen, G. Wu, Y. Xu, R. Shibasaki, and X. Shao. 2017. “Village Building Identification Based on Ensemble Convolutional Neural Networks[J]”. Sensors 17: 2487. doi:10.3390/s17112487.
- He, D. G., and G.Y. Dang. 2015. “Study on Implementation Deviation of the Poverty Alleviation and Relocation Policy in the Western Mountainous Areas: Based on the Field Survey in Southern Shanxi[J].” Journal of National School of Administration, no. 5: 119–123.
- He, C., Z. H. Dong, Y. Wang, J. Li, K. P. Li, and S. L. Hou. 2020. “Forest Resource Data Obtained by UAV Stereo Photography[J]”. Bulletin of Surveying and Mapping (6): 28–31.
- He, K. M., G. Gkioxari, and P. Dollar. 2017. “Mask R-CNN[C].” International Conference on Computer Vision, Venice, Italy, 2980–2988.
- He, K.M., X. Y. Zhang, S. Q. Ren, and J. Sun. 2016.“Deep Residual Learning for Image Recognition[C]// 2016.” IEEE Conference on Computer Vision and Pattern Recognition (CVPR), Las Vegas, NV, 770–778.
- Hu, Z. H., and L. Chen. 2021. “Research on the Governance of Rural Hollowing Out Problem under the Perspective of Trilateral Game in Wenzhou City, Zhejiang Province[J].” Research on Development, no. 1: 84–90.
- King, D., D. Bird, K. Haynes, H. Boon, A. Cottrell J. Millar, T. Okada P. Box, D. Keogh, and M. Thomas. 2014. “Voluntary Relocation as an Adaptation Strategy to Extreme Weather Events[J]”. International Journal of Disaster Risk Reduction 8: 83–90. doi:10.1016/j.ijdrr.2014.02.006.
- Lee, S. H., S. H. Woo, J. R. Ryu, and S. Y. Choo. 2019. “Automated Building Occupancy Authorization Using BIM and UAV Based Spatial Information.” Photogrammetric Reverse Engineering[J]. Journal of Asian Architecture and Building Engineering 18 (2): 151–158. doi:10.1080/13467581.2019.1631172.
- Liu, M. 2016. “Application of Inclined Photogrammetry Technology in 3D Cadastral and Real Estate Investigation in the Countryside of Fujian[J].” Journal of Shenyang Jianzhu University Social Science 18 (4): 359–363.
- Liu, W. G. 2016. “Application of Multi-scale 3D Remote Sensing Technology for Geological Investigation in Railway[J].” Journal of Railway Engineering Society 33 (8): 40–43,99.
- Liu, J., and D. Bai. 2018. “3D Point Cloud Registration Algorithm Based on Feature Matching[J].” Acta Optica Sinica 38 (12): 232–239.
- Liu, X. W., H. K. Yang, and W. J. Yun. 2018. “Patterns of Land Consolidation Promoting Poverty Alleviation in Poor Areas and Its Application[J].” Transactions of the Chinese Society of Agricultural Engineering 34 (5): 242–247.
- Loffe, S., and C. Szegedy. 2015. “Batch Normalization: Accelerating Deep Network Training by Reducing Internal Covariate Shift[C]//.” Proceedings of International Conference on Machine Learning, Lille. 448–456.
- Mao, J., L. Yu, H. Yu, and W. Sheng. 2020. “A Transfer Learning Method with Multi-feature Calibration for Building Identification[C] 2020.” International Joint Conference on Neural Networks (IJCNN) Glasgow, United Kingdom.
- Peng, Z., Y. J. Lv, C. Qu, and D. H. Zhu. 2020. “Accurate Registration of 3D Point Clouds Based on Keypoint Extraction and Improved Iterative Closest Point Algorithm[J].” Laser & Optoelectronics Progress 57 (6): 60–71.
- Sánchez-Aparicio, L. J., M. G. Masciotta, J. G. Alvarez, L. F. Ramos, D. V. Oliveira, J. A. Martín-Jiménez, and D. González-Aguilera. 2020. “Web-GIS Approach to Preventive Conservation of Heritage buildings[J]”. Automation in Construction 118: 103304. doi:10.1016/j.autcon.2020.103304.
- Sun, T. W., Z. Xu, J. Y. Yuan, C. Liu, and A. Ren. 2017. “Virtual Experiencing and Pricing of Room Views Based on BIM and Oblique Photogrammetry[J]”. Procedia Engineering 196: 1122–1129. doi:10.1016/j.proeng.2017.08.071.
- Szegedy, C., W. Liu, Y. Q.,Jia, P. Sermanet, R. E. Reed, D. Anguelov, D. Erhan, V. Vanhoucke, and A. Rabinovich. 2015. “Going Deeper with Convolutions[C].” Proceedings of IEEE Conference on Computer Vision and Pattern Recognition, Boston, 1–8.
- Tang, X. M., Y. C. Pan, Y. Liu, N. Guan, and N. Wei. 2016. “The Investment and Implementation Model and Path Analysis of Cultivated Land Consolidation in China[J].” China Land Science 30 (8): 56–62.
- Tremblay-Gosselin, J., and A. M. Cretu. 2014. “A Supervised Training and Learning Method for Building Identification in Remotely Sensed Imaging[C].” IEEE International Symposium on Robotic & Sensors Environments, IEEE.
- Vetrivel, A., M. Gerke, N. Kerle, and G. Vosselman. 2015. “Identification of Damage in Buildings Based on Gaps in 3D Point Clouds from Very High Resolution Oblique Airborne Images[J]”. ISPRS Journal of Photogrammetry and Remote Sensing 105: 61–78. doi:10.1016/j.isprsjprs.2015.03.016.
- Wang, B. G., and R. K. Zhang. 2018. “Application of Unmanned Aerial Vehicle Tilt Photogrammetry in Planning Schemes Comparison and Selection[J].” Bulletin of Surveying and Mapping, no. 1: 143–146.
- Xiong, C., Q. Li, and X. Lu. 2020. “Automated Regional Seismic Damage Assessment of Buildings Using an Unmanned Aerial Vehicle and a Convolutional Neural Network[J].” Automation in Construction 109 (1): 102994.1–102994.14. doi:10.1016/j.autcon.2019.102994.
- Yu, Z. D., H. Li, F. Ba, and Z. Y. Wang. 2018. “3D City Model Construction Based on a Consumer-Grade UAV[J].” Remote Sensing for Land & Resources 30 (2): 67–72.
- Zhang, S. R., D. J. Hou, C. Wang F. Pan and Y. Lei. 2020. “Integrating and Managing BIM in 3D Web-based GIS for Hydraulic and Hydropower Engineering Projects[J]”. Automation in Construction 112: 103114. doi:10.1016/j.autcon.2020.103114.
- Zhang, Y., G. F. Zhai, and K. Zong. 2021. “Exploration on the Industrial Planning of Relocated Villages in the Post-poverty Period: A Case Study of Zhongxing Village, Jinhu County, Jiangsu Province[J].” Development of Small Cities & Towns 39 (3): 32–40.
- Zhou, S. Y., X. B. Li, and Y. H. Dong. 2020. “A Decoupling and Bidirectional Resampling Method for Multilabel Classification of Imbalanced Data with Label Concurrence[J].” Scientific Programming 2020: 1–10.