
 ?Mathematical formulae have been encoded as MathML and are displayed in this HTML version using MathJax in order to improve their display. Uncheck the box to turn MathJax off. This feature requires Javascript. Click on a formula to zoom.
ABSTRACT
Historic buildings are public symbols, standing as sacred reminders. Many of them have been recognized as World Heritage Sites. In this study, real time vibration measurement of an important axisymmetric masonry pagoda was performed. With the measured vibration data, inverse analysis was proposed to backward determine its damping and natural period. The proposed algorithm utilizes Duhamel’s time integration method for solving the equation of motion and the Gauss-Newton algorithm to minimize the sum-of-squares error between the calculated and real-time measured accelerations of the structure. Four distant earthquake-induced vibrations were recorded and used for the analysis. The results show that the dynamic parameters determined by the proposed method agree with those obtained from the previous study adopting finite element analysis. The obtained dynamic properties of the two perpendicular directions are slightly different, indicating the non-homogenous body of the axisymmetric structure or there would be a particular damage zone. From the results, an onsite damage investigation can be specifically identified. In summary, continuous structural health monitoring and time-dependent deterioration of historic buildings are possible with real time measurement and the proposed analytical algorithm.
Graphical Abstract
1. Introduction
Earthquakes have the power to cause massive destruction to cities. As an earthquake cannot be avoided, many efforts have been made to establish an effective preparedness plan (Ketsap et al. Citation2019; Saicheur and Hansapinyo Citation2017). With limited earthquake mitigation resources, critical buildings have been identified and prioritized based on the impact of consequential loss. Among the different building types, historic buildings have been built for many years, and the construction techniques used at that time were substandard in terms of seismic consideration. In addition, the buildings are categorized as valuable symbols of people’s beliefs. Seismic damaged buildings or other infrastructure can be demolished and re-built. However, this is not possible for historic buildings. Hence, the buildings are classified and ranked as the most critical, requiring urgent seismic strengthening (Saicheur and Hansapinyo Citation2016). Many active faults have been found in the north of Thailand and there was a magnitude 6.3 earthquake in Chiang Rai Province on 5 May 2014. The strike caused damage to buildings across a large area (Hansapinyo, Latcharote, and Limkatanyu Citation2020). There are many historic unreinforced masonry buildings in the region that require seismic strengthening. To achieve the task, information about the dynamic properties of the structures, e.g., the damping ratio and fundamental period of vibration, is indispensable for seismic vulnerability analysis.
Modal analysis of a fully three-dimensional finite element model has been successfully adopted to estimate the dynamic properties for a numerical approach to vibration analysis. Ferraioli et al. (Citation2017) adopted the finite element method for dynamic characterization and seismic assessment of medieval masonry towers. Adam et al. (Citation2020) assessed minaret structural efficiency, safety margin, and serviceability limits using a 3D finite element model coded in ANSYS v.15 program. However, the method is limited to buildings with an available as-built drawing. Due to a lack of data on long-term-built historical buildings and time-related deterioration, using the modal analysis necessitates making unknown assumptions, resulting in an unrealistic result.
On the other approach, on-site dynamic-based monitoring has been widely adopted in recent years (Aloisio et al. Citation2021; Tantisukhuman et al. Citation2023; Azzara et al. Citation2018; Gentile, Ruccolo, and Saisi Citation2019). For a historic building, structural deterioration has been progressively developed over time due to repetitive loads, environmental effects, and vibration-induced loads. Hence, structural health monitoring (SHM) has been a popular research topic (Mishra, Lourenço, and Ramana Citation2022). Early detection of damage can avoid drastic failure and accomplish cost-effective maintenance. Although the damage is physically local behavior, there have been guidelines and many successful applications of the vibration test to determine the global response (AASHTO Citation1990; BS Citation7385–1 1990; ISO 4866 Citation2010). Although, the on-site vibration measurement is costly and time-consuming, the high reliability of the measured data makes the instrument popular. Danish et al. (Danish, Tayyab, and Salim Citation2020) applied accelerometers to indicate the reduction in natural frequencies of damage detection of three reinforced concrete beams. Monti et al. (Citation2018) introduced wireless accelerometers for the continuous “trigger-free” dynamic monitoring system for the Colosseum in Rome under vibrations induced by natural and man-made excitations. The ambient vibration test is a widely used technique to identify the dynamic properties of historical buildings, and it was conducted on the masonry roof of the Basilica of the Fourteen Holy Helpers in Bavaria, southern Germany (Compan, Pachón, and Cámara Citation2017). These dynamic structural parameters, identified using the operational modal analysis method (OMA), allow the adjustment of numerical models to obtain a more accurate estimation of the actual behavior of the structure. The ambient vibration test was also used in Lebanon and Turkey (Salameh et al. Citation2017; Altunişik et al. Citation2020). The method provides the vibration properties from a global point of view. As the ambient vibration intensity is a very low-intensity signal, it requires a meticulous procedure to identify the dynamic properties of specific elements with a local character. Civera, Mugnaini, and Fragonara (Citation2022) proposed the novel-multistage clustering algorithm for automatic operational analysis (AOMA) and the vibration modes of a laboratory scaled-down replica of a masonry arch bridge were correctly identified up to the fifth mode. Another popular method to estimate the dynamic properties of buildings is inverse analysis. This method is driven by the precise measurement of the deformation of the structure during vibration, and the subsequent inverse mathematical analysis is then performed. The inverse analysis was applied to the diagnostics of a historic bridge in the Czech Republic (Klusáček, Nečas, and Bureš Citation2015). The key component of the inverse analysis method is the estimation of structural vibration via numerical time integration with initial values of dynamic parameters, i.e., damping ratio or stiffness. Then the dynamic parameters are adjusted to minimize the error between the measured vibration responses to the calculated response obtained from numerical time integration. The process is iterated until an error meets some specified tolerance value.
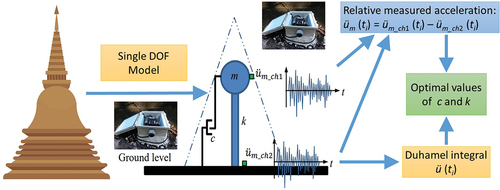
In the present work, the inverse analysis method was used to backward identify the dynamic properties of a masonry pagoda from the measured vibration responses. The ultimate goal is to develop an algorithm to early detect the change of dynamic properties, implying the occurrence of structural damage, and an on-site detail investigation can be performed without delay. Two vibrational sensors were installed on the pagoda at the top and base levels to monitor the vibration responses when an earthquake occurred. The responses had been real-time continuous triggered at a sampling rate of 100 times/sec. and stored on a cloud-based storage system. With the measured ground as the input excitation and initially assumed dynamic properties, the numerical solution of the equation of motion using Duhamel’s time integration for the top acceleration was determined. However, the difference between the measured and calculated top-level accelerations was certainly observed due to previously assumed wrong dynamic properties. Then, the Gauss-Newton algorithm was applied to obtain the dynamic parameters, which iteratively minimized the sum-of-squares error (SSE) between the calculated and real-time measured accelerations. The dynamic properties were iteratively converged when the SSE was smaller than a certain defined tolerance. In this study, the results of the estimated parameters from four distant earthquake waves were compared to identify the accuracy of the present method.
2. Pagoda and vibration measurement
2.1. Pagoda
The studied historic building is a pagoda in Umong temple (), located west of Chiang Mai city. The pagoda was built in 1297 by King Mengrai. It’s height is 25.72 m from the base, and its diameter at the base is 16.48 m. The pagoda was constructed using medieval masonry without reinforcement, formed in an inverted-bell shape with circular cross-sections. Hence, the structure is axisymmetric about the vertical axis. The approximate volume of the pagoda is 1,655 m3. (Hansapinyo Citation2014).
Figure 1. Umong pagoda.

2.2. Acceleration measurements
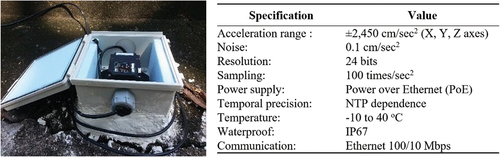
Two tri-axial accelerometer sensors from aLab Inc. were installed on the pagoda at the top, approximately 18.70 m from the ground, and base using waterproof glue cement. shows the specification and the installation. The sensors were securely kept in a box that protects them from severe environmental conditions such as temperature, humidity, and rain. The sensors measure acceleration in three components: two perpendicular horizontal and vertical directions. As the pagoda is axisymmetric, the sensors were placed to allow the two horizontal directions to coincide with the tangential and radial directions of the pagoda’s section. The acceleration of the pagoda was measured in real-time with a sampling rate of 100 times/sec. The measured acceleration data was sent to a cloud-based storage system through a local PC station. When the sensors detected a certain level of vibration larger than the normal ambient vibration, a notification message was sent out to the system administrator.
Figure 2. Specification and installation of accelerometer.
2.3. Earthquake data
As shown in , four distant earthquake data sets were used to estimate the dynamic parameters. The epicenters of all earthquake events were in Myanmar (). The first three earthquakes, which were located in the same area, are on the west side of the pagoda. The last earthquake was on the north side. The earthquake magnitude was mb 4.6–5.1, with a distance between the epicenters and the pagoda of 200–306 km. All the earthquakes occurred in the same time period, from 17 March 2018 to 1 July 2018. Hence, the influence of time-dependent deterioration is negligible. shows the real-time measurement of NS and EW ground accelerations in the time domain and frequency domain at the pagoda’s base of the earthquake wave no. 4. The real-time measured ground acceleration increased when the earthquake struck.
Figure 3. Locations of earthquake sources and pagoda.
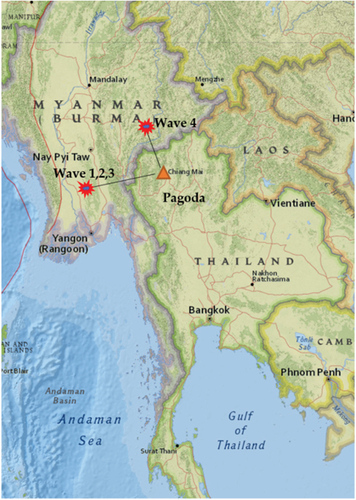
Figure 4. Ground acceleration in time and frequency domains of the earthquake wave no. 4 in (a) North-South direction, and (b) East-West direction.
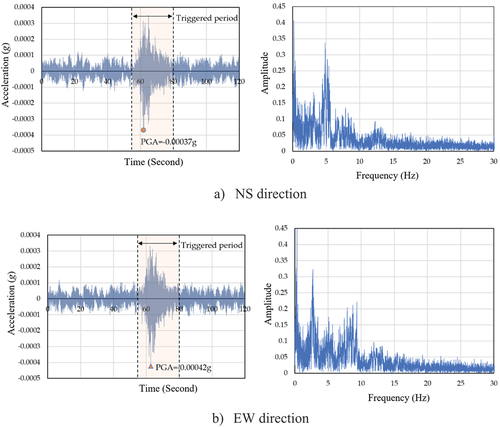
Table 1. Epicenters of seismic waves.
3. Estimation of dynamic parameters
In this section, theoretical issues employed in the inverse analysis for dynamic parameter estimation are addressed. First, the equation of motion to compute the response of a simplified equivalent single-degree of freedom system is described. Then, solving the equation of motion for the system’s acceleration numerically using Duhamel’s integral is explained. Finally, the Gauss-Newton iteration scheme to evaluate the dynamic parameters is illustrated.
3.1. Analytical model and equation of motion
The pagoda’s inverted bell shape is considered a triangular-like shape, as indicated by the dotted line in . The structure is axisymmetric in that every horizontal cross-section is circular, tapering toward the top without mass separation along the elevation. The structural vibration is naturally dominated by lateral movement. Hence, the vibration of the pagoda is simplified as a single degree of freedom system, and the equation of motion is expressed as
Figure 5. Simplified single degree of freedom (SDOF) system of the pagoda and position of accelerometers (green boxes).
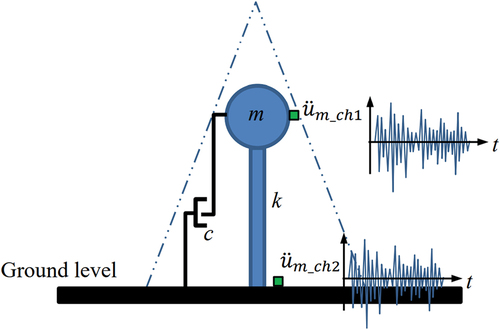
where ,
, and
are relative lateral displacement, velocity, and acceleration of the pagoda, respectively. Structural mass is denoted by m. The damping coefficient and stiffness are represented by c and k respectively. Ground acceleration is denoted by üg.
To eliminate the mass parameter, dividing Equationequation (1)(1)
(1) by the structural mass (m) results to
where ω is the natural frequency of the structure and ζ is the damping ratio
. Next, applying the theory of dynamic analysis (Clough and Penzien Citation1993), the numerical solution of relative acceleration in Equationequation (2)
(2)
(2) due to input ground accelerations is obtained. In this work, Duhamel’s integral based on Simpson’s rule are performed.
3.2. Determination of acceleration response using duhamel’s integral
Solving Equationequation (2)(2)
(2) numerically using Duhamel’s integral, the equation is assumed to be a linear equation with constant dynamic parameters (ζ and ω). Hence, the solution at time t can be obtained from the superposition of structural responses due to unit-impulse ground acceleration. The equations for solving Equationequation (2)
(2)
(2) are briefly described here, and more details can be found in structural dynamic textbooks (Clough and Penzien Citation1993). For a single-degree of freedom damped system with a unit mass and initially at rest, solutions for displacement u(t) and velocity
in Equationequation (2)
(2)
(2) become:
where is the damped free-vibration frequency. To solve Equationequations (3)
(3)
(3) and (Equation4
(4)
(4) ), time variant is discretized into a finite equal time interval ∆τ. The coefficients A(t) and B(t) can be expressed as follows:
where the function and
. Simpson’s rule is adopted for the numerical integration. Finally, the relative acceleration of the system is computed from the equation of motion, Equationequation (2)
(2)
(2) , i.e.:
The calculated acceleration () of the system in Equationequation (7)
(7)
(7) is compared with the measured acceleration, the relative acceleration between
, and
(), and the convergence of the optimized dynamic parameters ζ and ω of the system is checked. The procedure to iteratively compute the dynamic parameters is explained in the next section.
3.3. Gauss-Newton algorithm for inverse analysis of dynamic parameters
The Gauss-Newton algorithm is a method to minimize the sum of squared function values. First, the dynamic parameters in Equationequation (2)(2)
(2) are redefined as b1 ≡ 2ωζ and b2 ≡ ω2. Hence, Equationequation (2)
(2)
(2) is re-expressed in terms of b1 and b2 as follows:
The calculation steps for determining the dynamic parameters b1 and b2 through the Gauss-Newton method is shown in (Miyamoto and Hanazato Citation2015). The measured ground excitation is given first. Next, the initial values of ζ and ω are approximated to obtain the initial values of b1 and b2. Then, the relative acceleration of the Pagoda, ü according to Equationequation (7)
(7)
(7) , is numerically computed using Duhamel’s integral described in the previous section. Next, the Sum-Square-Error (SSE) between the calculated acceleration ü and the measured acceleration
is determined, as seen in Equationequation (9)
(9)
(9) . It is noted from the equation that the SSE is numerically evaluated from i = 0 through all n time intervals, indicated by time ti. The values of b1 and b2 are iteratively updated from the k to k + 1 Gauss-Newton iteration to minimize the Sum-Square-Error (SSE(k+1)) between the acceleration obtained from Duhamel’s integral at time ti,
, versus the measured relative acceleration, üm(ti) (
at the time ti).
Figure 6. Gauss-Newton procedure to determine the dynamic parameters b1 and b2.
The Gauss-Newton iteration is derived by introducing the linear approximation of the computed acceleration from Duhamel’s integral due to change of the dynamic parameters, ∆b1 and ∆b2, in each Gauss-Newton iteration, i.e.
where denotes an acceleration computed from Duhamel’s integral at time ti from current values of dynamic parameters,
and
.
Taking the partial derivative of Equationequation (8)(8)
(8) with respect to b1 and b2 results in two second-order linear ordinary differential equations as follows:
With the obtained relative velocity and displacement from Equationequation (8)(8)
(8) , the partial derivative of the relative acceleration in Equationequations (11)
(11)
(11) and (Equation12
(12)
(12) ), ∂ü/∂b1 and ∂ü/∂b2, are solved numerically using the Duhamel’s integral and then substituted into Equationequation (10)
(10)
(10) . With the previous iteration acceleration,
, the left-hand term in Equationequation (10)
(10)
(10) can be solved. Finally, the SSE in Equationequation (9)
(9)
(9) can be obtained. Next, minimizing the total SSE(k + 1) with respect to ∆b1 and ∆b2., as shown in Equationequation (13)
(13)
(13) , gets the algebraic Equationequations (14)
(14)
(14) for computing the incremental values of dynamic parameters, ∆b1 and ∆b2, as follows:
where denotes measured values of relative acceleration between the top (Ch1) and base (Ch2) of the pagoda at time ti, shown in . Then, the values of parameters b1 and b2 are updated using incremental values ∆b1 and ∆b2 obtained from Equationequation (14)
(14)
(14) , i.e.:
The dynamic parameters b1 and b2 are updated according to Equationequations (15)(15)
(15) and (Equation16
(16)
(16) ). Solving the structural responses and updating the dynamic parameters have been repeated until the incremental values ∆b1 and ∆b2 are less than a certain tolerance level, i.e.:
After the values of dynamic parameters (b1 and b2) are converged, the natural frequency and the damping ratio are then evaluated using the relations:
The natural frequency of structure in radian per second (ω) is then divided by factor 2π to obtain the natural frequency in Hz (f) as follows:
In the next section, the dynamic parameters of Umong pagoda will be evaluated via Gauss-Newton process. Four earthquake waves are used to represent the ground acceleration in Equationequation (8)(8)
(8) . The converged values of the natural frequency and the damping ratio computed from four earthquake waves will be discussed.
4. Results and discussions
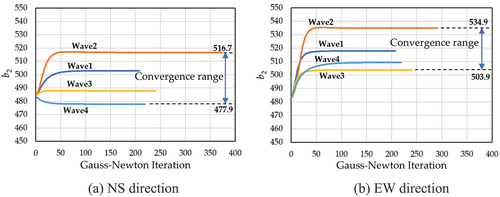
The dynamic parameters, b1 and b2, obtained by the inverse analysis using the four recorded earthquake waves, are demonstrated here. shows the convergence of the damping parameter b1 in the NS and EW directions. The convergence range of b1 is between 0.68 and 1.33 in the NS direction and 0.57–1.11 in the EW direction. For the parameter b2, as shown in , the convergence ranges between 477.9–516.7 and 503.9–534.9 in the NS and EW directions, respectively.
Figure 7. Convergence of damping parameter (b1).
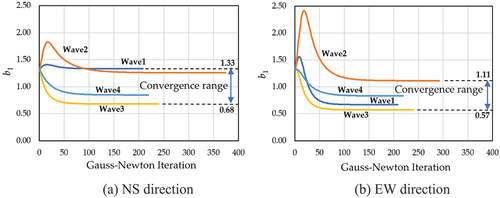
Figure 8. Convergence of stiffness coefficient (b2).
With the converged dynamic parameters b1 and b2, the values of natural frequency (f) and the damping ratio (ζ) can be computed using Equationequations (18)(18)
(18) and (Equation19
(19)
(19) ), as shown in . The average values (Avg.) and standard deviation (SD) of the damping ratio are 0.0231 and 0.0068 in the NS direction and 0.0175 and 0.0050 in the EW direction. The average values (Avg.) and standard deviation (SD) of the natural frequency are approximately 3.55 Hz and 0.06 Hz in the NS direction and 3.62 Hz and 0.05 Hz in the EW direction. The average natural frequency in this study is slightly lower than the 4.45 Hz of the modal analysis of the three-dimensional finite element model obtained from the previous research (Yanathanom Citation2010; Hansapinyo and Poovarodom Citation2014). This is because the finite element analysis rigidly assumed a full-solid body of the pagoda. Furthermore, the fully fixed base was used in the finite element model.
Table 2. The computed dynamic properties using the proposed algorithm.
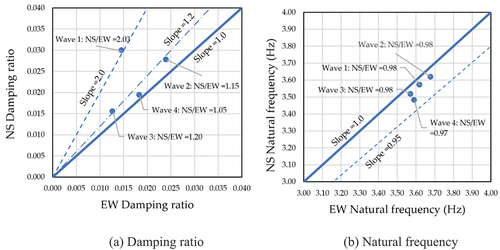
As the pagoda is ideally axisymmetric, the dynamic properties in any direction should be equally observed. shows the comparisons between the dynamic properties obtained in the NS direction (Y-axis) and the EW direction (X-axis). The equality line with a slope of 1.0 indicates identical properties in both directions. ) shows that the damping ratios obtained from the four waves are greater than the equality line. In other words, the damping ratios in the NS direction are greater than those in the EW direction. The ratio between the NS/EW damping ratios is less than 1.20 for Waves 2, 3, and 4. The ratio is about 2.03 for Wave 1. For the natural frequency, from ), the EW frequencies are higher than those values in the NS direction. Hence, the structural stiffness in the EW direction is greater than in the NS direction.
Figure 9. Comparisons of the obtained dynamic properties in the two orthogonal directions.
5. Conclusions
In this study, an algorithm of inverse analysis to evaluate the dynamic properties of a historic building is proposed. The proposed algorithm adopts the Duhamel’s integral to numerically solve the equation of motion and the Gauss-Newton algorithm to minimize the sum-of-squares error (SSE) between the calculated and real-time measured accelerations of the structure. Based on the real-time measured relative acceleration of the pagoda and the calculation using the proposed algorithm, the dynamic parameters are backward estimated. Four distant earthquake waves are used for the numerical experiments. Based on the study results, the following conclusions can be drawn.
From the real-time measured vibrations, the average damping ratios are 0.0231 in the NS direction and 0.0175 in the EW direction. The average natural frequencies are 3.55 Hz in the NS direction and 3.62 Hz in the EW direction. The average natural frequency in this study is slightly lower than the 4.45 Hz of the modal analysis of the three-dimensional finite element model obtained from the previous study (Yanathanom Citation2010); (Hansapinyo and Poovarodom Citation2014). This is because the analysis rigidly assumed a full-solid body of the pagoda. Furthermore, the fully fixed base was used in the analytical model.
As the pagoda is ideally axisymmetric, the dynamic properties in any direction should be equally observed. However, there are some discrepancies in the dynamic properties between the two orthogonal directions. The damping ratio in the NS direction is greater than in the EW direction. It may indicate more damage to the structure resisting lateral load in the NS direction. For the natural frequency, the EW frequencies are higher than those values in the NS direction. Hence, the structural stiffness resisting lateral load in the EW direction is probably greater than that in the NS direction. From the results, an onsite damage investigation can be specifically identified.
Although conducting finite element analysis to determine the dynamic properties is a convenient method, it is a time-consuming practice if high accuracy is required. In addition, the main drawback of using finite element analysis is that it involves various assumptions and modeling parameters that may not reflect the real-existing physical behavior. Hence, using the proposed technique is a powerful approach. With the attached sensor cooperating with the data processing, real-time monitoring can be done.Funding This research was funded by Chiang Mai University, NRCT (FF2022-CMU); TRF Research Scholar (RSA6280039); TRF Senior Research Scholar (RTA6280012); and Electricity Generating Authority of Thailand.
Acknowledgments
The second author would like to acknowledge supports from Fundamental Fund 2022, Chiang Mai University. The first author would like to acknowledge supports provided by Center of Excellence, Chiang Mai University.
Disclosure statement
No potential conflict of interest was reported by the author(s).
Data availability statement
Data available on request from the authors
References
- AASHTO. 1990. Standard Recommended Practice for Evaluation of transportation-related Earthborne Vibrations. Washington, DC: American Association of State Highway and Transportation Officials, AASHTO.
- Adam, M. A., T. S. El-Salakawy, M. A. Salama, and A. A. Mohamed. 2020. “Assessment of Structural Condition of a Historic Masonry Minaret in Egypt.” Case Studies in Construction Materials 13. doi:10.1016/j.cscm.2020.e00409.
- aLab. 2022. “Seismic Acceleration Sensor ITK System for Structural Health Monitoring.” Accessed March 2022. http://www.alab.jp/
- Aloisio, A., E. Antonacci, M. Fragiacomo, and R. Alaggio. 2021. “The Recorded Seismic Response of the Santa Maria Di Collemaggio Basilica to Low-intensity Earthquakes.” International Journal of Architectural Heritage 15 (1): 229–247. doi:10.1080/15583058.2020.1802533.
- Altunişik, A. C., O. Ş. Karahasan, F. Y. Okur, E. Kalkan, and K. Özgan. 2020. “Ambient Vibration Test and Modelling of Historical Timber Mosques after Restoration.” Proceedings of the Institution of Civil Engineers-Structures and Buildings 173: 956–968.
- Azzara, R. M., G. D. Roeck, M. Girardi, C. Padovani, D. Pellegrini, and E. Reynders. 2018. “The Influence of Environmental Parameters on the Dynamic Behaviour of the San Frediano Bell Tower in Lucca.” Engineering Structures 156: 175–187. doi:10.1016/j.engstruct.2017.10.045.
- BS 7385-1. 1990. “Evaluation and Measurement for Vibration in Buildings – Part 1: Guide for Measurement of Vibrations and Evaluation of Their Effects on Buildings.”
- Civera, M., V. Mugnaini, and L. Z. Fragonara. 2022. “Machine learning-based Automatic Operational Modal Analysis: A Structural Health Monitoring Application to Masonry Arch Bridges.” Structural Control & Health Monitoring e3028. doi:10.1002/stc.3028.
- Clough, R. W., and J. Penzien. 1993. Dynamics of Structures. 2nd ed. Singapore: McGraw-Hill.
- Compan, V., P. Pachón, and M. Cámara. 2017. “Ambient Vibration Testing and Dynamic Identification of a Historical Building. Basilica of the Fourteen Holy Helpers (Germany.” Procedia Engineering 199: 3392–3397. doi:10.1016/j.proeng.2017.09.572.
- Danish, A., F. Tayyab, and M. U. Salim. 2020. “Health Assessment Based on Dynamic Characteristics of Reinforced Concrete Beam Using Realtime Wireless Structural Health Monitoring Sensor.” Journal of Structural Integrity and Maintenance 5 (3): 204–210. doi:10.1080/24705314.2020.1765271.
- Ferraioli, M., L. Miccoli, D. Abruzzese, and A. Mandara. 2017. “Dynamic Characterisation and Seismic Assessment of Medieval Masonry Towers.” Natural Hazards 86 (S2): S489–S515. doi:10.1007/s11069-016-2519-2.
- Gentile, C., A. Ruccolo, and A. Saisi. 2019. “Continuous Dynamic Monitoring to Enhance the Knowledge of a Historic bell-tower.” International Journal of Architectural Heritage 13 (7): 992–1004. doi:10.1080/15583058.2019.1605552.
- Hansapinyo, C. 2014. “Seismic Performances of Brick Masonry Inverted Bell-Shaped Chedi.” The APCBEE Procedia 9: 217–221. doi:10.1016/j.apcbee.2014.01.039.
- Hansapinyo, C., P. Latcharote, and S. Limkatanyu. 2020. “Seismic Building Damage Prediction from GIS-based Building Data Using Artificial Intelligence System.” Frontiers in Built Environment 6: 1–11. doi:10.3389/fbuil.2020.576919.
- Hansapinyo, C., and N. Poovarodom. 2014. “Ambient Vibration Tests and Finite Element Analysis for Dynamic Properties of Brick Masonry Inverted Bell-Shaped Chedi.” The APCBEE Procedia 9: 212–216. doi:10.1016/j.apcbee.2014.01.038.
- ISO 4866. 2010. “Mechanical Vibration and Shock – Vibration of Buildings – Guidelines for the Measurement of Vibrations and Evaluation of Their Effects on Buildings.”
- Ketsap, A., C. Hansapinyo, N. Kronprasert, and S. Limkatanyu. 2019. “Uncertainty and Fuzzy Decisions in Earthquake Risk Evaluation of Buildings.” Engineering Journal 23 (5): 89–105. doi:10.4186/ej.2019.23.5.89.
- Klusáček, L., R. Nečas, and J. Bureš. 2015. “Diagnostics of a Historical Bridge Using Measuring Methods and Inverse Analysis.” Applied Mechanics and Materials 764-765: 1064–1069.
- Mishra, M., P. B. Lourenço, and G. V. Ramana. 2022. “Structural Health Monitoring of Civil Engineering Structures by Using the Internet of Things: A Review.” Journal of Building Engineering 48. doi:10.1016/j.jobe.2021.103954.
- Miyamoto, M., and T. Hanazato. 2015. “Vibration Characteristics of Historical Masonry Buildings Based on Seismic Observation.” Proceeding of the 2nd International Conference on Preservation Maintenance and Rehabilitation of Historic Buildings and Structures, Porto, Portugal.
- Monti, G., F. Fumagalli, G. Quaranta, M. Sgroi, and M. Tommasi. 2018. “A Permanent Wireless Dynamic Monitoring System for the Colosseum in Rome.” Journal of Structural Integrity and Maintenance 3 (2): 75–85. doi:10.1080/24705314.2018.1463020.
- Saicheur, K., and C. Hansapinyo. 2016. “Structural Repair Prioritization of Buildings Damaged after Earthquake Using Fuzzy Logic Model.” Journal of Disaster Research 11 (3): 559–565. doi:10.20965/jdr.2016.p0559.
- Saicheur, K., and C. Hansapinyo. 2017. “Seismic Loss Estimation and Reduction after Structural Rehabilitation in Chiang Rai City.” Walailak Journal of Science and Technology 14: 485–499.
- Salameh, C., P. Bard, B. Guillier, J. Harb, J. Cornou, J. Geŕard, and M. Almakari. 2017. “Using Ambient Vibration Measurements for Risk Assessment at an Urban Scale: From Numerical Proof of Concept to Beirut Case Study (Lebanon).” EPS 69: 1–17.
- Tantisukhuman, N., Hansapinyo, C., Buachart, C., Miyamoto, M., Matsushima, M. (2023). Earthquake-Induced Vibration Measurement and Inverse Analysis of Bell-Shaped Pagoda. In: Casini, M. (eds) Proceedings of the 2nd International Civil Engineering and Architecture Conference. CEAC 2022. Lecture Notes in Civil Engineering, vol 279. Springer doi:10.1007/978-981-19-4293-8_36, Singapore.
- Yanathanom, K. 2010. “Static and Dynamic Behavior under Seismic Loading of Pagodas in Chiang Mai City by Finite Element Method.” Master Thesis, Chiang Mai University.