
 ?Mathematical formulae have been encoded as MathML and are displayed in this HTML version using MathJax in order to improve their display. Uncheck the box to turn MathJax off. This feature requires Javascript. Click on a formula to zoom.
ABSTRACT
As a new green material, steel-paper straw board (PSB) composite structures are widely used in practical engineering. This study proposed a new cold-formed thin-walled C-shaped steel-paper straw board (CFCSPSB) composite floor. To study its mechanical properties, flexural experiments were conducted on three composite floors. The experimental results showed that the combined effect of PSB and cold-formed thin-walled C-shaped steel (CFCS) beam was good, and the local buckling caused by the restraint effect of PSB on the CFCS beam was an important factor for the failure of the composite floor. On this basis, the composite floor was investigated by finite element analysis (FEA) software ANSYS, and the FEA results were consistent with the experimental results. Then, the effect of different factors on the flexural capacity of the composite floor was analysed by ANSYS. The obtained results showed that reducing the screw spacing and floor span, or increasing the CFCS beam cross-sectional size, web height of CFCS beam, and CFCS thickness could improve the flexural capacity of composite floors, and the calculation formula of flexural capacity for the composite floor was proposed.
GRAPHICAL ABSTRACT
1. Introduction
China is a largely agricultural country with abundant straw resources, and the annual straw resources that can be collected are 185 million tons. However, most straw resources are burned in situ, resulting in a waste of resources and carbon emissions, and it is necessary to find a reasonable way to use the rich straw resources. Therefore, paper straw board (PSB) has emerged as a new type of environmentally protected building material. PSB uses clean natural straw as the main raw material. The straw is heated and extruded in the moulding machine to form a dense slab, and then a layer of protective paper is pasted on the exterior. The PSB is mainly used for internal partition walls and roof boarding of new village buildings and has the characteristics of high strength, good fire resistance, and excellent thermal insulation (Zhang Citation2005; Wang, Luo, Zhang and Mu. Citation2016). Shi (Shi, Zhang, and Li et al. Citation2018) investigated the effect of the straw-based board on the internal thermal and humid environment. The experiment results showed that straw-based boards could suppress the increase in humidity level and significantly improve the humidity environment of the dwelling, specifically in summer. In addition, the hygrothermal behaviour of the straw-based board was analysed by a coupling method that combined a well-developed hygrothermal model and dynamic heat transfer. In addition, PSB technology is constantly improving. Kurokochi (Kurokochi and Sato Citation2015) investigated the effect of surface structures, silica, and wax on the properties of binderless boards made from rice straw. EI-Kassas (EI-Kassas and Mourad Citation2013) introduced a novel fiber preparation technique for the manufacturing of dry-formed rice straw-based medium density fiberboard (RSMDF). Theng (Theng, Arbat, and Delgado-Aguilar et al. Citation2019) investigated the influence of fiber morphology and moulding parameters on the mechanical and physical properties of fiberboards made from rice straw. With the advantages of high strength, good fire resistance, lightweight and earthquake resistance, cold-formed thin-walled steel (CFS) is commonly used as load-bearing components in low-rise buildings and has been widely used in the United States and Japan since the beginning of the 21st century. Degtyareva (Naser and Degtyareva Citation2019) explored the effect of temperature-induced shear-based instability on the response of C-shaped CFS beams with slotted webs. The effects of channel depth, web perforation pattern, and boundary conditions on the temperature-induced buckling sensitivity of CFS beams were analysed using the FE software ANSYS.
Currently, under the promotion of the new countryside and urbanization, lightweight composite members are lighter, more economical, and more environmentally friendly than traditional reinforced concrete members. To expand the application of PSB, it is necessary to investigate lightweight composite structures with PSB as the cladding panel, such as composite floors and walls. As a horizontal load-bearing component in architecture, the floor slab plays an important role. Many scholars have studied and applied many types of lightweight composite floors and obtained excellent results, using steel-bamboo, steel-wood, steel-PSB, and steel-OSB boards.
Wang (Wang, Qiao, Wang and Xu l. Citation2021) proposed a new sandwich slab (CTSPSS) combined with cold-formed thin-walled steel and polyurethane, and investigated the effects of slab thickness, length-width ratio, steel plate type and thickness on the flexural capacity of CTSPSS. The results showed that, within a certain range, increasing the thickness of the floor slab and the thickness of the steel plate or decreasing the length-width ratio of CTSPSS could improve the flexural capacity of CTSPSS. After that, Wang (Wang, Feng, Qiao, Su and Wang. Citation2022) designed a profiled steel sheet-polyurethane sandwich slab and conducted flexural experiments. ABAQUS was used to analyse the effects of parameters such as slab thickness, sheet thickness, and polyurethane density on the flexural capacity of the sandwich slab. Li (Li, Shen, and Shan et al. Citation2012) investigated the flexural behaviour of lightweight bamboo-cold-formed thin-walled C-shaped steel (CFCS) composite slabs. It was found that the specimens using the self-tapping screw enhanced connection and showed clear increase in stiffness, capacity and stability. Ahmed (Ahmed and Badaruzzaman Citation2013) investigated the vibration performance of a profiled steel dry board composite floor panel. The effects of various board types, board thicknesses, and connector spacing on the fundamental frequency were evaluated. Li (Li Citation2009) studied the effect of screw spacing on the stiffness and vibration performance of the floor and gave an equivalent stiffness calculation formula for CFCS composite floors. Zhou (Zhou, Li, and Wang et al. Citation2013; Zhou, Shi, and Xu et al. Citation2019) performed a flexural experiment of CFCS joists-OSB composite floors and verified its accuracy by ANSYS. The effect of different factors on the bearing capacity was analysed. Zhao (Zhao, Zheng, and Wang et al. Citation2015) and Zheng (Xia, Zheng, and Wei Citation2020) studied the bending and vibration resistance of CFCS-Italian poplar plywood composite slabs, and obtained results showed that the bearing capacity can be significantly improved by increasing the thickness of the profile steel plate and plywood plate. Zhang (Zhang, Zhang, and Xu et al. Citation2019; Zhang, Zhang, and Zhang Citation2021; Zhang, Zhang, and Li Citation2021; Zhang, Zhao, and Li Citation2020; Zhang, Zhang, and Yu et al. Citation2021) designed a new CFCS-PSB composite wall and investigated its compressive mechanical properties and damage modes. The effects of parameters such as screw spacing and C-shaped steel thickness on the mechanical properties of the composite wall were analysed. After that, the double side cladding composite wall and the new steel frame composite wall were designed respectively, and their mechanical properties were studied. The results of the study proved the feasibility of lightweight composite walls in the future construction industry. In addition, Zhang designed a new CFCS-PSB composite floor, and the flexural experiment was performed. Tang (Tang, Cao, and Song Citation2021) studied the compressive bearing capacity of the composite wall made of rice straw bale and cold-formed steel. The experiment results showed that when the composite wall reached the ultimate bearing capacity, wall body internal steel columns yielded, and the out-of-plane displacement of the near-steel side wall was greater than that of the far-steel side walls. Straw bale as a wall inside filler can obviously improve the bearing capacity of steel columns. Sohel (Sohel, Liew, and Fares Citation2021) investigated the structural performance of composite slabs with profiled steel sheets and ultralightweight cement composite (ULCC). Wang (Wang, Chen, and Zhang et al. Citation2021) proposed a new steel-polyurethane foam-steel-concrete-steel (SPUFSCS) panel, and its impact-resistant performance was experimentally, numerically and analytically studied. Satheeskumar (Satheeskumar, Deighton, and Perampalam et al. Citation2021) used ABAQUS to investigate the structural performance of the CLT-CFS composite beam. Pinelopi (Pinelopi, Thomas, and Christopher et al. Citation2021) and Karki (Karki, Far, and Saleh Citation2021) et al. investigated the mechanical property of the steel-timber composite floor and analysed the effect of different factors on the structural behaviour. Davids (Davids, Rancourt, and Dagher Citation2011) conducted a flexural experiment on composite I-joist/oriented strand boards (OSB), and the obtained results showed that the flexural capacity and stiffness of the OSB were nearly twice as large as those of the pure steel frame slab. Loss (Loss and Buick Citation2017; Loss and Frangi Citation2017) designed a new type of steel-timber precast composite floor connected by bolts and screws, and many monotonic and cyclic shear experiments were conducted to evaluate the stiffness and bearing capacity. According to the basic concept of the current design method, Kyvelou (Kyvelou, Gardner, and Nethercot Citation2017) provided a suggestion for the design of CFS beam-wood composite floors. However, there are few types of research on CFCS-PSB composite floors, and their mechanical properties need further investigation.
Three specimens were designed to investigate the flexural capacity of CFCSPSB composite floors, and a flexural experiment was performed. ANSYS was adopted to analyse composite floor FE models, and the feasibility of the FEA method was verified. Then, ANSYS was used for parametric analysis of the composite floor. Finally, the suggested formula was provided for calculating the flexural capacity of composite floors, which is conducive to the promotion and application of composite floors in engineering.
2. Experimental program
2.1. Specimen details
Based on Chinese Standard JGJ 227–2011 (JGJ 227-Citation2011 Citation2011), three composite floor specimens were designed. The specimen size was 2400 mm×1200 mm (length×widthe), whereas the clear span was 2200 mm. The size of the PSB was 2400 mm×1200 mm×58 mm (length×widthe×thickness). The composite floor frames consisted of CFCS (beam) and U-shaped steel (edge banding beam) connected by self-tapping screws. The specimens consisted of a CFCS frame and PSB connected by ST4.8 self-tapping screws of 75 mm length, and the spacing of the self-tapping screws was 150/300 mm in the periphery and 300/600 mm in the middle. The shear connectors were arranged at the corners of the CFCS frame. The construction details of the specimens are shown in and .
Figure 1. Construction details of composite floors.
Table 1. Construction parameters of specimens.
2.2. Material properties
The PSB and CFCS used in the experiment were the same as those used in reference (Zhang, Zhao, and Li Citation2020), and the mechanical properties of the two materials are shown in and .
Table 2. Mechanical properties of CFCS.
Table 3. Mechanical properties of PSB.
2.3. Experimental loading setup and loading system
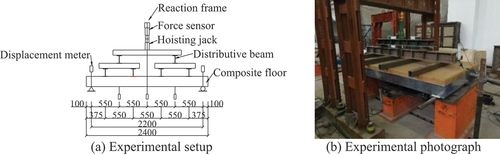
The experiment used the four-point load method. The composite floor is a one-way slab, which is supported on both sides along the length direction. One end was a pin support, the other end was roller support and the clear span was 2200 mm of the floor. The rigid buttress was fixed to the ground, the steel plate was placed on the buttress, the solid steel bar with a diameter of 30 mm and length of 1.5 m was welded to the steel plate as the pin support, and the other side was not welded, as a roller support. The composite floor was placed on the support to adjust the position in the length direction, and the vertical load was applied by a 16 t manual jack. The experimental loading setup is shown in .
Figure 2. Experimental loading set-up diagram.
The experimental loading system used a graded loading method, the vertical force was used to control the loading, and the load applied at each step was controlled within 10% of the predicted maximum load of the specimens. The experiments were divided into two stages. In the first stage, the load used was 5–10% of the ultimate load and unloaded after completion. In the second stage, after applying 4 kN per grade, the load was held for 1 min, and then the data were collected. When the steel beam buckled, the related data and experimental phenomena of the specimens were recorded until the maximum load was reached. Loading was stopped after the load dropped to 85% of the maximum load.
2.4. Arrangement of measurement points
To measure the displacement and strain of the composite floor, arranged eight displacement measurement points (D1-D8) and twenty strain measurement points(S1-S20) on composite floors. D1 and D5 were placed at the support seat, D2 and D4 were placed at the 1/4 span of the floor, D3 was placed at the mid-span of the floor, D6 and D7 were placed in the mid-span of the two side CFCS beams, and D8 measured displacement of D-axis steel beam in CB3. Five strain gauges were placed at the mid-span position of each CFCS beam, and strain gauges were placed on the upper and lower surfaces of PSB at the mid-span position. In addition, the strain of the D-axis CFCS beam in specimen CB3 was measured by S16-S20. Two types of resistance displacement meters, YHD100 and YHD50, were used to measure the displacement and strain gauges were used to measure the strain. Then, a static strain chamber JM3816 was used to measure the data of strain and deflection of the specimen throughout the loading process. Taking specimen CB1 as example, the measurement points in mid-span section are shown in .
Figure 3. Arrangement of measurement points.
2.5. Experimental phenomena
Because the experimental phenomena of the three composite floors were quite similar, the representative specimen CB1 was chosen to describe the experimental phenomena.
Composite floor specimen CB1: No clear phenomenon in the early stage of loading. With increasing load, the PSB began to exhibit a fine fold and tended to expand outwards. When the load reached approximately 47 kN, the specimen appeared sound, and the experiment continued; the screws located near the mid-span of the specimen receded into the PSB (), CFCS beam A had the largest torsional deformation and clear local buckling (), CFCS beam B had slight torsion and local buckling (), and CFCS beam C was slightly torsional (). When the load reached 57.6 kN, the pressure sensor reading suddenly dropped, CFCS beam A experienced lateral torsion and serious buckling damage, and the specimen reached the maximum flexural capacity. At this time, the mid-span displacement reached 20 mm, the PSB showed a serious folding phenomenon, and the specimen as a whole was clearly bent.
Figure 4. Damage modes of specimen CB1.
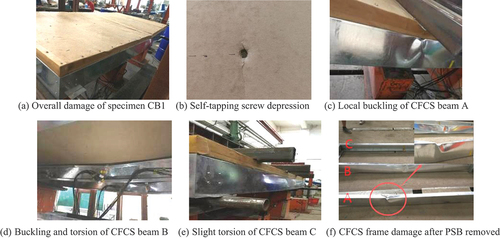
The obtained results showed that the three groups of CFCS beams were all damaged by excessive buckling deformation near the mid-span, and although the degree of torsional deformation was slightly different, the final damage was caused by local buckling of the CFCS beam; thus, the final damage was a type of stability problem caused mainly by local buckling.
2.6. Analysis of experimental results
2.6.1. Load-strain curves of the specimens
The upper flange and rolled edge of the CFCS beam exhibited buckling at the mid-span. Therefore, the strains of measurement points S2, S7, and S12 (S17) on the web and their symmetrical measurement points S4, S9, and S14 (S19) were compared, as shown in .
Figure 5. Load-strain curves of CFCS beams in the mid-span section.
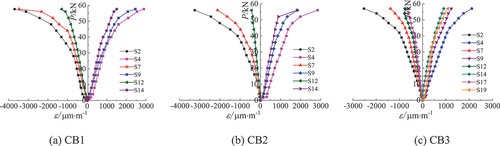
In general, the trend of the load-strain curves of each CFCS beam in the three composite floors was consistent, which showed that the CFCS beams worked together and that the combined effect was good.
The strain values of the symmetric measurement points S2 and S4 of the CFCS beam in specimen CB3 were selected for comparison with the strain values at the top and bottom surfaces of PSB, and the load-strain relationship curves were drawn as shown in .
Figure 6. Load-strain relationship curves of the CFCS beam and PSB of Specimen CB3.
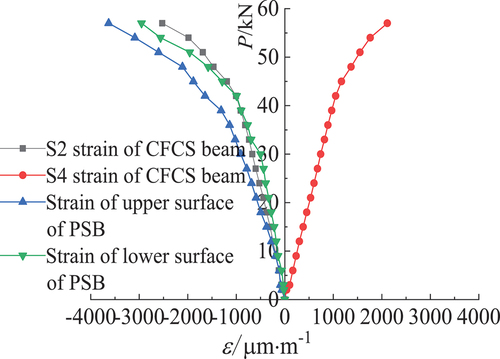
The strain values at the bottom surface of the PSB were consistent with those on the compression side of the CFCS beam, which indicated that the combination effect between PSB and CFCS frame was good. When the composite floor reached the maximum load, the strains at the top and bottom flanges of the CFCS beam exceeded 2000με, which indicated that the CFCS exceeded its yield strength. The strain values at the top and bottom surfaces of PSB were negative, which indicated that the full cross-section of PSB was always compressed during the process of loading. The experimental results showed that the mechanical properties of PSB and CFCS were clearly demonstrated, and the combination scheme of PSB and CFCS frame connected by self-tapping screws to form a composite floor was feasible.
To analyse whether the strain distribution of the composite floor accorded with the assumption of plane section, a representative CFCS beam was selected in each specimen, and shows the strain distribution along the web height of the CFCS beam at the mid-span section under various levels of loading.
Figure 7. Strain distribution along the height on the web of the CFCS beam in the mid-span of the specimens.
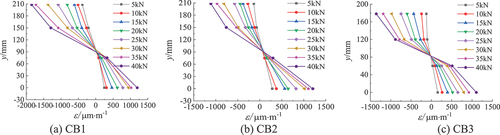
The horizontal coordinate ε is the longitudinal strain of the cross-section, the vertical coordinate y is the height of the cross-section, y = 0 mm is the bottom flange of the CFCS beam, y = 150 mm is the top flange of the CFCS beam. As shown in , with increasing load, the strain along the height direction in the midspan section of the CFCS beam exhibited inflexion points. This occurred because the screws between the CFCS beam and the PSB slipped with increasing load. However, the strain variation trends of the composite floors were approximately linearly distributed along the height of the mid-span section and basically remained unchanged after deformation; thus, the overall strain distribution of the mid-span section basically conformed to the assumption of the plane section.
2.6.2. Load-displacement curves of specimens
The load-displacement curves of composite floor specimens CB1, CB2 and CB3 are shown in .
Figure 8. Load-displacement curves.
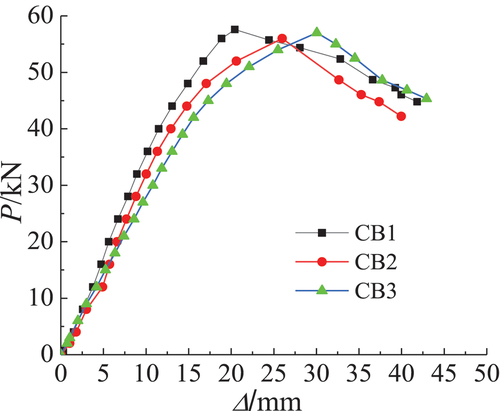
At the beginning of loading, the specimens entered the elastic working stage, and the displacement of the three specimens under the action of uniform load was nearly consistent, showing a linear change. With increasing load, the specimens entered the elastic-plastic stage, the CFCS beam compression flange began to buckle, and then the screws began to have an effect. The PSB restricted the CFCS frame from entering the plasticity, and the length of the lateral support of the composite floor increased with increasing screw spacing so that local buckling easily occurred. Therefore, specimen CB2 with a larger screw spacing had a faster mid-span displacement increase, lower flexural stiffness and maximum bearing capacity. With continued loading, the specimen buckling deformations gradually increased, and the specimens were damaged when the maximum bearing capacity was reached. With continued loading, the load-displacement curve clearly decreased, and the bearing capacity continued to decline. The cross-sectional dimensions of specimens CB3 and CB1-2 were different. Therefore, by comparing the load-displacement curves of specimens CB1 and CB3, it can be determined that the two load-displacement curves began to depart soon after the early stage of loading. The flexural stiffness of specimen CB3 was smaller than that of specimen CB1, and the maximum bearing capacity of the two specimens was similar. However, the bearing capacity of specimen CB3 rapidly decreased when the ultimate load was reached, which showed that the section size of the CFCS beam had some effect on the stiffness of the specimen.
2.6.3. Results analysis
According to Chinese Standard JGJ101-2015 (JGJ101-Citation2015 Citation2015), the maximum load Pmax and the maximum displacement Δmax were the load and the displacement corresponding to the peak point of the load-displacement curve. The ultimate load Pu and ultimate displacement Δu were equal to the point corresponding to 85% maximum load Pmax in the descending branch of load-displacement curve. Because there was no clear yield point in P-Δ curve of composite floors, the yield load and corresponding yield displacement of composite floors was obtained by graphic method. The specific principle of the graphic method was shown in . The coordinates of point E (Py, Δy) were the yield load Py and the yield displacement Δy of the composite floor.
Figure 9. Graphic method.
The experiment used the four-point load method to simulate the uniform load, which was different from the method of applying uniform load on the simply supported slab. Therefore, the method proposed by ref (Zhang, Zhao, and Li Citation2020) was used to calculate the uniform surface load of the composite floor. According to the method in Chinese Standard JGJ101-2015 (JGJ101-Citation2015 Citation2015), the ductility factors of composite floors were calculated.
The main experimental results of the three composite floors are listed in .
Table 4. Experimental results.
It can be concluded from that the yield load of specimen CB1 with a smaller screw spacing increased by 7.7% compared with that of specimen CB2 with a larger screw spacing, which showed that the size of the screw spacing had a greater effect on the yield load of specimens. In addition, by analysing the ductility factors of composite floors, it was found that the ductility factors were between 2.2 and 2.6, which belonged to the range of good deformation ability; this result showed that the composite floor had good deformation ability. The ductility factor of specimen CB1 was 10.6% larger than that of specimen CB2, which showed that the screw spacing had some effect on the ductility of the composite floor.
3. FEA of the composite floor
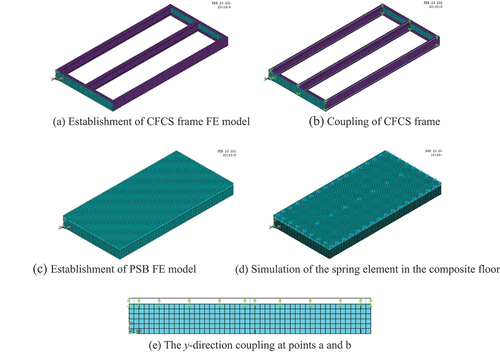
3.1. Establishment of the FE model
To further verify the reliability of the FEA, the experimental model was analysed by ANSYS. Since the thickness of CFCS and PSB are much smaller than the length and width of any size, Shell 181 element is used to simulate these two materials. According to the data obtained from the material experiment, as shown in , the parameters of the CFCS and PSB in ANSYS are shown in . The geometric imperfections and residual stress were not considered in the FEA of CFCS and PSB, and the hardening problem was not considered in the FEA of PSB. Therefore, the constitutive model of CFCS was a bilinear isotropic hardening elastoplastic model, and the constitutive model of PSB was an ideal elastoplastic model. The constitutive model curves of the two materials are shown in .
Figure 10. Constitutive diagram.
Table 5. Material parameter.
Here, E is the elastic modulus; ν is the poisson ratio; fy is the yield strength; Et is the tangent modulus.
As for the connection between the different components of the composite floor, the following two simulation methods were adopted:
(a) The coupling was used to simulate the connection between the CFCS beam and the U-shaped edge banding beam.
(b) Combin39 spring element was used to simulate the effect of the self-tapping screws between CFCS frame and PSB.
The simulation of the self-tapping screw between the CFCS frame and PSB was very important for FEA, and finally, the Combin39 spring element was used to simulate the effect of the self-tapping screw. The Combin39 spring element was arranged between the CFCS element and the PSB element, and the joints of the two materials with the same coordinates and different numbers were connected to simulate the interaction between the CFCS frame and PSB. The combin39 spring element is shown in .
Figure 11. Combin39 element.
During the loading process of the experiment, the force and deformation state of screws between the CFCS frame and PSB affected the displacement of the spring element. During the installation of the experimental pieces, there were unavoidable errors in the drilling of each screw, such as the inclination of the screw into the composite floor, and the gap between the CFCS frame and PSB may lead to the deviation of the displacement of the spring element; thus, the calculation of the spring stiffness was more discrete. The spring element in the FEA that was needed to define the action of each direction, the interaction of the transverse direction and the longitudinal direction was the same, mainly the normal restraint, and the relevant stiffness was preset. Finally, the most approximate spring stiffness was determined after comparing the experimental data and verifying by the FEA method; then, the interaction between the CFCS frame and PSB was simulated.
After connecting the PSB and CFCS beam with screws, the PSB could restrict the rotation of the top flange of the CFCS beam around the web plate and the intersecting line of the flange. It could be considered that all the points on the top flange of the CFCS beam had the same displacement in the y direction, i.e., Uay = Uby. In the FEA, the degrees of freedom of each node in the y direction between the top flanges of the CFCS beam were coupled, which was in accordance with the actual connection, and all nodes of the top flange satisfied the same y direction displacement. The connection of PSB to CFCS beam is shown in .
When meshing, the connection position of the self-tapping screws must be considered. Because the composite floor geometry model belongs to the regular type, the mapping method with higher dividing accuracy was adopted to divide the mesh. Taking specimen CB1 as an example, an FE model was established, and the dimensions were the same as those of specimen CB1. The concrete modelling process of the composite floor is shown in .
Figure 12. Establishment of the FE model of composite floor.
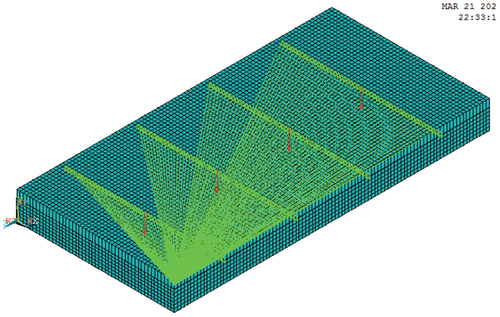
The boundary conditions of the model were simply supported at both ends along the length direction. Constraints were applied to the bottom nodes of edge banding beams at both ends of the composite floor, with one end constraining the translational degrees of freedom in the X, Y and Z directions and the other end constraining the translational degrees of freedom in the X and Y directions. When applying the load, the part of contact between the four distribution beams and the PSB was simplified into four contact lines, and the degree of freedom in the y direction of each point on the contact line was coupled. Then, 1/4 of the equivalent load was applied at the midpoint of the four contact lines. The load application of the composite floor was shown in . The FEA type is static analysis, and the nonlinear convergence criterion (CNVTOL) is used to control the convergence of the force and displacement.
Figure 13. FE model loading diagram.
3.2. Verification of the FE model
Taking composite floor specimens CB1 and CB3 as examples, the deformation cloud of the FE model was compared with the failure mode of the composite floor in the experiment. The comparison results are shown in .
Figure 14. Comparison of the FEA and the experiment for specimen CB1.
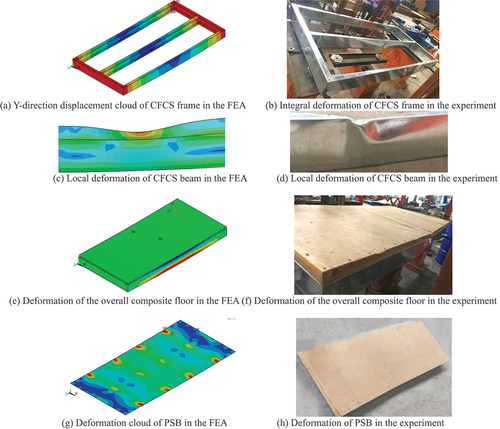
Figure 15. Comparison of the FEA and the experiment for specimen CB3.
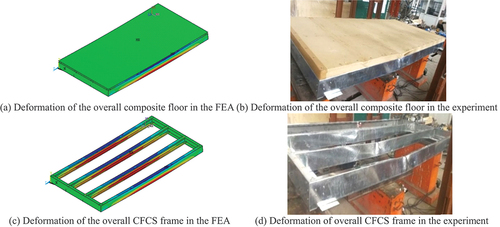
The comparison of the experimental results and FEA results is shown in . The load-displacement curves of each composite floor were compared as shown in . It could be concluded from and that the FEA results of the composite floors were consistent with the experimental results. The error between the FEA results and the experimental results was within 10%, and the slope and direction of the load-displacement curve of each composite floor were in good agreement during the early stage of loading. The obtained results showed that the FEA method could correctly simulate the mechanical properties of the composite floors. In addition, the obtained results verified the feasibility of the FEA method and provided a reliable basis for the subsequent study of the flexural properties of the composite floor.
Figure 16. Comparison of load-displacement curves between experiment and FEA.
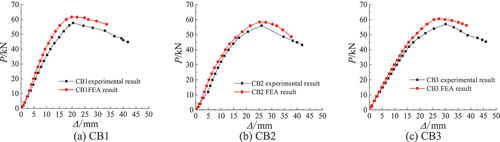
Table 6. Comparison of the experimental results and FEA results.
3.3. FE parametric analysis
The results presented in the previous section verified the feasibility of the FEA method; then, the FEA method was used for the parametric analysis of the composite floor.
3.3.1. Effect of screw spacing
The spacing of peripheral and intermediate screws was changed to analyse the effect of different screw spacing on the flexural capacity of the composite floor. The FEA results are shown in , and the load-displacement curves are shown in .
Figure 17. Load-displacement curves of composite floors with different screw spacing.
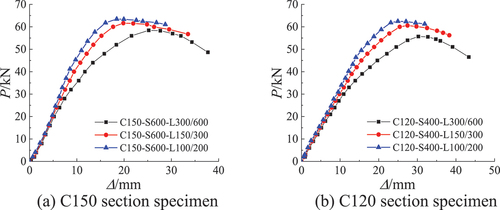
Table 7. Effect of screw spacing on the flexural capacity of the composite floor.
With the reduction in screw spacing, the maximum load had different degrees of improvement, and the displacement was decreased to some extent. Taking the C150 section specimen as an example, when the spacing of screws changed from 300/600 mm to 150/300 mm, the maximum load increased by 5.44% and the displacement reduced by 21.33%; when the spacing of screws changed from 150/300 mm to 100/200 mm, the maximum load increased by 2.98% and the displacement reduced by 7.05%. In addition, when the spacing of screws changed from 300/600 mm to 150/300 mm, the flexural capacity and deformation capacity of the two groups of specimens were more clearly improved. When the screw spacing changed from 150/300 mm to 100/200 mm, the maximum load and displacement of the two groups of specimens were not much different. It showed that when the screw spacing was small, the specimen had a higher flexural capacity and better deformation capacity, while the flexural capacity of overdense screw spacing was not significantly improved.
3.3.2. Effect of web height of CFCS beam
The CFCS beam spacing was 600 mm and the screw spacing was 150/300 mm. By changing the web height of the CFCS beam, the effect of different web heights on the flexural capacity of the composite floor was analysed. The FEA results are shown in and the load-displacement curves are shown in .
Figure 18. Load-displacement curves of composite floors with different web heights.
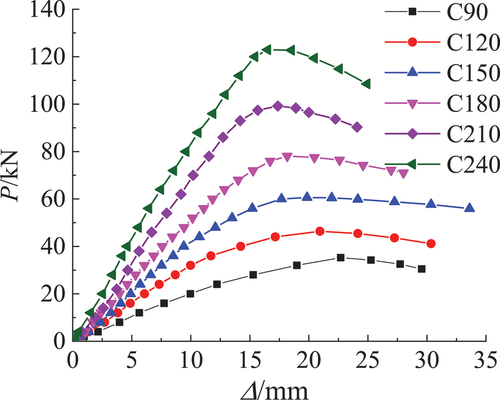
Table 8. Effect of web height on the flexural capacity of composite floors.
When keeping the other parameters unchanged, the web height of the CFCS beam increased from 90 mm to 240 mm, the flexural capacity gradually increased with each 30 mm increase, the maximum load of each specimen increased by 31.69%, 30.61%, 28.83%, 27.28% and 24.68%, respectively, and the displacement in the mid-span slightly decreased. The obtained results showed that increasing the web height could significantly improve the flexural capacity of composite floors. shows that the web height also had a greater effect on the flexural stiffness of the composite floor, and the stiffness clearly increased with increasing web height.
3.3.3. Effect of different floor spans
According to the actual size of PSB and common span of floor, the span sizes of composite floors were designed as 2400 mm, 2700 mm, 3000 mm and 3300 mm, respectively. The FEA results are shown in . The load-displacement curves are shown in .
Figure 19. Load-displacement curves of composite floors with different spans.
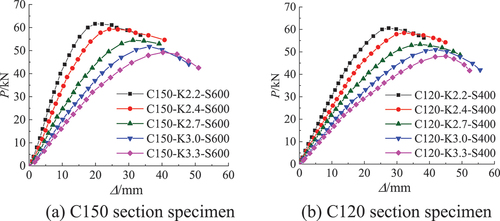
Table 9. Effect of floor span on the flexural capacity of composite floors.
and show that the maximum load of the composite floor decreased with the increase in span, and the value of the maximum displacement increased with the increase in span. The larger the span increased, the smaller the maximum load decreased, and the stiffness of the composite floor also decreased. Taking the C150 section specimen as an example, when the span increased from 2200 mm to 2400 mm, the maximum load of the composite floor was reduced by 3.75%, and when the span increased from 2400 mm to 3300 mm, the maximum load was reduced by 8.08%, 5.09% and 4.89% for every 300 mm increase. The obtained results showed that the increase in span made the stiffness and flexural capacity gradually decrease, and when the span exceeded 2700 mm, the effect on the flexural capacity became very slight. This occurred because with the increase in span, the restraint ability of PSB to the CFCS frame became increasingly stronger, which effectively limited the lateral torsion and bending deformation, the effect of the diaphragm effect was more clear, and the contribution to the overall stiffness of the composite floor showed a better trend.
3.3.4. Effect of CFCS thickness
Four CFCS thicknesses were selected (i.e., 1.0, 1.5, 2.0 and 2.5 mm), and the effect of CFCS thickness on the flexural capacity of composite floors was analysed. The FEA results are shown in , and the load-displacement curves are shown in .
Figure 20. Load-displacement curves of composite floors with different CFCS thicknesses.
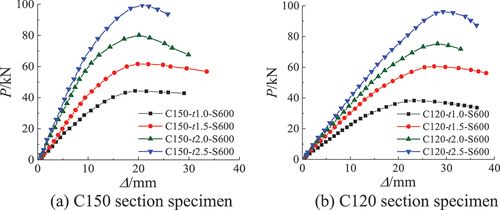
Table 10. Effect of CFCS thickness on the flexural capacity of composite floors.
It can be concluded from and that the flexural capacity of each composite floor linearly increased at the beginning of loading. With the increase in CFCS thickness, the yield load and maximum load greatly increased, and the maximum displacement slightly increased. For the C150 specimen, when the CFCS thickness increased from 1.0 mm to 2.5 mm, the maximum load increased by 39.06%, 30.04% and 25.42% with each 0.5 mm increase. For the C120 specimen, when the CFCS thickness increased from 1.0 mm to 2.5 mm, the maximum load increased by 58.17%, 24.34% and 27.62% with each 0.5 mm increase. The results analysis showed that the CFCS thickness had a significant effect on the flexural capacity of the composite floor, which was due to the increase in the CFCS thickness leading to the increase in the net section resistance moment and the increase in the yield load. When the CFCS thickness changed from 1.0 mm to 1.5 mm, the maximum load clearly increased, which showed that it was economical and reasonable to select a CFCS of 1.5 mm thickness in the experiment. Therefore, the bearing capacity and stiffness of the composite floor could be improved by increasing the CFCS thickness in engineering design.
4. Theoretical analysis of the flexural performance of the composite floor
4.1. Calculation of flexural capacity of composite floors
Based on the experimental results, the overall performance of the composite floor is good, and the PSB and the CFCS beam can deform in coordination. To infer the formula for calculating the flexural capacity of the CSCFPSB composite floor, the following two assumptions are made when calculating the damage section of the composite floor:
The specimen is regarded as damaged when the bearing capacity drops to 85%, at which time, the top and bottom flanges of the CFCS beam yield.
When the specimen is damaged, the strain of the CFCS beam is taken as the yield strain of the PSB, and PSB is compressed in the full section and kept in the elastic phase all the time.
On this basis, the formula for calculating the flexural capacity of the normal section of the composite floor is obtained, and the calculation diagram is shown in .
Figure 21. Calculation diagram of the composite floor.
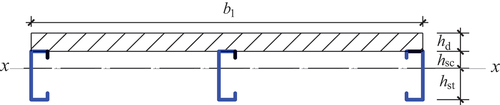
where, b1 is the wide of PSB, n is the number of CFCS beams, φb is the overall stability factor of single CFCS beams, fys is the buckling strength of CFCS beams, Asc is the cross-sectional area of CFCS beams in compression, hsc is the distance from the top flange of CFCS beam to the neutral axis, Ast is the cross-sectional area of CFCS beams in tension, hst is the distance from the bottom flange to the neutral axis, σd is the compressive strength of PSB, Ad is the cross-sectional area of PSB, hd is the thickness of PSB.
According to Chinese Standard GB50018-2002 (GB50018-Citation2002 2003), for uniaxially symmetrical simply-supported flexural members, the integral stability factor φb should be calculated according to the following formula:
where, λy is the slenderness of the beam out of the bending moment plane, A is the cross section area, h is the cross section height, l0 is the side calculated length of the beam, μb is the side calculated length coefficient of the beam, l is the span of the beam, ζ1 and ζ2 are the coefficients, ζ1 = 1,13, ζ2 = 0.46, Wx is the distance from the point of action of the transverse load to the centre of the bend, ea is the modulus of the cross-section of the pressed edge of the X axis, Iω is the gross section warping moment of inertia, also known as the gross section warping torsion coefficient, Iy is the gross section moment of inertia of the section for the y-axis, and It is the torsion moment of inertia.
When φb is greater than 0.7, φb should be replaced by :
.
The composite floor bending moment values of the experiment and FEA are calculated according to the following formula:
where, M is the equivalent bending moment of the specimen, qy is the equivalent uniform yield line load, and l is the calculated span of the composite floor.
To verify the reasonableness of Formula (1), the composite floor with different screw spacing, CFCS beam cross-section and span are selected for the theoretical calculation, and the calculation results are compared with the experimental results and FEA results. The comparison results are shown in . Considering the effect of screw spacing on the flexural capacity of composite floors, the theoretical values of the flexural capacity of the specimens with different screw spacing are reduced according to the average values of the experimental moment and FEA moment reduction factor.
Table 11. Flexural capacity of composite floor.
Mc is the theoretical value calculated by Formula (1) and MEXP(MFEA)is the experimental (or FEA) value calculated by Formula (6). The obtained results showed that the error between the experimental (or FEA) value and the theoretical value is within ±10%, and Formula (1) is reasonable for calculating the flexural capacity of the composite floor.
5. Conclusions
(1) The combined effect between PSB and CFCS beams is excellent, and they can deform synergistically in the process of loading. The ductility factors of the specimens are between 2.2 and 2.6, this result shows that the CFCSPSB composite floor has good ductility and can be used as a building floor.
(2) The combined 39 spring element is used to simulate the effect of the self-tapping screw between the CFCS beam and PSB, and the FEA result is as good as predicted, which shows that the combined 39 spring element is suitable for a similar FEA.
(3) The error between the FEA results and the experimental results is within 10%, which verifies the reliability of the FEA. Therefore, ANSYS is used to analyse the parameters and make the following conclusion: reducing the screw spacing and floor span or increasing the CFCS beam cross-sectional size, web height of CFCS beam, and CFCS thickness can improve the flexural capacity of the composite floor. To meet the flexural behaviour and economy of this type of composite floor in engineering applications, it is suggested that the screw spacing should not be less than 100/200, the best screw spacing should be 150/300 mm, and the CFCS thickness should be 1.5–2.0 mm.
(4) The experimental value and theoretical value of the flexural capacity of composite floors are in good agreement. The flexural capacity calculation formula of CFCSPAB composite floors is feasible.
Acknowledgments
This research is financially supported by National Natural Science Foundation of China (51878130).
Disclosure statement
No potential conflict of interest was reported by the author(s).
Additional information
Funding
Notes on contributors
Xiuhua Zhang
Xiuhua Zhang, 1970-, Ph.D., Associate Professor, Ph.D. Supervisor, School of Civil Engineering, Northeast Forestry University, has been engaged in the research of steel structure, steel-bamboo (straw board, wood) composite structure since 1995. Li Hang, 1997-, M.S. student at Northeast Forestry University. Zilin Zhao, 1993-, M.S., Northeast Forestry University.
Hang Li
Xiuhua Zhang, 1970-, Ph.D., Associate Professor, Ph.D. Supervisor, School of Civil Engineering, Northeast Forestry University, has been engaged in the research of steel structure, steel-bamboo (straw board, wood) composite structure since 1995. Li Hang, 1997-, M.S. student at Northeast Forestry University. Zilin Zhao, 1993-, M.S., Northeast Forestry University.
Zilin Zhao
Xiuhua Zhang, 1970-, Ph.D., Associate Professor, Ph.D. Supervisor, School of Civil Engineering, Northeast Forestry University, has been engaged in the research of steel structure, steel-bamboo (straw board, wood) composite structure since 1995. Li Hang, 1997-, M.S. student at Northeast Forestry University. Zilin Zhao, 1993-, M.S., Northeast Forestry University.
References
- Ahmed, E., and W. H. W. Badaruzzaman. 2013. “Vibration Performance of Profiled Steel Sheet Dry Board Composite Floor Panel.” KSCE Journal of Civil Engineering 17 (1): 133–138. doi:10.1007/s12205-013-1114-2.
- Davids, W. G., D. G. Rancourt, and H. J. Dagher. 2011. “Bending Performance of Composite Wood I-joist/oriented Strand Board Panel Assemblies.” Forest Products Journal 61 (3): 246–256. doi:10.13073/0015-7473-61.3.246.
- EI-Kassas, A. M., and A.-H. I. Mourad. 2013. “Novel Fibers Preparation Technique for Manufacturing of Rice Straw Fiberboards and Their Characterization.” Materials & Design 50: 757–7665. doi:10.1016/j.matdes.2013.03.057.
- GB50018-2002. 2003. Technical Code of cold-formed thin-wall Steel Structures. Standards Press of China: Beijing. in Chinese
- JGJ101-2015. 2015. Specification for Seismic Test of Buildings. Standards Press of China: Beijing. in Chinese
- JGJ 227-2011. 2011. Technical Specification for low-rise cold-formed thin-walled Steel Buildings. Standards Press of China: Beijing. in Chinese
- Karki, D., H. Far, and A. Saleh. 2021. “Numerical Studies into Factors Affecting Structural Behaviour of Composite cold-formed Steel and Timber Flooring Systems.” Journal of Building Engineering 44.
- Kurokochi, Y., and M. Sato. 2015. “Effect of Surface Structure, Wax and Silica on the Properties of Binderless Board Made from Rice Straw.” Industrial Crops and Products 77: 949–953. doi:10.1016/j.indcrop.2015.10.007.
- Kyvelou, P., L. Gardner, and D. A. Nethercot. 2017. “Design of cold-formed Steel Composite Flooring Systems with Partial Shear Connection.” Ce/papers 1 (2–3): 1899–1908. doi:10.1002/cepa.234.
- Li, Y. 2009. “Study on the Stiffness of cold-formed Steel Floor Systems.” Chang`an University in Chinese
- Li, Y. S., H. Y. Shen, W. Shan and Tianshi Han. 2012. “Flexural Behavior of Lightweight bamboo-steel Composite Slabs”. Thin-Walled Structures 53: 83–90. 10.1016/j.tws.2012.01.001.
- Loss, C., and D. Buick. 2017. “Innovative Composite steel-timber Floors with Prefabricated Modular Components.” Engineering Structures 132 (1): 695–713. doi:10.1016/j.engstruct.2016.11.062.
- Loss, C., and A. Frangi. 2017. “Experimental Investigation on in-plane Stiffness and Strength of Innovative steel-timber Hybrid Floor Diaphragms.” Engineering Structures 138 (5): 229–244. doi:10.1016/j.engstruct.2017.02.032.
- Naser, M. Z., and N. V. Degtyareva. 2019. “Temperature-induced Instability in cold-formed Steel Beams with Slotted Webs Subject to Shear.” Thin-walled Structures 136: 333–352. doi:10.1016/j.tws.2018.12.030.
- Pinelopi, K., P. S. R. Thomas, T. S. B. Christopher and Yuner Huang. 2021. “Experimental Investigation on Composite Panels of cold-formed Steel and Timber.” Engineering Structures. 29.
- Satheeskumar, N., W. S. Deighton, G. Perampalam, Keerthan Poologanathan, Julian Thamboo, Craig Higgins, and Priyan Mendis. 2021. “Development of Cross Laminated timber-cold-formed Steel Composite Beam for Floor System to Sustainable Modular Building Construction”. Structures 32: 681–690. 10.1016/j.istruc.2021.03.051.
- Shi, L. Y., H. B. Zhang, Z. X. Li, Man, X., Wu, Y., Zheng, C., & Liu, J. 2018. “Analysis of Moisture Buffering Effect of straw-based Board in Civil Defence Shelters by Field Measurements and Numerical Simulations”. Building and Environment 143: 366–377. 10.1016/j.buildenv.2018.07.018.
- Sohel, K. M. A., J. Y. R. Liew, and A. L. Fares. 2021. “Shear Bond Behavior Of Composite Slabs with ultra-lightweight Cementitious Composite.” Journal of Building Engineering 44: 103284. doi:10.1016/j.jobe.2021.103284.
- Tang, D. B., B. Z. Cao, and W. T. Song. 2021. “Compression Behavior of Straw Bale and cold-formed Steel Composite Wall.” Science Technology and Engineering 27. 11696–11703. in Chinese
- Theng, D., G. Arbat, M. Delgado-Aguilar, Ngo, B., Labonne, L., Mutjé, P., Evon, P., et al. 2019. “Production of Fiberboard from Rice Straw Thermomechanical Extrudates by Thermopressing: Influence of Fiber Morphology, Water and Lignin Content.” European Journal of Wood and Wood Products 77 (1): 15–32. DOI:10.1007/s00107-018-1358-0.
- Wang, Y. H., J. Y. Chen, R. Zhang, et al. 2021. “Impact Response of steel-PU foam-steel-concrete-steel Panel: Experimental, Numerical and Analytical Studies”. International Journal of Impact Engineering 158: 104007. 10.1016/j.ijimpeng.2021.104007.
- Wang, T., H. K. Feng, W. T. Qiao, Su, J. Z., Wang, L. H., et al. 2022. “Study on Flexural Capacity of Profiled Steel sheet-polyurethane Sandwich Slabs.” Steel Construction (Chinese & English) 1–12. in Chinese
- Wang, Z. Y., C. X. Luo, W. L. Zhang, Mu, Z. H., et al. 2016. “Moisture-proof and Heat Insulation of Straw Building Slabs for Rural House in Zhejiang.” Building Energy Efficiency 44 (6): 30–33+42. in Chinese
- Wang, T., W. T. Qiao, K. J. Wang, Xu, Q., et al. “Finite Element Analysis on Flexural Capacity of cold-formed thin-walled Steel Sandwich Slabs.” Proceedings of the Twenty-first Chinese Modern Structural Engineering Symposium Shijiazhuang, China. 2021: 146–150. (in Chinese)
- Xia, Y. H., X. Y. Zheng, and J. Wei. 2020. “Vibration and Bending Performance of a Composite Panel built-up with Plywood and thin-walled Section Steel.” Chinese Journal of Wood Science and Technology 34 (3): 18–22. in Chinese.
- Zhang, W. Z. 2005. “Research of Production and Application of Straw Board.” Guangdong Building Materials 2. 25–27. in Chinese
- Zhang, X. H., E. Y. Zhang, and C. R. Li. 2021. “Study on Axial Compression Mechanical Behavior of cold-formed thin-walled C-shaped Steel Composite Wall Sheathed with Straw Board on Both Sides.” Structures 33: 3746–3756. doi:10.1016/j.istruc.2021.06.071.
- Zhang, X. H., E. Y. Zhang, M. Xu, et al. 2019. “Anti-seismic Experimental Study on thin-walled Steel Composite Wall with one-sided Cladding of Strawboard.” Journal of Building Materials 22 (6): 71–79. in Chinese
- Zhang, X. H., E. Y. Zhang and H. Yu, et al. 2021. “Axial Compression Performance of cold-formed thin-walled Square Steel stud-straw Board Composite Wall.” Science Technology and Engineering 21 (1): 283–289. in Chinese
- Zhang, X. H., E. Y. Zhang, and Y. Z. Zhang “Study on Shear Performance of cold-formed thin-walled Steel Walls Sheathed by Paper Straw Board.” Engineering Structures 2021; 245.
- Zhang, X. H., Z. L. Zhao, and X. Li. 2020. “Flexural Performance of cold-formed thin-walled steel-paper Straw Board Composite Slab.” Civil Engineering Journal 29 (1): 10–24.
- Zhao, M., X. Y. Zheng, X. Y. Wang, et al. 2015. “Study on Flexural Properties of Composite Slab Made of thin-walled cold-formed Steel and Italian Poplar Plywood.” Forest Engineering 31 (5): 124–129. in Chinese
- Zhou, X. H., Z. Li, R. C. Wang, and Shi, Y. 2013. “Study on load-carrying Capacity of the cold-formed Steel joists-OSB Composite Floor.” China Civil Engineering Journal 46 (9): 1–11. in Chinese
- Zhou, X. H., Y. Shi, L. Xu, Xinmei Yao, and Weiyong Wang. 2019. “A Simplified Method to Evaluate the Flexural Capacity of Lightweight cold-formed Steel Floor System with Oriented Strand Board Subfloor”. Thin-Walled Structures 134: 40–51. 10.1016/j.tws.2018.09.006.