
 ?Mathematical formulae have been encoded as MathML and are displayed in this HTML version using MathJax in order to improve their display. Uncheck the box to turn MathJax off. This feature requires Javascript. Click on a formula to zoom.
ABSTRACT
With the advancement of building technology, the pile-plate structure, which originated in railway engineering, has been adopted into highway engineering. This study presents a new pile-plate structure connecting node. The addition of energy-dissipating components at the nodes and the use of non-shrinkage concrete at the joints demonstrate its novelty. The node’s ability to enter the plastic stage is enhanced, resulting in increased seismic performance. In this study, the seismic performance and energy consumption capacity of the pile plate joint were studied by numerical model, and the results showed that the stagnation curve of the pipe pile under low cycle reciprocating load was full and had good energy consumption capacity. Under the action of random seismic vibration, the displacement of the pile plate structure in one direction is up to 0.023 m, which meets the requirements of the specification. The innovative pile-plate joints are used in a nonlinear dynamic time-history analysis of the constructed bridge structure.
GRAPHICAL ABSTRACT

1. Introduction
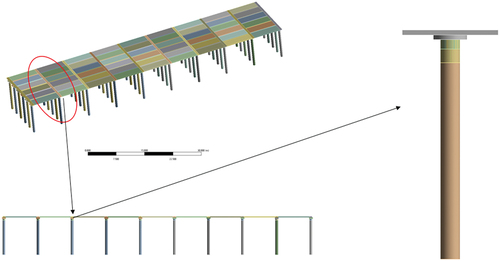
As a new type of structure, the pile-slab roadbed is proposed for large-scale highway reconstruction () (Bao Yuchan (Citation2018). Zhong-Wei, and Yan (Citation2020) denoted: In road construction, the supply of land resources is becoming increasingly tense, and the contradiction between no land to occupy and no land to take is very prominent. Compared with the traditional filling subgrade, the pile-slab roadbed has the characteristics of less soil filling and less settlement after construction, and the pile-slab structure has great advantages in dealing with geological structures such as deep soft soil, loose soft soil and deep collapsible loess. The pile-slab roadbed is an assembled structure composed of factory-prefabricated slab beams and pipe piles. Therefore, scholars worldwide have carried out much research on this structure.
Figure 1. Application of pile-slab structure.
In the 1990s, Finland took the lead in applying the pile-slab subgrade structure to the railway field. Since the Ermanninsuo area of Finland used to be a swamp, to effectively control the settlement and meet the train operation requirements, the design adopts a pile-slab structure. Subsequently, to deal with the problem of expansive soil on the new line of Nuremberg-Ingolstadt in Germany, a pile-slab structure was used to control the settlement of the foundation. Toivolaet et al. (Citation2005) studied the structural internal force, vibration characteristics, and settlement law of the pile-slab structure on the connecting line of the British-French submarine tunnel, and obtained many valuable data and useful conclusions. Bakeer, Shutt, and Zhong et al. (Citation2010) monitored many pile-slab composite structures in southeastern Louisiana, USA, to determine the key factors affecting their long-term performance.
More recently, Van Duijnen (Citation2005) used Plaxis 3D numerical software to analyze the stress and deformation characteristics of the pile-slab structure used on the Netherlands-Belgium high-speed railway, and proved that the pile-slab structure can well reduce the settlement caused by the tunnel passing through the high-speed railway. Through numerical analysis methods, O’Riordan (Citation2004) et al. finally obtained the settlement characteristics of pile-slab structures under long-term loads. Zhan et al. (Citation2006) used ANSYS large-scale finite element analysis software to analyze the dynamic response of pile-slab structures in high-slope, steep-slope sections and under earthquake conditions. A detailed nonlinear FE model was developed by Hawileh, Rahman, and Tabatabai (Citation2010) to accurately predict the behavior and performance of a hybrid frame beam–column connection subjected to cyclic loading. Bagheri, et al.(Citation2019) Retrofitting found that RC structures with FRP layers leads to structural reliability improvements during seismic excitation. These layers are installed quickly, reduce reinforcement costs and do not increase structural weight and stiffness. Zhang, et al. (Citation2022) established a nonlinear analysis model of the pile-soil interaction (PSI) system considering the permafrost effect and verified it with experimental results. Soleymani, & Saffari, (Citation2023) found that the concentric support frame (CBF) had limited and improved transverse displacement under moderate seismic conditions.
In addition, Yang (Citation2017) proposed two structural forms of pile- slab structure and hollow slab girder bridge for highway bridges under high-speed railway in soft soil areas, and carried out numerical simulation research. Under the condition of meeting the requirements of high-speed railway structure protection and operation safety, the pile- slab structure has better integrity and less maintenance workload than the hollow slab beam. Xu et al. (Citation2017) put forward the pile- slab beam bridge structure. The design ideas of pile- slab connection, slab, and existing subgrade connection are provided. Zheng (Citation2018) connected the solid elements and beam elements in the integrated pile column by using the MPC184 rigid beam, to achieve the purpose of collaborative stress, transfer force, force moment, and coordinate displacement and deformation of pipe piles with different element forms. Based on the background of the Hefei-Zongyang expressway, Zhu & Ding (Citation2018) and others carried out preliminary calculations on the fatigue performance of pile- slab connections and verified that the fatigue performance of the core-filled sleeve pile plate connection mode can meet the requirements of relevant specifications. Yang (Citation2018) took the prefabrication and installation of pile-slab structures as the research object and introduced the construction process of new pile- slab structures applied to highways. Lei (Citation2019) established the nonlinear finite element model of the pile plate connection structure based on the reconstruction and expansion project of the Lintou to Longxi interchange section of the G5011 Wuhe expressway, and verified that the designed pile- slab connection structure meets the practical application of the project. However, these studies are mainly applied to railways. The application and analysis of pile-slab structures on highways is less involved (Li S. , et al. Citation2021).
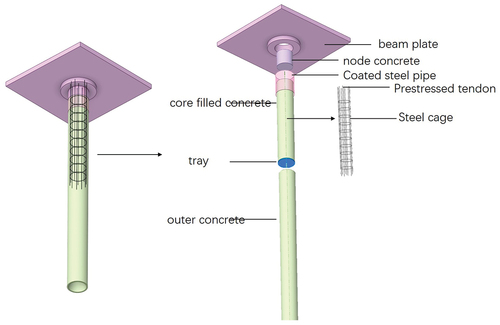
Based on above, a new type of connection node for pile-slab structure is proposed in this paper, as shown in . Pile-plate joints will be inevitably damaged by the combined action of static and dynamic loads during use. The failure of the nodes will affect the strength of the overall structure. Therefore, it is necessary to analyze the seismic performance of the connecting nodes of the pile and slab, and to carry out the numerical simulation of the whole pile slab under the earthquake effect.
Figure 2. Pipe pile structure diagram.
2. Specimen design
2.1. Proposition of structure
The pile slab structure adopts a swing structure, and the pipe piles and beam slabs are prefabricated in the factory and assembled on site. The joint part is made of plastic concrete, which increases its strength and at the same time increases its ability of plastic change, and plays a role in plastic hinge in the overall structure. During normal use, the shear force on the connecting part will be very large. To prevent local damage, steel cylinders are used to protect the joint concrete. Under the protection of the steel cylinder, the joint part of the pile slab is in a three-way compression state, which will significantly improve the strength of the joint. The energy dissipation part of the pile-slab structure consists of longitudinal bars, stirrups and prestressed steel bars in the middle of the nodes (He, et al. Citation2012). The prestressed steel bars are connected to the bottom tray to disperse the stress concentration caused by the prestressed tendons in the concrete. The overall model and local node model are shown in .
Figure 3. Pile-slab and pile-slab-node.
2.2. Material parameters
2.2.1. Concrete material properties
Due to the complex mechanical properties of concrete materials and the anisotropy of material mechanical properties, the constitutive relationship cannot be accurately described at present. However, determining the constitutive relation of concrete is the premise and key to analyze the force of reinforced concrete structure. At present, most of the constitutive models of concrete adopt nonlinear elastic model (Zhang, et al. Citation2013) and elastic-plastic constitutive model. The concrete stress-strain relationship in the finite element simulation (Li, et al. Citation2021) in the EquationEq. (1)(1)
(1) , (Equation2
(2)
(2) ), (Equation3
(3)
(3) ), (Equation4
(4)
(4) ). The stress-strain curve is shown in (taking C40 concrete as an example):
Figure 4. Concrete constitutive relationship curve.
Where is the concrete compressive stress when the concrete compressive strain is
;
is the design value of the concrete axial compressive strength, which is 25.4Mpa measured in this test;
is the concrete compressive strain value, when the calculated value of
is less than 0.002, it is taken as 0.002;
is the ultimate compressive strain of concrete in the normal section, when the calculated value is greater than 0.0033, it is taken as 0.0033;
is the standard value of the concrete cube compressive strength, which is the measured value of 33.4Mpa in this test;
is the coefficient, which is taken as 2.0 when the calculated value is greater than 2.0, it is taken as 2.0.
2.2.2. Steel properties
The steel bar in this article is HRB400 steel bar. To assist the nonlinear finite element calculation convergence, the constitutive relationships of the reinforcing bar are modeled by an elastic-plastic model with a strengthening stage. As shown in .
Figure 5. Steel constitutive relationship curve.
The relationship between and
is shown in the EquationEq. (5)
(5)
(5) :
where is the modulus of elasticity of the steel bar,
is the stress of the steel bar,
is the strain of the steel bar,
is the representative value of the yield strength of the steel bar.
3. Finite element model
3.1. Establishing the finite element model
The assembly sequence of the pile slab nodes as following: pouring the outer concrete, placing the steel tray in the appropriate place. placing the steel cage on the pallet-pouring the core fill concrete, leaving the position of the prestressed rib in the middle-using the back tension method to achieve prestressing-pouring the joint concrete connecting the precast beam slab with the node concrete. All solid contacts in the FE model are polygon-bound contacts, defining that there is no relative separation or slippage between faces. The reinforcement and concrete are connected by coupling nodes, and the relative slip between the reinforcement and the concrete unit is not considered. The specific geometric model is shown in .
Figure 6. Finite element model of pile-slab-node.
All entity contacts in the finite element model are surface-to-surface contacts. The steel bar and the concrete are connected by coupling nodes, and the specific implementation is realized by binding the pinball radius into the contact (Verma, and Mishra, Citation2019). This method does not consider the relative slip between the steel bar and the concrete element. Other detailed parameters of the model are shown in :
Table 1. Details of each part in the model.
3.2. Application of prestress
The methods (Fu, Citation2008) of applying prestress in finite element include cooling method and initial strain method:
(1) Cooling method. An initial temperature is set for the prestressed steel bar, and a temperature drop value is given. According to the principle of thermal expansion and cold contraction, the prestressed steel bar produces a shrinkage deformation, resulting in a pretensioning effect. As shown in EquationEq. (6)(6)
(6) .
where is the temperature drop value of the steel strand;
is the pretension force generated by the temperature change;
is the elastic modulus of the prestressed tendon;
is the cross-sectional area of the prestressed tendon;
is the Linear expansion coefficient.
(2) Initial strain method. Set an initial tension for the steel strand, and after relaxation, the steel strand will shrink and deform. This initial strain will give the strand a pretension. The mathematical expression is as EquationEq. (7)(7)
(7) :
where is the initial strain of the steel strand.
Compared with the initial strain method, the cooling method is relatively simple, and different prestresses can be set at different positions at the same time, that is, the stress loss can be simulated; The initial strain method usually cannot consider the loss of prestress, otherwise the real constants of each element are not equal, and the workload is large. Therefore, the prestressed steel bar is loaded by the cooling method, and the initial pretension is 5kN, which translates into a temperature reduction of 22°C.
3.3. Loading
The loading curve of the finite element model is in accordance with the provisions of the American AISC seismic standard (AISC Citation2010), and the low-cycle cyclic load is controlled by applying displacement loads to the beam ends. When the displacement is 1/800, 1/500, 1/250, 6 cycles per stage, the displacement is 1/150, 4 cycles, and when the displacement is 1/100, 1/80, 2 cycles per stage. Load curve is shown in .
Figure 7. Load institution curve.
4. Numerical simulation results and discussion
4.1. Residual deformation and residual stress
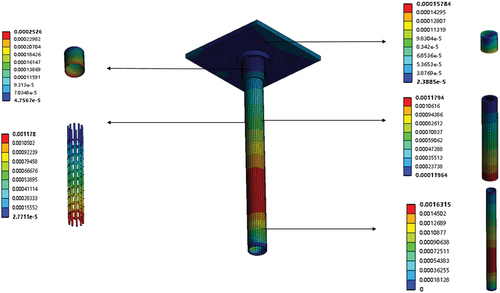
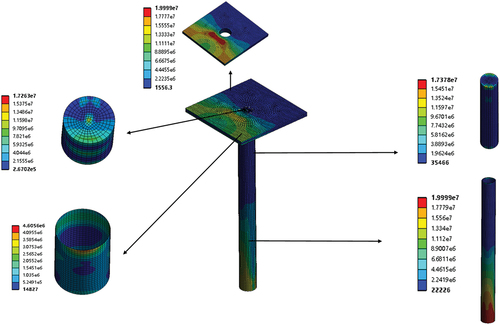
shows that the residual deformation mainly occurs in the middle section of the pipe pile (Ma, et al., Citation2019), and extends to both ends with a decreasing trend, and the residual deformation of the beam end mainly occurs in the cross-section of the load application position. The maximum deformation at the node of the pile slab beam is 0.0001 m, and the location of occurrence is at the connection between the node and the pipe pile. Due to the jacketed steel pipe’s hoop action, the damage of the joint concrete is minimized. In addition, the presence of nodal prestress also plays a delaying role in the cracking of nodal concrete. Residual deformation in each other part occurs at its bottom, ranging from 0.002 m to 0.0002 m.
Figure 8. Cloud diagram of residual deformation.
The maximum stress of the pile slab occurs at the bottom of the pipe pile, where the constraint is large, the stress value is 20Mpa, which is close to the ultimate tensile strength of the concrete, and it is easy to crack the concrete. The maximum stress of the pile slab node and the core-filled concrete occurs near the reinforcement cage, especially at the prestressed reinforcement, and the stress value is 17.7Mpa, which is less than the limit strength of the joint concrete. The stress distribution of each component is shown in .
Figure 9. Cloud diagram of residual stress.
4.2. Hysteresis curve
After applying the cyclic displacement according to the above loading system, the load and displacement relationship curve of the beam segment surface are extracted as shown in . At the beginning of the load, the relationship between load and displacement is linear. With the increase of the load displacement at the end of the beam, the cross-sectional reaction force shows a short straight upward trend and then enters the curve stage, and the structure enters the plastic stage. With the increase of the loading displacement, the cross-sectional reaction force shows a short straight upward trend and then enters the curve stage, and the structure enters the plastic stage. In the subsequent process of gradually removing the displacement, the reaction force on the cross-section shows a linear decrease. The hysteresis curve is typically fusiform and has good seismic performance.
Figure 10. Hysteresis curve and skeleton curve.
The skeletal curve of the model is derived from the load-displacement curve of the model quasi-static analysis. As shown in , in the elastic phase the skeleton curve is straight. With the increase of displacement at the cross-section, the pile slab structure began to have a large deformation, the concrete began to produce tiny cracks and gradually withdrew from the force process. Subsequently, the force on the steel bar slowly increases, and the overall structure enters the plastic stage. Although the stiffness of the pile slab nodes is reduced, it is still stable, and the skeleton curve has no descending section.
4.3. Energy consumption capacity
In the hysteresis curve, u is used to represent the hysteresis loop area. The value of u directly reflects the magnitude of the energy consumption capacity of the specimen. The energy dissipation of each stage of the specimen under the loading of 7 levels is shown in . The energy dissipation coefficient is calculated according to the EquationEq. (8)(8)
(8) . The values of S(ABC+CDA), S(OBE+ODF), and E under the loading system at all levels are shown in .
Figure 11. Energy consumption and indicators.
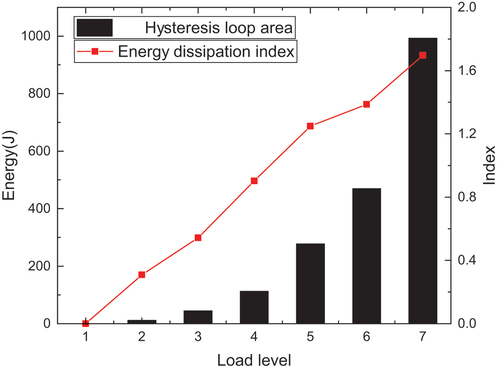
Table 2. Details of each level.
As shown in , the energy consumption capacity of the test piece shows a rapid upward trend with the increase of the loading system. After the 3rd stage is loaded, the joint concrete cracks and the energy-consuming parts are transformed into reinforced skeletons and prestressed steel bar. Due to the presence of prestresses the cracking time of the joint concrete is delayed. When the displacement angle θ ≥ 0.0067 rad, the energy consumption coefficient exceeds 1, indicating that the specimen still has good energy consumption capacity after the joint concrete cracks.
4.4. Evaluation of self-resetting ability
shows that with the maximum displacement of the structure increases the slope of the curve tangential gradually increases, and the residual displacement change shows a nonlinear upward trend. The EquationEq. (9)(9)
(9) is introduced to evaluate the energy consumption capacity of pile slab nodes:
Figure 12. Evaluation of self-resetting index.
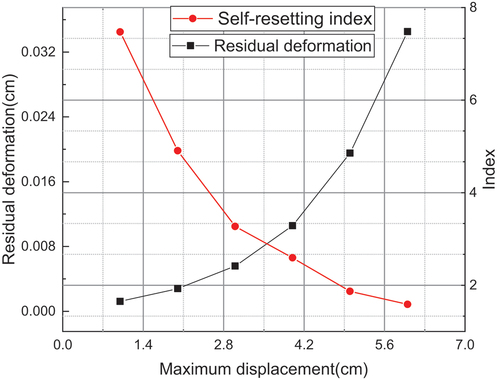
Where is the self-resetting index,
is the maximum deformation, and
is the residual deformation. As the amount of beam end displacement increases, the plasticity accumulation in the node is caused. When the plasticity accumulates to a certain extent, the node cracks. Currently, the concrete of the node part exits the bearing stage, and the reinforcement skeleton and the prestressed ribs jointly bear the load. As the displacement continues to increase, the reinforcement enters the plastic phase. Currently, the self-reset index drops to 0, and the structure produces irreversible deformation.
4.5. Prestress change
As shown in . With the temperature effect is applied, the initial prestress is 5650KN. The low-cycle reciprocating load is applied in the first second, when the structure begins to deform and the prestress begins to lose. At the second the displacement reaches the maximum value in the cycle and the prestress also becomes minimum. After the displacement is unloaded to 0, the prestress is also restored to 5650KN. This shows that the steel bar is now in the elastic stage. Then, with the increase of the periodic displacement, the overall prestress showed a downward trend. After 90s, with the failure of the concrete, the steel bar also entered the plastic stage, and the prestress began to decrease rapidly. Overall energy consumption is good.
Figure 13. Prestress change curve.
5. Seismic performance analysis of pile-slab
To study the seismic performance of the pile slab, a nonlinear dynamic time-history analysis of the beam-column joint of the pile slab was carried out with ansys workbench. Twenty ground motion records (from the Pacific Earthquake Engineering Research Center (PEER)) were selected for dynamic time history analysis of the piles to study the response of the structure to earthquakes (Ding, et al., Citation2021). The characteristics of the earthquake records are shown in .
Table 3. Characteristics of the earthquake records.
In this paper, according to the “China Earthquake Parameter Zoning Map”, a class II site is selected, the characteristic period Tg is taken as 0.4s, the peak acceleration of the site is 0.15 g, and an acceleration response spectrum with a damping ratio of 5% is generated as the target response spectrum. Then, according to the target response spectrum, scaling is performed to make it fit well with the target response spectrum. The pseudo-acceleration spectrum and average response spectrum of the ground motion are shown in :
Figure 14. Individual spectrum and average spectrum.
5.1. Overall response of the structure
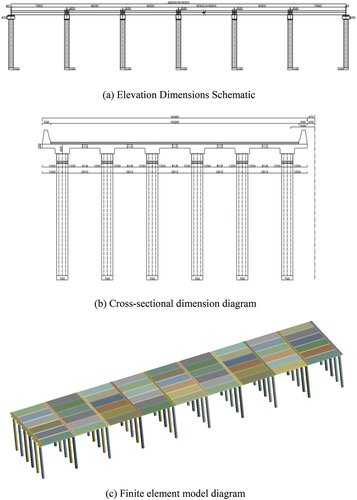
In order to verify the seismic performance of the integral pile-slab structure with prefabricated nodes, a finite element model is established according to the schematic size of the structure, as shown in the .
Figure 15. Overall structure size diagram.
The overall response of the structure is mainly determined by the maximum and residual displacements. shows the maximum displacement of the pile-slab structure, the abscissa is the ground motion of 20 earthquakes, and the ordinate is the maximum displacement of the structure under seismic dynamics. The maximum displacement is between 0.006 m and 0.023 m, and the maximum value appears in the 11th earthquake. The average value of the maximum displacement is 0.0125 m, which is less than the design value of the specification. The results show that the pile slab has good seismic performance under horizontal earthquake action.
Figure 16. Maximum deformation and residual deformation.
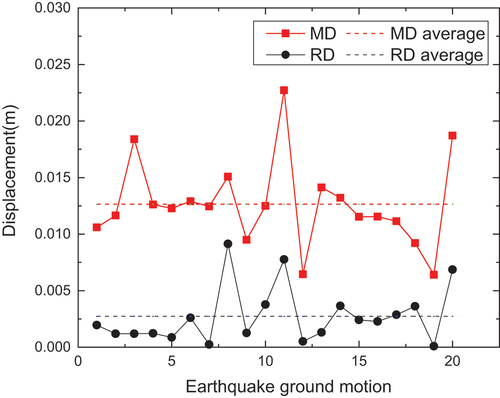
The residual deformation of the whole pile slab under the action of horizontal earthquake is shown in . Under the action of horizontal ground motion, the fluctuation range of residual displacement is small, and the average value of residual displacement is 0.0025 m, which is smaller than the set value set by the design specification. This shows that the pile sheet has good resilience when subjected to horizontal ground motion.
5.2. Dynamic time history analysis
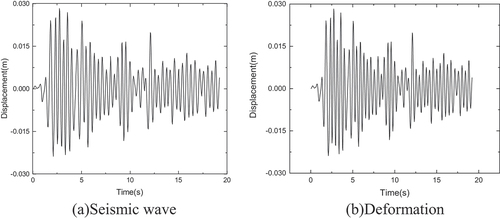
Select the No. 11 seismic wave with a frequency spectrum like the structure for horizontal seismic time history analysis (Lu, et al., Citation2015). The seismic wave is selected as shown in the . Considering the combination of structural self-weight effects, the Rayleigh damping model is used in the calculation. By calculating the model of the structure, the stiffness factor is 0.004 and the mass factor is 0.376. The ) shows the time-history displacement curve of the structure under the action of seismic waves. The results show that under the action of ground motion, the maximum displacement of the structure is 0.026 m, which is within the ultimate strength of concrete, and the residual deformation after the earthquake is close to 0. The pile-slab structure has good seismic performance.
Figure 17. Dynamic time history analysis.
6. Conclusions
In this paper, a new type of bridge support system is designed – pile plate structure. After numerical simulation, the results of the hysteresis curve, stiffness, energy consumption ability and self-resetting ability of the pile plate node under low cyclic reciprocating load are obtained, and the dynamic time course analysis of the whole system is carried out, and the main results are as follows:
The hysteresis curve of the pile plate node shows a full fusiform shape, due to the presence of the steel sleeve, the stiffness of the node increases, and the failure position appears in the lower middle of the pipe pile. In the subsequent design, it can be considered to replace the node concrete with low-strength and high-ductility plastic concrete, by increasing the strength of the pipe pile, so that the failure position is at the node, to meet the needs of special projects.
In the entire energy consumption system, the prestressed force in the prestressed steel rod plays a key role and is slowly consumed under low cycle reciprocating load. On the one hand, the presence of prestresses resists a part of the node negative bending moment and avoids premature destruction of the node. In the second aspect, it increases the self-resetting ability of the pile plate.
The dynamic time course analysis of the whole system shows that the bridge support system based on the pile plate structure is feasible in the seismic design. Under the action of the seismic load, the MD value and the RD value do not exceed the design specifications.
Disclosure statement
No potential conflict of interest was reported by the author(s).
Additional information
Notes on contributors
Liang Huang
Huang Liang(1982~), male, Ph.D., master's supervisor, working in the School of Civil Engineering, Zhengzhou University, mainly engaged in the research of hydraulic seismic resistance and long-span bridge structure.
Haotian Li
Li Haodian(1999~), male, graduate student, studied at the School of Civil Engineering, Zhengzhou University, mainly engaged in the research of seismic resistance of bridge structures.
Shizhan Xu
Xu Shizhan (1977~), male, Ph.D., professor-level senior engineer, School of Civil Engineering, Zhengzhou University, his main research direction is complex bridge structure theory, safety evaluation and intelligent monitoring.
Benliang Dai
Dai Benliang(1965~), male, master's degree, professor-level senior engineer, deputy chief engineer of Henan Provincial Transportation Planning Survey and Design Institute, main research direction is roads and bridges.
References
- AISC. 2010. Seismic Provisions for Structural Steel Buildings. Chicago: American Institute of Steel Construction.
- Bagheri, M., A. Chahkandi, and H. Jahangir. 2019. “Seismic Reliability Analysis of RC Frames Rehabilitated by Glass fiber-reinforced Polymers.” International Journal of Civil Engineering 17 (11): 1785–1797. doi:10.1007/s40999-019-00438-x.
- Bakeer, R., M. Shutt, J. Zhong, et al. 2010. “Performance of Pile-Supported Bridge Approach Slabs[J].” Journal of Bridge Engineering 10 (2): 228–237. DOI:10.1061/(ASCE)1084-0702(2005)10:2(228).
- Bao Yuchan. 2018. Anhui high-speed Play “Head Goose” Effect: With Scientific and Technological Innovation to Lead the Transformation and Upgrading of Construction Methods. China Central Radio and Television: Central Broadcasting Network.
- Ding, Y., Z. Zhou, L. Huang, Y. Si, et al. 2021. “Seismic Performance of self-centering Glulam Frame with Friction Damper”. Engineering Structures 245: 112857. Doi:10.1016/j.engstruct.2021.112857.
- Fu, Y., Z. Xiaoshui, and H. Cheng.2008. “Prestressed Concrete Structures the Ansys Simulation of Engineering and Construction.” 22 (6): 784–786. in chinese.
- Hawileh, R. A., A. Rahman, and H. Tabatabai. 2010. “Nonlinear Finite Element Analysis and Modeling of a Precast Hybrid beam-column Connection Subjected to Cyclic Loads.” Applied Mathematical Modelling 34 (9): 2562–2583.
- He, M., K. Xin, and J. Guo. 2012. “Local Stability Study Of New Bridge Piers With Self-Centering Joints.” Engineering Mechanics 29 (4): 122–127.
- Lei, J. 2019. “Nonlinear Finite Element Analysis of Connection Structure of Highway Pile Plate Structure Based on ANSYS.” Engineering and Construction 33 (5): 780–782.
- Li, S., et al. 2021. “Finite Element Analysis of Contact between new-built Structure and Old Subgrade in pile-plank Structure.” IOP Conference Series Earth and Environmental Science 676 (1): 012128. DOI:10.1088/1755-1315/676/1/012128.
- Li, L. Q., W. Y. Liao, and B. Y. Huo. 2021. “Finite Element Modeling and Nonlinear Analysis on the Optimum Opening Location for Continuous Composite Beams with Web Openings.” Tehnicki Vjesnik-Technical Gazette 28 (3).
- Lu, X. L., et al. 2015. “Shaking Table Test and Numerical Simulation of a 1/2-scale self-centering Reinforced Concrete Frame.” Earthquake Engineering & Structural Dynamics 44 (12): 1899–1917. DOI:10.1002/eqe.2560.
- Ma, S., et al. 2019. “Numerical Simulation Research on pile-plank for Reinforcing Soft Foundations of Highways.” Journal of Hebei University of Technology 48 (2): 69–73.
- O’Riordan, N. 2004. “Ground Engineering.” The Arup Journal 1: 18–21.
- Soleymani, A., and H. Saffari. 2023. ”Seismic Improvement and Rehabilitation of Steel Concentric Braced Frames: A Framework-Based Review”. Journal of Rehabilitation in Civil Engineering 11 (2). doi:10.22075/jrce.2022.26179.1611.
- Toivola, P., and A. Vesterinen. 2005. Real Time Safety and Structural Stability Monitoring of a Reconstructed Concrete Slab Railway Embankment on a Soft Ground after Its Collapse: Symposium “Keep Concrete Attractive”. Budapest: fib Symposium in La Plata.
- Van Duijnen, P. G. 2005. “Designing a Bridge with Plaxis 3D Tunnel. Stabilization of Vertialcut Using Soil Naillig.” 10–11.
- Verma, M., and S. S. Mishra. 2019. “Coupled fatigue-corrosion Life Estimation of Reinforced Concrete Beam: Numerical versus Experimental Approach.” Structural Concrete 20 (6): 2194–2205. doi:10.1002/suco.201800299.
- Xu, D. Q., and J. Xi. 2017. “The Application of pile-plank Bridge in Highway Reconstruction and Expansion Projects.” Modern Transportation Technology 14 (6): 40–42.
- Yang, F. 2017. “Numerical Simulation of pile-plank Structure and Hollow Board Beam Bridge Structure Traversing Construction under High-speed Railway Bridge.” Highway 62 (11): 73–79.
- Yang, Q. Y. 2018. “Research on Construction Technology of Highway Pile Slab Subgrade Based on Industrial Construction.” Research on Urban Construction Theory (18): 128–129.
- Zhang, X. Z., L. L. Liu, and K. D. Tang. 2013. “Nonlinear Analysis of Reinforced Concrete Beam by ANSYS.” In 2nd International Conference on Civil Engineering, Architecture and Sustainable Infrastructure (ICCEASI 2013). Zhengzhou: PEOPLES R CHINA.
- Zhang, X., S. Yu, W. Wang, J. Guan, Z. Xu, and X. Chen. 2022. “TI Nonlinear Seismic Response of the Bridge Pile Foundation with Elevated and Embedded Caps in Frozen Soils.” Soil Dynamics And Earthquake Engineering 161.
- Zhan, Y., G. Jiang, and Y. Wei. 2006. “Analysis of Dynamic Response of Subgrade of Ballastless Track pile-slab Structure under Seismic Load.” China Railway Science (6): 22–26.
- Zheng, W. C. 2018. “Research on the Joint Performance of Pile Foundation Pile.” Engineering and Construction 32 (1): 68–71+82.
- Zhong-Wei, X., and Z. Yan. 2020. “Finite Element Modeling and Seismic Response Analysis of Pile Slab Structure.” 2020 International Conference on Intelligent Transportation, Big Data & Smart City (ICITBS). Proceedings Vientiane, Laos: p. 122–126.
- Zhu, J., and N. Ding. 2018. “Fatigue Performance Analysis about Connection Joint of Pile-Plank Bridge.” Engineering and Construction 32 (5): 673–675.