
 ?Mathematical formulae have been encoded as MathML and are displayed in this HTML version using MathJax in order to improve their display. Uncheck the box to turn MathJax off. This feature requires Javascript. Click on a formula to zoom.
ABSTRACT
Mitigating global warming and climate change has become a crucial mission for sustainable development all over the world. This research focus on the feasibility of development near-zero water consumption buildings. The water saving motivation is necessary to be raised by a clear measurement basis for the rational water use of buildings and encourage more efforts to improve building water-use efficiency.A water conservation benchmarks and grade labelling assessment system for residential buildings had been established. We concluded a simplified and reliable building water evaluation method for implementation in residential buildings. Meanwhile, this study investigated the actual water consumption data of existing buildings in Taiwan, analyzed the water consumption intensity per unit area of residential buildings, and grasped a reasonable and precise benchmark for building water consumption. The water consumption intensity per building area was analyzed to verify the theoretical water consumption estimation method. Eventually, we summarized the annual average benchmark and graded labelling system of domestic water consumption for individual residential building evaluations. Furthermore, this study integrated Taiwan’s green building labeling system and carbon reduction evaluation system with water-saving technology, which was anticipated to target the development of near-zero water consumption buildings.
1. Introduction
In general, humans around the world use 4,600 cubic kilometers of water per year. Under the impact of constantly increasing population, water consumption of agricultural, industrial as well as domestic uses has been increasing in annual growth rate of 1%, which is six times more than that of a century ago, while around 3.6 billion people on earth are suffering from water shortages. By 2050, it is estimated that there will be up to 5.7 billion people suffering from water shortages worldwide, leading to an urgent call for an efficient water planning. Climate change, global warming, and the depletion of energy resources have become urgent environmental issues faced by countries all over the world. Resource conservation and carbon reduction strategies are necessary actions and future trends. The 2021 United Nations World Meteorological Organization pointed out that as early as 2018, 3.6 billion people worldwide did not have access to sufficient fresh water for at least one month every year (State of Global Climate Citation2021). Warming temperatures cause global and regional changes in precipitation, altering rainfall patterns and agricultural seasons, with major implications for food security and human health well-being. The frequency of water-related crises has increased over the past 20 years; meanwhile, the number and duration of drought events have increased by about 30% over the past 20 years (Zadeh, Hunt, and Rogers Citation2014). In addition, the outbreak of the COVID-19 pandemic has prompted authorities to upgrade standards for public sanitation and health. Eventually, these situations will put further pressure on household tap water use and whole-building demands (Wong et al. Citation2021). Therefore, the effective use of freshwater resources through the design and management of water-saving equipment has become more important than ever.
Establishing a reasonable and feasible benchmark for building water use, as well as accurately evaluating and marking building water use, are important for building water conservation and effective water resource usage (Cheng-Li et al. Citation2016) and could provide key references for improving building water-saving designs. The lack of a clear measurement basis for rational water use in buildings has resulted in limited water-saving motivation during building planning and has hindered efforts to improve building water-use efficiency (Cheng et al. Citation2012; Cheng Citation2002a; Kanako, Takayuki, and Yasutoshi Citation2016). Residential buildings are the largest building type and have the highest water consumption; however, they also have the highest water-saving potential. This study aims to improve accuracy and fairness in credit scoring of the Water Resources Evaluation under EEWH, the green building evaluation system in Taiwan, by analyzing the expected domestic water consumption per unit floor area of a building design. The main purpose of this article is water conservation benchmarks and tried to build a grade labelling assessment system for residential buildings. We established a simplified and reliable building water evaluation method to be implemented and promoted in residential buildings. The current building water resource labeling method, the building water usage intensity index (WUI), the Building Energy Asset Score of the US Department of Energy (DOE), and the technical potential scale method were all used to establish the building water consumption labelling assessment system (Karpman et al. Citation2017). The graded label and evaluation system could provide positive encouragement and promotion for the effective utilization of water resources in buildings (Cheng and Lee Citation2005).
2. Literature review
2.1. Green building and near-zero water consumption
Taiwan Green Building evaluation (EEWH) is a practical system in which water conservation is prioritized as one of its categories for saving water resources through building equipment design in Taiwan (CHENG Citation2002). The Green Building evaluation program established a water conservation index with quantitative methodology and validation. This evaluation index involves standardized scientific quantification and can be used in the pre-design stage to obtain the expected result. The measure of evaluation index is also based on the essential research on Taiwan and is a practical and applicable approach.
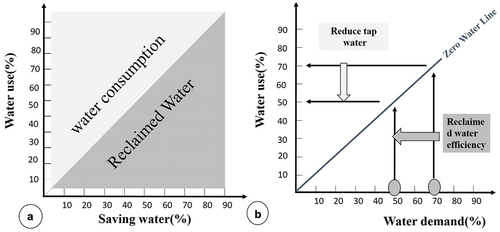
The implementation methods of buildings with near-zero water consumption should put efforts into both water saving and water reclamation systems. Under the premise of non-drinking and non-contact with the human body, rainwater is a convenient source of water for building planning (Yasutoshi et al. Citation2012; Chen et al. Citation2012; Cheng Citation2002b). According to existing research statistics, at least 32% of general residential water can be substituted with reclaimed water. As an alternative water resource, a considerable proportion of reclaimed water can be used for toilets and sanitary equipment, cleaning, gardening, and other purposes, which all account for a considerable proportion of daily water usage (Yasutoshi, Satoshi, and Kanako Citation2013; Toyosada et al. Citation2012; Minami et al. Citation2015). Other types of buildings can replace a higher proportion of water consumption. Recycling or reusing rainwater and reclaimed water to replace the original tap water can also greatly mitigate the pressure from water shortages in the country. Especially, it can reduce the pressure of water outages during environmental crises and disasters. However, as the balance means of water consumption, it is necessary to conduct more advanced purification processes and provide equipment for reclaimed water in accordance with water quality requirements for body contact or drinking water. The priority strategy for near-zero water consumption buildings should be saving water; that is, buildings must reduce water consumption through various water-saving designs and facilities (Wong, Cheung, and Mui Citation2013; Mangsham and Berrin Citation2012). Then, the use of rainwater utilization and reclaimed water recycling can realize the vision of a near-zero water consumption building (Yasutoshi Citation2013). The concept of the near-zero water consumption building is water saving and water use offsetting each other x-axis and y-axis units are percentages is shown in .
Figure 1. The conception of near-zero water consumption building method.
2.2. Annual water consumption and rainfall in Taiwan
This study aimed at establishing a water consumption evaluation and labeling system for residential buildings during the planning and design stage, or for existing residential buildings that cannot obtain clear measured data and bill records. First, it was necessary to reasonably estimate building water consumption rates as alternatives for measured data or water consumption records. The estimated building water consumption was calculated based on the current per capita water consumption in Taiwan, with the weighted conversion of building water planning facilities and the use of water-saving equipment. According to the survey of daily domestic water consumption, data on the per capita daily domestic water consumption was collected from 2001 to 2020 in Taipei City and other regions in Taiwan. The data revealed that the average annual water consumption overall is decreasing Taipei Water Department Statistical Yearbook (Citation2001-2020). The statistical annual report also showed that the per capita water consumption in the urbanized area of Taipei is relatively higher than in other areas. According to the data of the past 20 years, there has been a trend of stable water use in the past 10 years. This study used the average value of the water consumption data in the past 10 years as the calculation basis, as shown in . This study considered the weighted statistics of residential water use data, according to annual reports on Taipei and Taiwan’s tap water statistics. The aggregated per capita water consumption of residential buildings was found to be 0.19 m3 person per day and was adopted as the estimation criterion.
Figure 2. Annual household water consumption in Taiwan from 2001 to 2020.
The key factor to achieve and practice the goal of near-zero water consumption buildings is the planning of rainwater reuse and reclaimed water recycling. Rainwater is a convenient substitution for preliminary water treatment, according to current regulations. As an alternative water resource, rainwater can be used for toilets and sanitary equipment, cleaning, gardening, and other purposes to balance the building water consumption. Taiwan is located in the Asian monsoon region and has a large annual rainfall. Through the rainy season and the rainfall brought by typhoons, it could be seen that the surveyed national rainfall trend for nearly 40 years, from 1980 to 2020, has been approximately 2000 mm/year, with some extreme years, as shown in . Accordingly, in order to achieve and practice the goal of near-zero water consumption buildings, including a rainwater harvesting system is a high priority strategy for building planning in Taiwan.
Figure 3. Annual rainfall in Taiwan from 1980 to 2020.
3. Evaluation method and labelling system
3.1. Evaluation and labelling scale
This study explored the method of assessment and the labeling of water consumption in residential buildings. We adopted the methodological concepts of the scale of the system and technical potential, which is the reference of the Building Energy Asset Score (BEAS) scoring method jointly developed by the US Department of Energy and ASHRAE (Kanako, Takayuki, and Yasutoshi Citation2016), a grading evaluation scale method was used to create a virtual WUI distribution and grading benchmark for buildings, and to evaluate the water usage efficiency of individual buildings. This method used Latin hypercube sampling to convert the simulated WUI database into a series of stepped linear scales for scoring (Matos et al. Citation2013; Wang et al. Citation2016; Roulet and Anderson Citation2006). The evaluation scale established by the model calculation was called the technical potential scale (ASHRAE 2009). Usually, the median level of a building’s general technology is set as the baseline for water-saving regulations (Castillo-Martinez et al. Citation2014a). The baseline for near-zero water consumption in buildings was used to set the technical potential reference. The points for the scoring and evaluation of the building water consumption scale were used for the evaluation and grading of residential building water consumption, as shown in . This study used the concept of statistical scales to clarify the judgment of water consumption and water saving in residential buildings (Otani, Toyosada, and Shimizu Citation2015; Castillo-Martinez et al. Citation2014b). Accordingly, the water consumption assessment and classification results could provide feedback to rearrange the planning and design of building water resources and facilities.
Figure 4. Schematic diagram of the statistical scale (left) and technical potential scale (right).
3.2. Evaluation indicators and benchmarks
This study used the WUI as the basis for the evaluation and grade labeling. According to previous research and documents, the baseline of the WUI index was arranged for different types of buildings (Cheng-Li et al. Citation2016). The benchmark calculation was based on the unit area of the buildings’ floors, and the relationship between building water consumption intensity and building function was considered. After standardizing the individual water consumption data, the estimated results were finally verified and revised with the measured data, so as to improve the reliability of the building water consumption assessment and grade labeling system. The water consumption estimation benchmark for general buildings was mainly based on daily per capita usage (daily water consumption per person). The established parameters included the estimated facility utilization rate, Fri, the per capita annual water consumption, Qwi (m3/person·year), and the density of people per floor area, Pdi (person/m2), which were used to calculate the building water consumption intensity, WUI. The annual water consumption per building area was determined according to the building usage type and building usage characteristics (m3/m2·year), as shown in formula (1).
WUI: Per capita annual water consumption benchmark per unit area (m3/m2·year)
Pdi: Floor area density per capita (person/m2)
Qwi: Annual water consumption benchmark per capita (m3/person·year)
Fri: Building facility utilization rate
The Monte Carlo method SMS (sample Monte Carlo simulation) is a discrete function integrator that is widely used in reliability and uncertainty analysis. It uses probability and random numbers for computer simulation statistics. The basic concept of the Monte Carlo method is to use a discrete approximation to find the average instead of using the continuous average. In order to establish a water consumption assessment and labeling system for collective residential buildings, this study extended more accurate and feasible basic assessment indicators from the existing water resource assessment data in Taiwan’s green building statistics. Generally, it is not easy to obtain complete data when there are no clear water consumption data or water monitors available for the water use assessments of residential buildings. In fact, water consumption data is often missing, and errors often occur. This study constructed a water consumption simulation estimation model based on the variable relationship between various types of water equipment and facilities in actual cases and used the Monte Carlo sampling method to generate a large number of simulated cases to obtain relevant data instead of actual measurements.
Due to the predictable characteristics of the applied water equipment and water consumption data, the Monte Carlo method was used for simulation and verification. In this study, a total of 120 residential buildings in Taiwan were used as cases, and the annual capita WUI of each case was estimated based on the calculation method. The actual case analyses revealed the average annual water consumption basically conformed to a normal distribution with a right skew. The per capita annual water consumption per unit area was then used as the benchmark for constructing the simulation model.
3.3. Case simulation analysis
Before carrying out the building water consumption assessment and calculating the labelling system, it was necessary to determine the assessment benchmark parameters. This study used the practical data of residential buildings as the basis for the assessment and estimation. The benchmark was based on the per capita annual water consumption per building area of each case (m3/m2·year), and the median, maximum, minimum, average, and deviation values for the 120 actual cases were determined. The overall calculation results showed a right-skewed distribution, a mean value of 1.93, a median value of 1.90, a maximum value of 4.25, a minimum value of 0.17, and a deviation of 0.84, as shown in . These parameters were used for the follow-up calculations and provided the basis for classification.
Figure 5. Residential building WUIm (MCS) simulation results.
Accordingly, determining the number of samples to be simulated in an efficient manner was also an important issue. The method adopted in this study was the estimation and observation of error convergence. The Monte Carlo analysis method was used to simulate the data series, and statistical plotting was used to obtain the convergence trend of the error value and thereby determine the appropriate simulation. Eventually, the error value approached zero after about 12,000 calculations had been run during the simulation process, so the accurate median value could be obtained by judging 12,500 samples from the simulation based on this benchmark.
Patterns should be deconstructed into a number of distinct independent variables before simulating them. In this way, in addition to clearly defining the variables to be simulated, it is possible to avoid erroneous judgments in the simulation operation caused by the correlation between multiple variables. Meanwhile, it was necessary to first decompose the model into a relationship of multiple variables, define the random variables, fixed values, and fixed data that could be collected, further determine the variables to be simulated, and finally perform the simulation operation. The results and other variables obtained through the investigation were combined into the original model, after which the final sample to be simulated was obtained. Monte Carlo analysis was performed on 120 cases of residential buildings. The WUIm results were analyzed using 12,500 pieces of data, and the error values approached zero. The median was 2.59 (m3/m2·year), the minimum value was 0.24 (m3/ m2·year), and the maximum value was 5.79 (m3/m2·year). These were the basic parameters of the subsequent system evaluation formula and provided a reliable basis for the classification of residential buildings, as shown in .
3.4. Grade labeling system
According to the actual water intensity evaluation in the parent body distribution, a standardized right-biased distribution model of building WUI was constructed as a basis for scoring. Therefore, this study established a standardized building distribution based on the virtual median WUImid, minimum WUImin, and maximum WUImax for the water consumption of residential buildings. The normal right-biased distribution rule distinguished seven grades of evaluation criteria in the labelling system. Four grades were classified in order on the left side of the median score: nearly water-saving buildings, water-saving buildings, extreme water-saving buildings, and nearly zero water-consuming buildings. Three grades were classified on the right: non-water-saving buildings, water-consuming buildings, and extreme water consuming buildings. The non-water saving levels were below WUImid and therefore unqualified for the water conservation index. The water consumption grade labelling system for residential buildings is shown in .
Figure 6. Skewed distribution classification.
According to the characteristics of the normal right-biased distribution, the model was used to simulate the minimum, median, and maximum WUI values for the residential buildings, so as to delineate the evaluation scale of the water use assessment system from best to worst and establish the water consumption evaluation system. The grade labelling system was the WUI distribution parsed by the benchmark model under the standard situation, and the scale ranged from level A to level G, of which level A represented a near-zero water consumption building. In addition, below the baseline of WUImid, the grade interval was rated as levels E–G, of which level G represented an extreme water-consuming building. This evaluation scale was based on the European standard EN15217 (Yasutoshi Citation2013). This study takes the grading parameter with the median value of the actual case, and the value of the best water-saving technology in the actual case is the highest reference point to be the water-saving potential strategy and technical evaluation scale. According to the extension of building WUI, the building model and water consumption zoning simulation were set to a normal right-biased distribution of the maximum, median, and minimum values according to the grade labelling scale. Finally, the parent distribution of all the buildings was compared with the estimated distribution to verify the virtual water consumption and corresponding scale.
The benchmark for the per capita annual water consumption, WUIs, was determined by an empirical estimation, as shown in formula (2). According to the determined benchmark, the virtual water consumption distribution and the corresponding scale for the grading label of its evaluation system were established. The first step in implementing the water consumption assessment model was to determine the baseline model of individual cases and then calculate the median, maximum, minimum, deviation, and average value for each case. According to the survey, the average domestic water consumption per person per day in Taiwan in the past ten years was 0.19 m3/person·day. This number was used as the fundamental parameter to estimate the total annual building water consumption, Qw, as shown in formula (3). In addition, the influence of occupant intensity was considered as a calibrating weight factor for the benchmark calculation. It is considered that the same occupants in a large-space house would cause the low-level water consumption benchmark, and vice versa, in a small-space house would conduct to the high-level baseline. Accordingly, weight coefficient rd was used to correct evaluation consistency and avoid deviations and distortions of the grade labelling results, as shown in formula (4).
WUIs: Benchmark of per capita annual water consumption (m3/m2·year)
Qw: Annual water consumption (m3/year)
np: Number of residential persons
rd: Occupant intensity weighting factor
Pavf: Occupant intensity baseline in common dwelling units (person/m2)
Pf: Occupant intensity of evaluated object (person/m2)
As the evaluation object of the residential buildings, WUI was used as an indicator of grade labelling assessment; that is, the annual per capita water consumption per unit area of the residential building was estimated to comply with its virtual water consumption distribution and the corresponding scale for the grading label of the evaluation system. The estimation of the WUI was calculated as shown in formula (5). The actual water consumption of a residential building can be measured by installing water meters or be obtained from water bill records. However, the measured values and the estimates made using water bill records are limited by factors such as usage patterns and residential occupancy rates, making it necessary to reconfirm the corresponding parameters and accuracy. In this study, the water consumption estimations considered water-saving design and facility planning as factors. This study used water resource and water-saving assessment indicators for green building evaluation system in Taiwan (Chen et al. Citation2012). Based on the planning of water-saving facilities, the reasonable water consumption of buildings was estimated as the evaluation object. The calculation of the estimated value, Qd, of water consumption for residential buildings is shown in formula (6), which mainly took the green building water resource water saving assessment coefficient RS8 as the calculation parameter and was limited by the maximum water saving rate for residential buildings (0.355) (Cheng-Li et al. Citation2016). If there were large water-consuming projects such as garden irrigation equipment, landscape ponds, swimming pools, etc., as well as rainwater recycling equipment, the estimated building would be weighted and included in the calculation of the annual water consumption density of the building, as shown in formula (7). If an existing building was able to obtain a clear water bill record or install a water meter to measure the actual water consumption data, the actual water consumption could be converted into the building’s WUI evaluation procedures.
WUI: Annual water consumption intensity per unit area of the building (m3/m2. year)
Af: Effective floor area of the dwelling area (m2).
Qd: Estimated annual water consumption of the residential building (m3/year)
Wc: Annual water consumption of large water-consuming projects (m3/year)
Wr: Annual replacement water volume of rainwater or reclaimed water (m3/year)
np: Number of people living in the building
RS8n: Water resource assessment indicator score of the Taiwan green building system
Src: Maximum water saving rate for residential buildings (0.355)
Cg: Water coefficient for garden irrigation
Cf: Landscape pond water use coefficient
Cp: Swimming pool water coefficient
In order to establish a grading system for residential building water consumption, the matrix distribution of the aggregated residential buildings’ WUI was aggregated, and the range between WUImax and WUImin was used for scoring, with a scoring interval of 0 to 100. The final graded score, WUIscore, of the water consumption label for the residential building was identified as the grading label. The WUIscore baseline value of 60 points was the qualified level, and the intervals of WUImin–WUI and WUI–WUImax were divided into 1–100 points. The grade labelling scale was based on WUI as the 100-point baseline. This study takes 90–100 points above the baseline as the near-zero water consumption building level (indicated by level A), and then using 100–60 as the level of A–D with the qualified benchmark of level D. Meanwhile, the WUI–WUImax interval of 59–0 on the right side was divided into grades E–G for the non-water-saving building levels, as shown in formula (8).
WUIscore: Building water consumption classification grade labelling score
On the other hand, the building water consumption index was used to estimate the water consumption items and the utilization degree of rainwater and reclaimed water included in the basic calculation parameters. The water resource index of Taiwan’s green building evaluation system arranges large water consumption items in residential buildings and also claims the compensatory, such as garden watering equipment, landscape ponds, swimming pools, and other facilities. Meanwhile, rainwater utilization and reclaimed water recycling are applied to be the compensatory of water consumption. In addition to water-saving equipment, the evaluation of water-saving design is an important factor in determining the water consumption level of a building and is the focus of water-saving technology design and operation planning. In order to get the normalized estimation of the large water consumption items for evaluation, the parameters of the large water consuming items and recycled water were determined from actual cases, as shown in .
Table 1. Normalized parameters of large consuming water items and recycled water.
4. Validation and analysis
4.1. Validation of estimated water consumption
The calculation of the estimated water consumption, Qd, for the evaluation object of residential buildings was based on Taiwan’s per capita annual water consumption and used the green building water saving assessment coefficient RS8 as the adjustment parameter to obtain the estimated water consumption, Qd, and to determine the WUI. This study provided a clear estimation method for residential buildings in the planning stage and for which water consumption records cannot be obtained from a water meter. A total of 40 cases of residential buildings in which water bill records were obtained and converted into actual water consumption were arranged for validation and comparison to prove the reliability of evaluation system, and the estimated values were used for verification and comparison as well. The results showed that the estimated values roughly corresponded with the measured values. The correlation analysis showed a good fit with an R2 of 0.8447. The empirical correlation distribution is shown in .
Figure 7. Comparison of the estimated values and the measured data.
4.2. Case verification
This study deduced the water consumption grade label through the proposed evaluation system apply to a practical residential building case. The area of this residential building was 13,002.06 m2, the number of occupants was 372, and the total estimated water consumption was 25,798.2 m3/year. Through formula (6), the WUI value was 1.31 (m3/m2·year), and through formula (3), the WUIs value was 3.61, which was used as the benchmark value. The relationship between the deviation values was used to find the case evaluation grading standard. The results of the above evaluation and grade labelling method showed that the evaluating case was graded to be the second level in the grade labelling and evaluation system, with a score of 81.57 points, which put the building at the level of extreme water-saving, as shown in . Through this quantitative estimation and labeling evaluation system, the water-saving performance and water-saving level of the building could be clearly displayed, and the results were in line with the building’s goal of near-zero water consumption.
Figure 8. Water consumption grading and evaluation verification of a residential building.
4.3. Empirical evaluation and analysis
According to the water evaluation system and grading method for residential buildings established in this study, the scores were expressed in the range of 60 to 100 points and were organized into 4 levels: near-zero water buildings, extreme water saving, water saving buildings, and the baseline. The levels under the baseline level of water-saving buildings were defined as belonging to non-water saving buildings, and the scores ranged from 59 to 0 points, representing three levels: non-water-saving, water-consuming, and extreme water consuming buildings. In this study, 140 residential buildings were randomly sampled for practical evaluation and empirical validation. The results of the practical evaluation presented an slightly skewed normal distribution, as shown in . As a result, 79% of all evaluated cases was above the water-saving level, and 21% of the non-water-saving buildings were under the baseline level.
Figure 9. Classification statistics and distribution of the evaluated cases.
Herein, the water resources assessment indicator score RS8 of Taiwan green building evaluation system was used as the estimation basis. The case evaluation results indicated that the relationship between the graded evaluation scores of the verification cases and the RS8 parameters generally showed a significant positive correlation, as shown in .
Figure 10. Relationship between the water resources assessment indicator score and RS8 of the practical cases.
The WUI of the residential buildings was used as the evaluation index, which represents the annual per capita water consumption per unit building area in the residential buildings. The WUI values of all cases and the corresponding grade labelling score demonstrated a negative correlation; that is, a lower WUI value indicated a higher evaluation score and vice versa, as shown in . The analysis results also showed that the related discrete values were slightly larger between the graded labelling heights, which indicated the challenges and difficulties in the practice of near-zero water consumption buildings.
Figure 11. Distribution of the relationship between the estimated WUI value and the evaluation score of the residential buildings.
A clear measurement basis for rational water use in buildings is important to raise the water-saving motivation during building planning and encourage the efforts to improve building water-use efficiency. The proposed graded label and evaluation system could encourage and promote the effective utilization of water resources in buildings. This study could help to build management sectors to become aware of the importance of water conservation in residential buildings and assist in initiating policy-making processes. Efforts to save water could be consolidated to achieve synergy with carbon reduction policy that benefit building service engineering.
5. Conclusion
This research focus on the feasibility of development near-zero water consumption buildings. The water saving motivation is necessary to be raised by a clear measurement basis for the rational water use of buildings and encourage more efforts to improve building water-use efficiency. We established a simplified and reliable building water evaluation method for implementation and practical promotion in residential buildings. The water usage efficiency of actual building cases according to the buildings’ WUI was analyzed, and a water consumption benchmark was established for residential buildings. The graded label and evaluation system could encourage and promote the effective utilization of water resources in residential buildings. This study investigated the actual water consumption data of existing buildings in Taiwan, analyzed the water consumption intensity per unit area of residential buildings, and determined a reasonable and correct benchmark for building water consumption. We summarized the annual average benchmark and graded labelling system of domestic water consumption for individual residential building evaluations. Furthermore, this study integrated Taiwan’s green building labeling system and carbon reduction evaluation system with water saving technology to target the realization of near-zero water consumption buildings.
Acknowledgments
The authors thank the Ministry of Science and Technology of Taiwan (MOST 109-2221-E-011-034) for financially supporting this study.
Disclosure statement
The author(s) declare that they have no known competing financial interests or personal relationships that could have appeared to influence the work reported in this paper.
Additional information
Funding
Notes on contributors
Cheng Li Cheng
Cheng-Li Cheng is the Professor at National Taiwan University of Science and Technology. He is a researcher and published widely on a range of water supply and drainage in building. He has published extensively on a range of sustainable issues, including the water and energy conservation for green building.
Sadahico Kawamura
Sadahico Kawamura is the Ph.D student at National Taiwan University of Science and Technology, Department of Architecture. His research is focus on energy conservation for green building.
References
- Castillo-Martinez, A., A. Gutierrez-Escolar, J. Gutierrez-Martinez, J. Gomez-Pulido, and E. Garcia-Lopez. 2014a. “WaterLabel to ImproveWater Billing in Spanish Households.” Water 6 (5): 1467–1481. doi:10.3390/w6051467.
- Castillo-Martinez, A., A. Gutierrez-Escolar, J. Gutierrez-Martinez, J. Gomez-Pulido, and E. Garcia-Lopez. 2014b. “Water Label to Improve Water Billing in Spanish Households.” Water 6 (5): 1467–1481.
- Chen, H. C., C. L. Cheng, W. J. Liao, and Y. C. Chung “Creation of Carbon Credits System by Building’s Water Saving in Taiwan Practicability, 2012.” In Proceedings of 2nd International Symposium on Plumbing System in East Asia, Taipei, Taiwan, 3 November 2012; pp. 300–308.
- CHENG, C.-L. 2002. “Evaluating Water Conservation Measures for Green Building in Taiwan, Building and Environment.” The International Journal of Building Science and Its Applications, UK 38 (2): 369–379.
- Cheng, C. L. 2002a. “Study of the Interrelationship between Water Use and Energy Conservation for a Building.” Energy and Buildings, UK 34 (3): 261–266. doi:10.1016/S0378-7788(01)00097-4.
- Cheng, C. L. 2002b. “Evaluating Water Conservation Measures for Green Building in Taiwan.” Building and Environment 38 (2): 369–379. UK. doi:10.1016/S0360-1323(02)00062-8.
- Cheng, C. L., and M. C. Lee. 2005. “Research on Hot Water Issues in Residential Building in Subtropical Taiwan.” Journal of Asian Architecture and Building Engineering 4 (1): 259–264. doi:10.3130/jaabe.4.259.
- Cheng, C. L., W. J. Liao, Y. C. Liu, Y. C. Tseng, and H. J. Chen “Evaluation of CO2 Emission for Saving Water Strategies.” In Proceedings of the 38th International Symposium of CIB W062 on Water Supply and Drainage for Buildings, Edinburgh, UK, 28 August 2012; pp. 27–30.
- Cheng-Li, C., P. Jr-Jie, H. Ming-Chin, L. Wan-Ju, and S.-J. Chern. 2016. “Evaluation of Water Efficiency in Green Building in Taiwan.” Water 8 (6): 236. doi:10.3390/w8060236.
- Kanako, T., O. Takayuki, and S. Yasutoshi. 2016. “Water Use Patterns in Vietnamese Hotels: Modelling Toilet and Shower Usage.” Water 8 (3): 85. doi:10.3390/w8030085.
- Karpman, M, Wang, N, Eley, C. 2017. Comparative Analysis of ASHRAE Building EQ As-Designed, Building Energy Asset Score, and ASHRAE 90.1 Performance Rating Method, Building Simulation. San Fransico CA,USA 7~9 August 2017.
- Mangsham, L., and T. Berrin. 2012. “Life cycle-based Analysis of Demands and Emissions for Residential water-using Appliances.” Journal of Environmental Management 101: 75–81. doi:10.1016/j.jenvman.2012.02.010.
- Matos, C., A. Briga-Sá, S. Pereira, and A. Silva-Afonso “Water and Energy Consumption in Urban and Rural Households.” In Proceedings of the 38th International Symposium CIB W062 on Water Supply and Drainage for Buildings, Nagano, Japan, 17–19 September 2013; pp. 209–221.
- Minami, O., Y. Ryohei, S. Minoru, K. Masayoshi, T. Kanako, S. Yasutoshi, S. Kyosuke, W. J. Liao, M. C. Lee, and C. L. Cheng. 2015. “Comparison of the Physical Properties of Showers that the Satisfaction of Shower Feeling among Users in Three Asian Countries, Water.” 7: 4161–4174.
- Otani, T., K. Toyosada, and Y. Shimizu. 2015. “CO2 Reduction Potential of Water Saving in Vietnam.” Water 7 (12): 2517–2526. doi:10.3390/w7052516.
- Roulet, C. A., and B. Anderson (2006). “CEN Standards for Implementing the European Directive on the Energy Performance of Buildings.” Proceeding of PLEA 2006 - The 23rd Conference on Passive and Low Energy Architecture, Geneva, Switzerland (pp. 6–8)
- State of Global Climate 2021 “WMO Provisional Report, United Nations World Meteorological Organization, RMetS- General.” https://www.rmets.org/news/wmo-provisional-report-state-global-climate-2021
- Taipei Water Department Statistical Yearbook. 2001-2020. Taipei City: Taipei Water Supplies Department.
- Toyosada, K., Y. Shimizu, S. Dejima, M. Yoshitaka, and K. Sakaue “Evaluation of the Potential of CO2 Emission Reduction Achieved by Using water-efficient Housing Equipment in Dalian, China.” In Proceedings of 38th International Symposium of CIB W062 on Water Supply and Drainage for Buildings, Edinburgh, UK, 28 August 2012; pp. 27–30.
- Wang, N., A. Makhmalbaf, V. Srivastava, and J. E. Hathaway. 2016. “Simulation-based Coefficients for Adjusting Climate Impact on Energy Consumption of Commercial Buildings.” Building Simulation 10 (3): 309–322. doi:10.1007/s12273-016-0332-1.
- Wong, L. T., C. T. Cheung, and K. W. Mui “Energy Efficiency Benchmarks of Example roof-tank Water Supply System for high-rise low-cost Housings in Hong Kong.” In Proceedings of the 38th International Symposium CIB W062 on Water Supply and Drainage for Buildings, Nagano, Japan, 17–19 September 2013; pp. 349–359.
- Wong, L.-T., K.-W. Mui, C.-L. Cheng, and P. Hang-Mei Leung. “Time-variant Positive Air Pressure in Drainage Stacks as A Pathogen Transmission Pathway of COVID-19.” International Journal of Environmental Research and Public Healt 18(11): 6068. 4 June 2021. doi:10.3390/ijerph18116068.
- Yasutoshi, S. 2013. “The Life Cycle CO2 (LCCO2) Evaluation of Retrofits for Water-Saving Fittings.” Water 5 (2): 629–637. doi:10.3390/w5020629.
- Yasutoshi, S., T. Kanako, Y. Mari, and S. Kyosuke. 2012. “Creation of Carbon Credits by Water Saving.” Water 4 (3): 533–544. doi:10.3390/w4030533.
- Yasutoshi, S., D. Satoshi, and T. Kanako. 2013. “CO2 Emission Factor for Rainwater and Reclaimed Water Used in Buildings in Japan.” Water 5 (2): 394–404. doi:10.3390/w5020394.
- Zadeh, S., D. V. L. Hunt, and C. D. F. Rogers. 2014. “Socio-Technological Influences on Future Water Demands.” Water 6 (7): 1961–1984. doi:10.3390/w6071961.