
ABSTRACT
The psychology of people and behavior associated with decision-making can be analyzed by examining their visual attention to products based on the introduction of neuromarketing at the intersection of neuroscience and marketing. This study aims to identify factors affecting consumers’ decision-making on travel products by investigating their preferences and areas of interest via online vacation booking sites. In this experimental study, eye-tracking was measured on 30 male participants in the age of forties, and data on their gazes in response to stimuli were extracted and compared with their choices in the questionnaire survey. The study addresses the following research question: “On what areas of customer preference can visual attention be deemed an influence?” Whether changes to the visual information about spatial products influence product preferences and decision-making was investigated. As a result of analyzing the region of interest in the eye-tracking according to the order of space preference, the preference rate for image 3 (M = 782.65) containing the outdoor space was the highest, followed by furniture and web information. Regarding the initial concentration, among the flow of time, the fastest concentration started at stimuli 2 (4.21s), but the time when concentration increased was at stimuli 3 (16.28s). Visual perception data were analyzed as a verification process for determining the time difference in the concentration of gaze movements according to personal preference. The correlation between the questionnaire survey, reflecting consumers’ conscious preferences, and the data of gaze movements, showing unconscious decision-making, was analyzed.
1. Introduction
Spaces have become commercialized products with online service platforms, and consumers make decisions on these spatial products based on their preferences for the information provided by such online platforms (De Matos, Vieira, and Veiga Citation2012; Sung Citation2004; Yadav, Balaji, and Jebarajakirthy Citation2019). For example, people would get motivations through participating the collaborative consumption, and further loyalty in sharing platforms when social media influencers facilitate interaction between strangers. A travel product website as one of representative online platform, plays an important role for travelers to understand and select the preferred destination at the purchasing stage. When shopping and purchasing, most people refer to the digital information provided by a website rather than directly examining a physical object; whom are considered as a digital consumer. As digital consumerism has increased, so as the quantity of information on traveling or vacations that are provided on websites including details such as locations, prices, interior spaces and exterior views of hotels, shared accommodation, and travel agencies are commercialized and shared (De Matos, Vieira, and Veiga Citation2012; Meilhan Citation2019; Mircică Citation2020).
The visual appeals of websites are becoming more critical for the marketing of space-related products because digital customers tend to evaluate and select a space based on visual information about the accommodation and the surrounding landscape when they decide to purchase on a website. The visual information on online vacation booking sites provides a helpful visual stimulus to identify people’s preferences for and interests in spatial products using a fixed-interface design (Sung Citation2004). It is possible to extract the contextual factors that influence consumers’ decision-making according to the areas of their attention and the time spent (De Matos, Vieira, and Veiga Citation2012; Yadav, Balaji, and Jebarajakirthy Citation2019). Recent research has sought to understand the psychological preferences and intentions, not only of individual consumers but also of groups, and applied the findings to brand marketing. In the online platform economy, consumers value co-creation behavior and make behavioral economics of decision-making while doing collaborative consumption based on the trust of digital platform operations and reputation system (Meilhan Citation2019; Mircică Citation2020; Mirică Citation2019; Popescu and Ciurlău Citation2019). With the introduction of neuroscience into marketing, it has become possible to understand whether digital consumers are affected by the “what” and “where” of their preferred products through their visual attention (Lee, Broderick, and Chamberlain Citation2007; McClure et al. Citation2004; Morin Citation2011). That is, digital consumers’ psychological information, such as preferences and interests, can be expressed unconsciously and investigated through eye-tracking.
This study aims to extract the psychological response of consumers through the scientific research of gaze data concerning product preferences and decision-making from the perspective of visual marketing. The project seeks to ascertain whether neuromarketing can effectively predict customers’ preferences on travel websites. The information about spatial products on the websites was used as a visual stimulus. The research questions were derived by subdividing the information in terms of visual marketing. The research questions are as follows:
From what areas of customer preference can visual attention be derived as an interest?
Do changes to the visual information of spatial products influence preferences and decision-making concerning those products?
Are there time differences in the concentration of gaze movements according to personal preferences?
Visual marketing is related to the factors that are shown to be effective for marketing. For example, even for exceptional space, the expected effect may not emerge if the visual information about the space on the travel website does not present it compellingly. This research explores customers’ responses to the visual stimuli of the travel website. The result made a new proposal for the field of spatial and user behavioral awareness, in that interior space extracted the difference between the user’s concentration area of interest (AOI) and the time-dependent area of interest through the commercialization process.
Following this introduction, this paper reviews the literature on neuromarketing and visual attention with eye-tracking to provide a foundation for the proposed research background. In the method section, the experiment settings and process are described and explained. After the method section, this paper presents the results of a survey and experiment, followed by the discussion section. Then the paper concludes with its implications, contributions, limitations, and future works.
2. Related works
2.1. Neuromarketing applied to customer psychology
Neuromarketing has attracted attention since the adoption of brain – computer interface (BCI) research into marketing, revitalizing the sector by predicting consumer preferences (Boz, Arslan, and Koc Citation2017). An initial neuromarketing study by McClure, Li (McClure et al. Citation2004) on consumer-preferred beverages has not revealed on the control of consumers’ attention and short-term memory by the frontal lobe of the brain that directly influences on the brand consumption; however, since then, many studies have addressed the mutual influence of neuroscience and marketing (Lee, Broderick, and Chamberlain Citation2007; Morin Citation2011). Neuromarketing is an extended concept of neuroculture, in which the knowledge of neuroscience becomes widely disseminated in culture through public interest. Thus, it is possible to recognize the social values and predict consumer behavior in response to literature, movies, artworks, mass media, and commercial products using a neuroscientific approach (Frazzetto and Anker Citation2009; Reisyan Citation2016). Neuroculture is a field that will continue to play an essential role in human lives (Hilgetag and Barbas Citation2009). Although it was thought to be impossible to examine the unconscious disposition of consumers in marketing, neuroscience can grasp this unconscious disposition and is thus increasingly used in social science research and industry (Ariely and Berns Citation2010; Breiter et al. Citation2015; Fisher, Chin, and Klitzman Citation2010; Fugate Citation2007; Kahneman Citation2011). Neuromarketing collects data about consumer preferences by electroencephalography (EEG), facial recognition/a facial coding system (FACS), positron emission tomography (PET), magnetoencephalography (MEG), functional magnetic resonance imaging (fMRI), galvanic skin response (GSR), and heart rate (HR) and eye-tracking (ET).
Gurgu (Gurgu, Gurgu, and Tonis Citation2020) stated that neuromarketing is used to define the needs and emotions arising from the unconscious consumer behavior concerning one another and develop preferred options for determining emotional values. Sebastian (Sebastian Citation2014) argued that neuromarketing provides access to the highest level of psychological value of consumer behavior. Based on the characteristics of visual marketing, the neuromarketing identifies an area of interest by focusing on what consumers visually concentrated on, what aesthetical aspect interests them, what they remember, and how they make decisions and selections. Vences, Díaz-Campo (Vences, Díaz-Campo, and Rosales Citation2020) studied the influence of neuromarketing on the social network, as a tool of emotional connection by investigating how neuromarketing influences decision-making in relationships among consumers. They extracted the sensibility of imitation in public. The results of studies on neuromarketing have indicated the need for recognizing the psychological and emotional values of users.
Although consumers’ reactions are at least 90% unconscious, the neuroscience technology can measure and collect consumers’ unconscious emotions that makes neuromarketing possible (Kahneman Citation2011). An experiment based on the reaction of the unconscious should be conducted in parallel with a questionnaire survey on the emotional response to supplement the limitations of neuroscience in marketing (Fisher, Chin, and Klitzman Citation2010; Frazzetto and Anker Citation2009; Fugate Citation2007). For example, gaze data on customers’ unconscious interests can be obtained through eye-tracking; however, it is not completely certain whether this reveals their psychological states of interest or not. People sometimes focus on an area of the object because they cannot see it well, so their gaze reveals their attempt to see it rather than their interest in it. The goal of all marketing is to encourage customers to make decisions about a particular product. Thus, it is essential to understand the decision-making processes that will enable customers to make purchasing decisions as quickly and efficiently as possible. This requires an understanding of psychology and research on how it works in the human brain (Shapiro et al. Citation1999). The field of neuromarketing utilizes several scientific and effective approaches to psychology. The psychology of consumers who purchase products online in the digital age can be identified by measuring their preferences and predicting processes using the scientific tools of neuroscience.
2.2. Eye -tracking and visual attention
Visual attention is about psychological interest and is a key research area tracked by eye-tracking in marketing (Pieters and Wedel Citation2004; Wedel et al. Citation2008). In marketing, the influence of the personal factor (top-down) and the influence of the stimulus factor (bottom-up) lead to down-stream communication in the factors of visual – spatial attention, and eye-tracking research, which uses eye -tracking as an index, has played an important role in extracting these two critical factors of marketing (Bundesen Citation1990; Duchowski Citation2007; Wedel et al. Citation2008). Determinants of attention to visual marketing stimuli are reflected in eye-tracking and the influence of communication effects on the direct interest in marketing, as shown by memory, preference, and choice, can be explained. In other words, eye-tracking in the theory of visual attention distinguishes the top-down effect on attention from the consumers’ existing states, such as their expectations, goals, and emotions, and the bottom-up effect on attention from those characteristics produced in the consumers by the stimulus. More than 90% of all perceptual information encountered, and not limited to visual stimuli, is unconsciously processed by the human brain (Agarwal and Dutta Citation2015; Zurawicki Citation2010), and this processing plays an essential role in consumer decision-making (Fisher, Chin, and Klitzman Citation2010; Lee, Broderick, and Chamberlain Citation2007; Pieters and Wedel Citation2004).
In terms of the visual mechanism, when a specific position or object is selected through attention, processing, whereby other positions and objects that are not selected are automatically suppressed, is performed. This theory concerns attention determinants that independently obtain discriminatory information about specific stimuli related to visual marketing effects. The eye-tracking method is one of the main methods used in neuromarketing, whereby visual attention can be quantified by monitoring where people visually observe the stimuli (Bundesen Citation1990; Gurgu, Gurgu, and Tonis Citation2020; Vences, Díaz-Campo, and Rosales Citation2020; Wedel et al. Citation2008). Eye-tracking consists of fixation and saccades. Fixation is the practice of gazing at any one place, and saccades refer to the act of continuously moving one’s gaze over a certain distance. Scanpaths or saccades can display an entire sequence of gazes and describe eye-movement patterns in a visual scene or material. Scanpaths are used to measure visual perception, cognitive intent, interest, and salience. Customers’ habits in web browsing can be analyzed through scanpaths or saccades (Francuz et al. Citation2018).
Zamani, Abas (Zamani, Abas, and Amin Citation2016) studied how human visual attention affects product preferences by linking cognitive science on human decision-making to the eye-tracking method. Josephson and Holmes (Josephson and Holmes Citation2002) used web pages as visual stimuli to connect visual perceptions and sequences of memory in the scanpath. In a study by (López and García Citation2018), the visually appealing elements to digital consumers in the main images of a web page were measured. Visual attention can be determined either voluntarily or involuntarily, moreover Duchowski (Duchowski Citation2007) provided an evidence for visual attention by relating the mind’s attention to the theories of the “what” (James Citation2007) and “where” (Von Helmholtz and Southall Citation1925) of visual mechanisms.
The eye-tracking of the fixation of a person’s pupil can extract quantitative data on where the person is looking, so it is possible to study the visual perception response to preferences through analysis of where the gaze is directed (Duchowski Citation2007). In terms of marketing spatial products, the attention of the gaze is selectively reflected by its movement in the prioritized areas. Updating the knowledge of fixation priorities and long-term memory contributes to interesting downstream marketing effects, such as learning (memory), preference formation, and selection (Wedel et al. Citation2008). Kim and Kim (Kim and Kim Citation2012) analyzed the initial concentration and maximum concentration times of experimental participants with fixation frequency and dwell time and studied the difference in visual perceptions using fixation difference. Frequency is connoted by the number of clusters of fixation and saccades, and each frequency is derived from the individual gaze data included in each cluster (Kim and Kim Citation2020). Kim and Kim (Kim and Kim Citation2019) indicated the sequence in the AOI in which the participants stared at an object of interest in space, tracking the entry time until the first gaze fixation, which occurred after the spatial stimulus was presented to the subject, and the dwell time; each was recorded as time units and ratios of gaze fixation in the AOI. By analyzing the gaze data extracted from the AOI, on which attention was concentrated in space, it was possible to grasp the gaze change according to frequency and time. The AOI can be established according to an analysis of the experimental stimuli. The total and average fixations are extracted from this range and depending on the saccade of the gaze. The revisit is extracted to determine whether the gaze has been re-focused in the specified range and to establish the target of interest and preference.
3. Research methods and process
In this study, the visual preference for space in digital consumption purchase was investigated focusing on the following three variables: What participants see and are interested in; Visual characteristics according to the participant’s personal preference (viewing time, area, etc.); and Classified by the participant’s attentional characteristics.
3.1. Visual stimuli
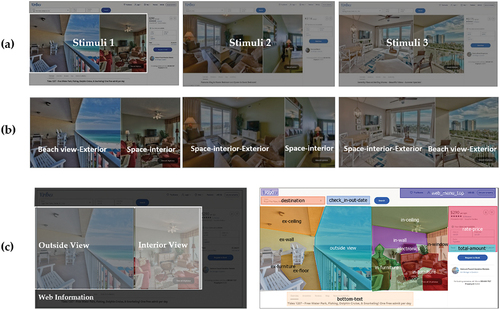
The experiment was constructed by selecting visual stimuli, which were differentiated to allow for preference. For the visual stimuli, vacation packages were selected from travel websites, on which people rented properties located on the beach, to discover the influences on their preferences or interests, which informed their decisions. Firstly, the experimental setting was divided into three categories by spatial characteristics, including whether the space is outdoor or indoor, whether it has direct visual accessibility to external environment and whether it provides the beach standalone view or combined city and beach view from the internal space. Three different prices were assigned to the three stimuli because different prices are generally provided for spaces when selling holiday destinations; price is a critical decision-making factor when selecting a space. A visual stimulus centered on the exterior landscape and a visual stimulus centered on urban buildings were distinguished and presented as visual stimuli so that the spatial disposition on the website that was most likely to result in a preference could be identified. The AOI of the visual stimuli were different images, consisting of interior and exterior pictures. For example, when people examine a space, some value the interior more and the others value the scenery, even if the space is indoors; then, some consider whether they can enjoy not only a sea view but also the convenience of the city. In other words, when people choose a space for a holiday destination, it is important to observe where they choose when examining preferences for spaces in marketing.
There were three visual stimuli (see ): Visual Stimulus 1 comprised a space centered on a beach view from an external balcony (beach view – exterior) and a shot of the interior accommodation (space – interior); Visual Stimulus 2 comprised a space from which the outside beach could be seen through the front window of the indoor space (beach view – exterior) and a shot of the interior accommodation (space – interior); and Visual Stimulus 3 comprised a space from which the outside beach view could be seen from the interior accommodation space (space interior – exterior) and a landscape in which the beach could be viewed together with the buildings and the sculptures on the outside balcony (beach view – exterior; see ). The rental prices were $290 per night for Visual Stimulus 1, $114 per night for Visual Stimulus 2, and $175 per night for Visual Stimulus 3. Visual Stimulus 1 was the most expensive to rent. There was no bias induced by the price in the interpretation of the spatial products via the visual stimuli because the price was determined reasonably according to the quality of each spaces’ products.
Figure 1. Visual stimuli and AOI: (a) Three visual stimuli; (b) Features of spaces in AOI settings; (c) Categorizing AOI (spaces) as interior, exterior, or outside view, according to AOI, and naming several areas in AOI (web information).
3.2. Experiment procedure and participants
Participants who were healthy, were in their forties and had normal or corrected normal vision were recruited online. This research refers to the ethnic guidelines for conducting experiments. This experiment was approved by the ethics committee of Soongsil University, and the participants signed a consent form prior to the experiment after they had understood it. The participants comprised of 30 males in their age of forties with a visual acuity of 0.5 or higher, and the average age was 43.31 years old (standard deviation: ±8.47). Since this study was not interested in differences of gender or age, and to remove the influence of the personal factor, the participants’ general characteristics (gender and age) were matched similarly. Participants were recruited through advertisement for conducting experiments.
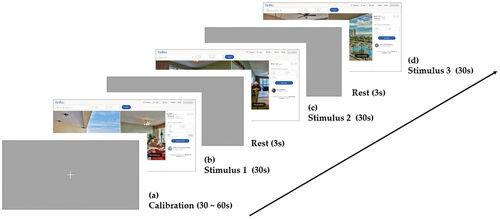
Two preliminary experiments were conducted before the main experiment, for which the ages of the participants and the content of the questionnaires were determined. The experiments were conducted with 28 participants. During the experiment, each participant received a task brief, and the equipment (SM-REDn, 30 Hz) was calibrated to maintain a distance of 650 mm between the participant’s eyes and the monitor and to record any changes. To create visual attention, the following phrase was shown to the participants: “You want to book a seaside hotel in a foreign country for your summer vacation. Please choose a hotel you like.” When the participants directed their gazes toward a specific point on the monitor, as an expression that they had read and understood the phrase, the monitor was set to move to the next setting, presenting the visual stimuli on the screen in order. Each visual stimulus was presented for 30 seconds, then a break time of about three seconds was given between each stimulus; thus, visual attention was applied to the experimental stimuli for a total of two minutes and ten seconds. The order of visual stimuli provided to participants was random. After the experiment, a survey was conducted to ascertain the preferences for the experimental stimuli (see ).
Figure 2. Experimental procedures: (a) a focus adjustment stage for extracting the participant’s gaze data, which took approximately 30 to 60 seconds as a response to the difference in gaze correction for each participant; (b) Visual Stimulus 1; (c) Visual Stimulus 2; (d) Visual Stimulus 3. The three stimuli were presented for 30 seconds, each with a three-second break time between stimuli.
4. Results
This study compared the qualitative survey and quantitative gaze data analysis. For the gaze data, the group and individual data of the participants were verified through effective rate verification and statistical average comparison.
4.1. Survey on preferred spaces and areas of interest
A cross table of the questionnaire data selected around the preferred image and the AOI was calculated to verify the difference in the ratio of the preferred areas between the visual stimuli. A result of the chi-square test allows to determine the statistical significance of the difference between the visual stimuli and no significant difference was found in the questionnaire data concerning the visual stimuli in relation to the preferred space and the AOI. In terms of the differences in the ratios of the frequency of each preferred space and the AOI, it was found that the outside view had a significant influence on the preferences when considering the stimuli centered on the preferred space and the AOI.
In the selection centered on the preferred space image, there was a similar response, with 13 preferences (50.0%) for Visual Stimulus 1, and 12 (46.2%) for Visual Stimulus 3, in which the outside view was surveyed as having the highest number of preferences. Among the preferred areas, it was found that the floor received two responses (50.0%) in Visual Stimulus 1, one (25.0%) in Visual Stimulus 2, and one (25.0%) in Visual Stimulus 3, whereas the ceiling received one (100.0%) only in Visual Stimulus 1. As for the outside view, there were five responses (38.5%) for Visual Stimulus 1 and eight (61.5%) for Visual Stimulus 3 (see ).
Table 1. Differences in the ratios of the selection responses centered on preferred space images.
In the verification of differences in the selection ratios of the visual stimuli according to the AOI, the results show a similar response for the AOI, with 12 responses (46.2%) for Visual Stimulus 1, and 13 (50.0%) for Visual Stimulus 3. For the AOI, the highest ratio was found in the outside view, with four responses (43.8%) for Visual Stimulus 1, and nine (56.3%) for Visual Stimulus 3. For furniture, three responses (50%) were found for Visual Stimulus 1, and two (33.3%) for Visual Stimulus 3. When participants examined the visual stimuli for the AOI, the outside view had the greatest influence, followed by the furniture. Participants were least interested in the web information since there was no selection response to the web data in either Visual Stimulus 1 or Visual Stimulus 2, and there was only one selection response in Visual Stimulus 3 (see ).
Table 2. Differences in the ratios of the selection responses centered on the AOI.
By simplifying the subdivided areas of the visual stimulus into three areas – outside view, interior, and web information – the response rates were compared in terms of the spaces, comprising the exterior landscape (outside view); the interior space, including furniture or objects (interior); and the web information. The selection responses for the areas centered on the preferred images (see ) and the selection responses concentrating on the AOI (see ) are as follows. In terms of the response frequency, the highest response was to the preference for Visual Stimulus 3. As for the response for the AOI, interests in visual stimuli differed according to the three subdivided areas. Unlike the other visual stimuli, Visual Stimulus 3 showed the view of the beach from the indoor accommodation space through the external balcony, and for Visual Stimulus 3, there was a high response rate to the outside view in the questionnaire about preferences and AOI. In the response to the interior, there was a difference between the preference and the AOI in Visual Stimulus 1. In terms of preference, the ratio of selection was influenced by the external area. However, in terms of the AOI, the interest in the external area was significant only in Visual Stimulus 3 in responses centered on selection; in other visual stimuli, the ratio of selection by the interior space was higher than that by the external area. Unlike those for Visual Stimulus 1 and Visual Stimulus 2, Visual Stimulus 3 provoked a higher response rate to the web information. The rental prices were $290, $114, and $175, in the order of visual stimulus, and it seems that the related web information was also checked since there was a strong interest in the spaces in Visual Stimulus 3. There was a low response rate in both questionnaires for preference and AOI in the web information area. This result implies that the outside view has a greater influence than the text in determining people’s preferences for places.
Figure 3. Selection response for AOI in visual stimulus: (a) Response when viewing a visual stimulus centered on a preferred image, (b) Response when viewing a visual stimulus centered on the AOI.
The results for the first research question – whether the customer preference is reflected in AOI as visual attention, are shown below. After the experiment, participants consciously checked their AOIs and preferences for the experimental stimuli through a questionnaire survey. The participants showed high levels of interest in the outside view of Stimulus 3, in terms of the results verified by the ratio difference centered on the preferred space in the questionnaire, and the ratio of responses through image selection of the AOI. In Stimulus 2, in which the outside view could be seen through an opening in the indoor space, the participants’ interest in the outside view was the lowest. To establish whether the price of the spatial products affected the decision-making, the responses were divided into the interior, the outside view, and the web information (price); the participants showed a high rate of interest in the outside view of Stimulus 3.
4.2. Collecting gaze data and extracting the validity rate
4.2.1. Validity of gaze data
After analyzing the validity of the gaze data, the validity rates were 96% (standard deviation (SD) = 3.34) for Visual Stimulus 1, 90.38% (SD = 19.26) for Visual Stimulus 2, and 94.30% (SD = 7.42) for Visual Stimulus 3.
The gaze data of 26 participants were analyzed with a total validity rate of 93.6%, excluding the data indicating the error value. The SD value of Visual Stimulus 2 was high, indicating that differences in gaze data for this stimulus were significant (see ).
Table 3. Participant eye-tracking ratio.
4.2.2. Means and standard deviation of the gaze data
Through the eye-tracking method, the values of gaze fixation, gaze saccade, and gaze blink were extracted from the raw data. The gaze fixation data includes all values and classified values, such as raw data, and the value obtained by the order of the gaze fixation extracted from 0.03 milliseconds is designated as the count. The number of fixations per count was recorded according to the degree of interest as revealed by the gaze fixation. Frequency is the value of the gaze fixation time recorded, on average, for one second, and established by dividing the raw data by the count. In the eye-tracking data, the values of the mean and frequency for fixation and saccade did not differ significantly across the visual stimuli, but for the blink, the values of the mean and frequency are significantly different for Visual Stimulus 2. In addition, there was no difference between the overall means for the visual stimuli. In Visual Stimulus 3, which received strong preference in the survey, the averages for the fixation frequency and the number of counts were high (see ).
Table 4. Average count and frequency of eye-tracking data.
4.3. AOI and the analysis of gaze data
4.3.1. Average of gaze data according to AOI
The length of participants’ visits was analyzed using the mean value and SD according to the AOI in the gaze data (see ). The entry time average for Visual Stimulus 1 (beach view – exterior) was 0.58 seconds, for Visual Stimulus 2 (space interior – exterior) it was 0.33 seconds, and for Visual Stimulus 3 (beach view – exterior) it was 0.18 seconds. The gaze was found to commence at the seaside landscape in each visual stimulus, whereas the web information areas were viewed later, with an average entry time for the web information of 1.94 seconds in Visual Stimulus 1, 3.38 seconds for Visual Stimulus 2, and 4.58 seconds for Visual Stimulus 3. As found in the questionnaire for the preferred image, the SD was small, and the gaze commenced in the “beach view – exterior” area of Visual Stimulus 3. In terms of the average dwelling time, which showed the AOI where the participants’ eyes remained on average, priority was given to the web information in Visual Stimulus 1, to the space interior – exterior in Visual Stimulus 2, and to the beach view – exterior in Visual Stimulus 3.
Table 5. Average of gaze data over time according to AOI.
4.3.2. Relative gaze changes in AOI according to time series
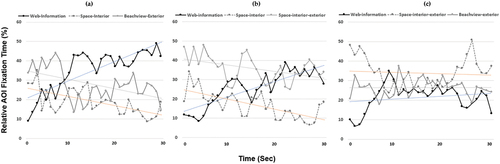
As time passed, the gaze toward the exterior area decreased and the gaze toward the web information increased in Visual Stimulus 1 and Visual Stimulus 2. Unlike for the other visual stimuli, the gaze did not show a significant decrease or increase in response to either the space or web information areas in Visual Stimulus 3. During the first period (0 to 10 s), all three visual stimuli showed a strong gaze ratio in areas that included an external landscape. In the case of Visual Stimulus 3, which received significant preference, the area including the beach, viewed through the exterior balcony from the indoor space, showed a large ratio, even in the latter period (20–30 s). During the initial period (20–30 s), participants’ gazes were increased towards the web information in Visual Stimulus 1, and to the web information and the space, including the external landscapes, in Visual Stimulus 2 (see ).
Figure 4. Relative ratio of gaze data in the AOI over time: (a) Changes in AOI in Visual Stimulus 1, (b) Changes in AOI in Visual Stimulus 2, (c) Changes in AOI in Visual Stimulus 3.
4.4. AOI and response times for concentration
4.4.1. Extracting the average times for initial and maximum concentration
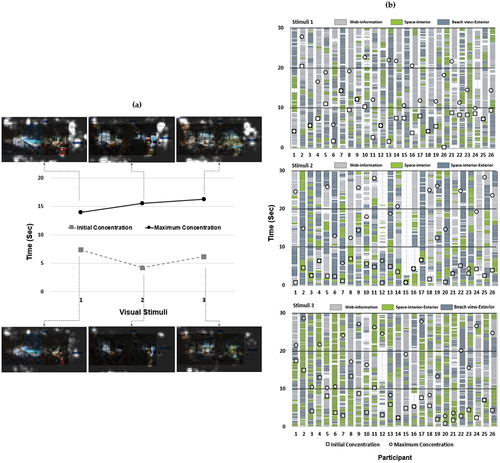
The time spent on attention was extracted according to the ratio of the gaze, implying the decision-making concerning preference and interest. The time, starting at 5% of the upper index value, when the highest fixation value occurred after each subject had started the experiment, was defined as the initial concentration time; further, the index value, comprising the highest number of fixation values, was defined as the maximum concentration level for the focused attention. To derive participants’ courses of concentration over time, the processes of initial and maximum concentration were analyzed to establish how, when, and in what area consumers viewed the spatial products during the purchasing process according to their interests and preferences in the unconscious process of imbibing product information. In terms of initial concentration, attention began earliest in Visual Stimulus 2 (4.21 s), followed by Visual Stimulus 3 (6.16 s), and then Visual Stimulus 1 (7.37 s). The maximum concentration time was found in response to Visual Stimulus 1 (13.96 s), followed by Visual Stimulus 2 (15.52 s), and Visual Stimulus 3 (16.28 s). At the initial concentration time, the gaze movement was seen in the spatial areas; however, gaze movement in the web information area was witnessed during the period of maximum concentration (see ). It was not possible to evaluate whether an image was preferred or an AOI by whether the average time of concentration was fast or slow. For example, during the average time of initial concentration (5.91 s), the participants focused on the exterior view of each visual stimulus. During the average time of strong concentration (15.25 s), the participants watched the external stimuli in Visual Stimulus 2 and Visual Stimulus 3, but they viewed the web information in Stimulus 1 (see ). As shown in , the average time of concentration and each participant’s concentration level differed according to the contents of the AOI comprising the visual stimulus. This result suggests that when the concentration time is extracted, there is a need to identify what the participants see in the AOI, as their interests influence their decisions. In addition, it is necessary to compare the average concentration and the characteristics of decisions based on personal data with the areas of interest consciously selected in the questionnaire.
Figure 5. AOI according to the concentration time: (a) Average concentration time for all participants (n = 26), (b) Distribution of initial and maximum concentration response times for AOI in visual stimulus.
As a result, although selections for the outside view and Stimulus 3 were derived from the survey, the results should be considered in terms of the levels of concentration observed through the contrast between gaze data and time in the experiments. Through the distribution of the concentration reaction times, it is possible to extract and analyze processes scientifically, such as the time taken for the customers’ purchasing decisions and where they paid attention to the decision. In the gaze data, the fixation value for the outside view was high, and Stimulus 1 received strong attention during the initial period of concentration, but Stimulus 3 showed the highest level of preference at the point of maximum concentration. Through the time series analysis of the eye-tracking data, it was found that changes in information elements (the interior, outside view, and web information) in spatial visualization affect decision-making for product preferences. In addition, it was possible to analyze what factors changed the decision-making during the process.
4.4.2. Locations of the AOI according to the concentration time
For the visual stimulus, the average initial concentration time was 5.91 seconds, and the maximum concentration time was 15.25 seconds. In the overall average, it was confirmed that the gaze shifted gradually from its initial concentration on spatial areas to the entire area. For each participant’s characteristics, the visual data were analyzed to record an individual initial concentration response time (see ) and a maximum concentration response time (see ). Through this, it was possible to classify the groups according to the characteristics of the visual reactions and to analyze the characteristics of the visual movements as detailed evaluation values. For the initial concentration on visual stimuli, on average, the fastest participant (Participant #20, 0.63 s) and the slowest participant (Participant #2, 13.27 s) were classified and their AOI were extracted. The slowest participant (Participant #2, 23.74 s) and the fastest participant (Participant #3, 6.17 s) were also distinguished in terms of maximum concentration. Participant #2 was rated as the slowest participant in terms of both initial and maximum concentration. Accordingly, the gaze positions of the AOI were extracted according to the concentration time of these three participants (see ).
Figure 6. AOI and the concentration time: (a) Individual participants’ initial concentration on visual stimuli, (b) Individual participants’ maximum concentration on visual stimuli, (c) Location of the AOI according to the characteristics of the average response times.
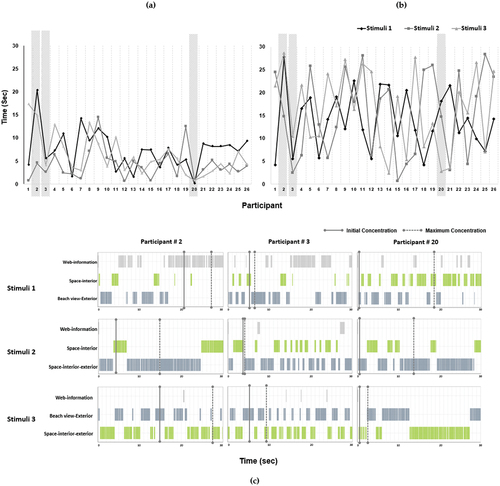
It was evident from three participants that the gaze movement was average for the web information area in Visual Stimulus 1, but in Visual Stimulus 2 and Visual Stimulus 3, the gaze movement was significant in response to the external beach views or space views, and insignificant for the web information. Participant #2 had the slowest concentration response time and Participant #2’s gaze distribution in the AOI implied that the space for viewing the area had been divided according to each visual stimulus. The characteristic of the participant’s gaze, as initially concentrated, was that it was distributed evenly around the spaces (see ).
Neuromarketing is more effective in understanding the psychological characteristics of the purchase decision process for an individual or group products than the information on the average consumer’s product purchase decision process. For the third research question, it was analyzed whether there was a time difference in concentration depending on the type of individual preference. As a result of analyzing the data of three participants who showed a difference in preference in the overall average data, it was possible to distinguish the characteristics of spatial preference and concentration even by looking at the data of gaze movement. Participants whose initial and maximum concentrations were slower than those of the data averages showed lower concentration for the stimulus information elements (space – interior, beach view – exterior, and web information) and a higher preference for Stimulus 1. As a result, the process of interest informing the customer preferences was able to be derived from the gaze data. Following the time sequence, it was possible to identify the time of concentration in the process of interest.
5. Discussion and conclusion
This study aims to identify the user’s preference and decision-making process through 3D real space in the field where image of space is commercialized through the web information (vacation rental, house sharing, hotel, etc.) according to users’ gaze behavior. In this study, the participants’ responses were analyzed by differentiating the attention derived from consumer characteristics, such as individual customer expectations, goals, and emotions. This was achieved by inferring the manner of visual attention; for example, when considering the visual stimulus for preference, visual attention was given to the detailed elements of the space and the text of the web information – as the contextual factors of the web image – and strong responses were found in all AOI of the preferred image. However, when the viewed images centered on the AOI in the visual stimulus, the response to the interior spaces differed from the response to the preference. Differences in the AOI elements were identified in verifying the selection response ratio difference, centering on the preferred space image and the analysis of the AOI. In response to the AOI, it was found that the most critical factors were observed centering on the area. The main contextual factors in the visual stimulus were identified as the outside view and the furniture in the interior space.
The investigation of conscious selection through the questionnaire was limited in grasping the critical factors in actual consumer decision-making. This was confirmed in the gaze data of visual stimulus through the analysis of preferences and interests that play an important role in consumer decision-making in response to unconsciously processed information (Fisher, Chin, and Klitzman Citation2010). As for the gaze movement on the preferred image, it was identified that the fixation ratio for web information was low during the introduction period, and the interest in the spaces of the main image was intense. The visual mechanism for the preferred stimulus could be described as the effect of selection and automatic suppression through attention at a specific location. It was verified that the attention of the gaze movement can be extrapolated by measuring the duration of the subject’s interest. The time distribution of the concentration response was identified for each participant. In the initial concentration, there was no significant difference between Visual Stimulus 1 and Visual Stimulus 3, but in the maximum concentration, the attention commenced with Visual Stimulus 1 and progressed to Visual Stimulus 3 in the second half. This suggests that duration of the gaze concentration in Visual Stimulus 3 continued until the end of the experiment. Based on the individual’s visual – spatial attention, there were participants who exhibited concentration and selection interest at the beginning, and one participant who displayed a significant difference between the initial and the maximum concentration times. It was inferred that the stimulus factor and the personal factor, as indicated by the preferences of individuals, were combined to result in the time spent concentrating on a certain stimulus.
The significance of this study is that it contributes to the adoption of neuroscience in marketing for spatial products on online platforms by exploring how consumers’ minds can be monitored, as emphasized in neuromarketing. As researchers have argued, consumer responses to specific products, which influence decision-making, are generated by processing that is more than 90% unconscious; thus, the role of neuroscience has been increased in visual marketing, leading to the development of neuromarketing. The user’s preference process was extracted through a neuroscientific method and analyzed as a process of their visual attention in terms of visual marketing for space. However, it is not entirely clear that the user’s gaze data reveal their interest in the area, because people sometimes gaze to attain a clear vision on it. This research could be elaborated in terms of the analysis method of eye-tracking experiment data.
The space created from the designer’s point of view should be fully understood and conveyed to consumers in terms of the given sense of place and connection characteristics. In particular, by presenting digital technology-combined VR or synesthesia characteristics to digital consumers, even if they do not visit the space themselves, the experience elements should be applied to the user’s perception. In this era where real and digital spaces are mixed, designers need to specifically understand the visual context experienced by individuals through the eyes of consumers regarding various factors related to space.
In the future study, data analysis and extraction such as revisit sequences and pupil diameter can be expanded to a technique that can define the user’s behavior and interpret the characteristics of cognition in detail. It would be helpful to supplement the characteristics of each group according to the distinction of the personal factors.
Disclosure statement
No potential conflict of interest was reported by the author(s).
Additional information
Funding
Notes on contributors
Ju Yeon Kim
Ju Yeon Kim is a professor at the School of Architecture at Soongsil University in Korea. She earned her Ph.D. in Housing and Interior Design from Yonsei University after completing her MFA at NYSID in NY. Her primary research interest lies in comprehending human behavior by extracting users' visual perception and preference information from their environment. Kim was honored with the Design and Planning Award from the Korea Ministry of Culture, Sports, and Tourism for a project focusing on elementary school design. Before joining the faculty at Soongsil University, Kim directed the In-Between Wall Design Lab. She also gained experience at architectural firms including Steven-Kratchman Architect (NY) and Yves-Claude Design (NY), as well as at Samsung Electronics.
Mi Jeong Kim
Mi Jeong Kim is a professor of the School of Architecture at Hanyang University in Korea. She received her Ph.D. in the Key Centre of Design Computing and Cognition at the University of Sydney and worked as a postdoc fellow at UC Berkeley before joining Kyung Hee University. She was previously a visiting fellow at NYU, MIT, and Curtin University. She is an Editor-in-Chief of the Journal of the Korean Institute of Interior Design and on the editorial board of the International Journal of Architectural Research. Her research interest includes sensing architecture, human-building interaction, design education & strategies for creativity, smart, homes, and communities.
References
- Agarwal, S., and T. Dutta. 2015. “Neuromarketing and Consumer Neuroscience: Current Understanding and the Way Forward.” Decision 42 (4): 457–26. https://doi.org/10.1007/s40622-015-0113-1.
- Ariely, D., and G. S. Berns. 2010. “Neuromarketing: The Hope and Hype of Neuroimaging in Business. Nature Reviews Neuroscience.” Nature Reviews Neuroscience 11 (4): 284–292. https://doi.org/10.1038/nrn2795.
- Boz, H., A. Arslan, and E. Koc. 2017. “Neuromarketing Aspect of Tourısm Pricing Psychology.” Tourism Management Perspectives 23:119–128. https://doi.org/10.1016/j.tmp.2017.06.002.
- Breiter, H. C., Block M, Blood AJ, Calder B, Chamberlain L, Lee N, Livengood S, Mulhern FJ, Raman K, Schultz D, Stern DB. 2015. “Redefining Neuromarketing as an Integrated Science of Influence.” Frontiers in Human Neuroscience 8 (1073). https://doi.org/10.3389/fnhum.2014.01073.
- Bundesen, C. 1990. “A Theory of Visual Attention.” Psychological Review 97 (4): 523. https://doi.org/10.1037/0033-295X.97.4.523.
- De Matos, C. A., V. A. Vieira, and R. T. Veiga. 2012. “Behavioural Responses to Service Encounter Involving Failure and Recovery: The Influence of Contextual Factors.” The Service Industries Journal 32 (14): 2203–2217. https://doi.org/10.1080/02642069.2011.582497.
- Duchowski, A. T. 2007. “Eye Tracking Methodology.” Theory and Practice 328 (614): 2–3.
- Fisher, C. E., L. Chin, and R. Klitzman. 2010. “Defining Neuromarketing: Practices and Professional Challenges. Harvard Review of Psychiatry.” Harvard Review of Psychiatry 18 (4): 230–237. https://doi.org/10.3109/10673229.2010.496623.
- Francuz, P., I. Zaniewski, P. Augustynowicz, N. Kopiś, and T. Jankowski. 2018. “Eye Movement Correlates of Expertise in Visual Arts. Frontiers in Human Neuroscience.” 12:87. https://doi.org/10.3389/fnhum.2018.00087.
- Frazzetto, G., and S. Anker. 2009. “Neuroculture.” Nature Reviews 10 (11): 815–821. https://doi.org/10.1038/nrn2736.
- Fugate, D. L. 2007. “Neuromarketing: A Layman’s Look at Neuroscience and Its Potential Application to Marketing Practice.” Journal of Consumer Marketing. https://doi.org/10.1108/07363760710834807.
- Gurgu, E., I.-A. Gurgu, and R. B. M. Tonis. 2020. “Neuromarketing for a Better Understanding of Consumer Needs and Emotions.” Independent Journal of Management & Production 11 (1): 208–235. https://doi.org/10.14807/ijmp.v11i1.993.
- Hilgetag, C. C., and H. Barbas. 2009. “Sculpting the Brain.” Scientific American 300 (2): 66–71. https://doi.org/10.1038/scientificamerican0209-66.
- James, W. 2007. The Principles of Psychology. Vol. 1. New York: Dover. (Original work published 1890).
- Josephson, S. and M. E. Holmes. 2002. Visual Attention to Repeated Internet Images: Testing the Scanpath Theory on the World Wide Web. In Proceedings of the Eye tracking research & applications Symposium, ETRA 2002, New Orleans, Louisiana, USA, 43–49.
- Kahneman, D. 2011. Thinking, Fast and Slow. New York: Farrar, Straus and Giroux.
- Kim, J. H., and J. H. Kim. 2012. “The Partitioning Standard of Observation Scope for Analysis of Spatial Image.” Korean Society of Basic Design & Art 13 (2): 159–168.
- Kim, J. J., and J. Y. Kim. 2020. “Fixation Differences in Spatial Visual Perception During Multi-Sensory Stimulation.” Frontiers in Psychology 11:132. https://doi.org/10.3389/fpsyg.2020.00132.
- Kim, J. Y., and D. H. Kim. 2019. “A Study on the Relationship Between Visual Perception and Preference Information for VMD Component.” Korean Institute of Interior Design Journal 28 (5): 70–78. https://doi.org/10.14774/JKIID.2019.28.5.070.
- Lee, N., A. J. Broderick, and L. Chamberlain. 2007. “What is ‘Neuromarketing’? A Discussion and Agenda for Future Research.” International Journal of Psychophysiology 63 (2): 199–204. https://doi.org/10.1016/j.ijpsycho.2006.03.007.
- López, M. A., and G. S. García. 2018. “Perceived Visual Appeal of Web Pages by Eye Tracking: Case Study in NH and Barceló Hotels in Women.” Esic Market Economics and Business Journal 49 (2): 379–404.
- McClure, S. M., Li J, Tomlin D, Cypert KS, Montague LM, Montague PR. 2004. “Neural Correlates of Behavioral Preference for Culturally Familiar Drinks.” Neuron 44 (2): 379–387. https://doi.org/10.1016/j.neuron.2004.09.019.
- Meilhan, D. 2019. “Customer Value Co-Creation Behavior in the Online Platform Economy.” Journal of Self-Governance and Management Economics 7 (1): 19–24.
- Mircică, N. 2020. “Restoring Public Trust in Digital Platform Operations: Machine Learning Algorithmic Structuring of Social Media Content.” Review of Contemporary Philosophy 19 (0): 85–91. https://doi.org/10.22381/RCP1920209.
- Mirică, C.-O. 2019. “The Behavioral Economics of Decision Making: Explaining Consumer Choice in Terms of Neural Events.” Economics, Management, & Financial Markets 14 (1): 16–20.
- Morin, C. 2011. “Neuromarketing: The New Science of Consumer Behavior.” Society 48 (2): 131–135. https://doi.org/10.1007/s12115-010-9408-1.
- Pieters, R., and M. Wedel. 2004. “Attention Capture and Transfer in Advertising: Brand, Pictorial, and Text-Size Effects.” Journal of Marketing 68 (2): 36–50. https://doi.org/10.1509/jmkg.68.2.36.27794.
- Popescu, G. H., and F. C. Ciurlău. 2019. “Making Decisions in Collaborative Consumption: Digital Trust and Reputation Systems in the Sharing Economy.” Journal of Self-Governance and Management Economics 7 (1): 7–12.
- Reisyan, G. D. 2016. Neuroculture, in Neuro-Organizational Culture, 167–243. Springer International Publishing. https://doi.org/10.1007/978-3-319-22147-2_4.
- Sebastian, V. 2014. “Neuromarketing and Evaluation of Cognitive and Emotional Responses of Consumers to Marketing Stimuli.” Procedia-Social & Behavioral Sciences 127:753–757. https://doi.org/10.1016/j.sbspro.2014.03.349.
- Shapiro, S., MacInnis DJ, Heckler SE, Perez AM. 1999. “An Experimental Method for Studying Unconscious Perception in a Marketing Context.” Psychology & Marketing 16 (6): 459–477. https://doi.org/10.1002/(SICI)1520-6793(199909)16:6<459:AID-MAR2>3.0.CO;2-2.
- Sung, H. H. 2004. “Classification of Adventure Travelers: Behavior, Decision Making, and Target Markets.” Journal of Travel Research 42 (4): 343–356. https://doi.org/10.1177/0047287504263028.
- Vences, N. A., J. Díaz-Campo, and D. F. G. Rosales. 2020. “Neuromarketing as an Emotional Connection Tool Between Organizations and Audiences in Social Networks.” A Theoretical Review: Frontiers in Psychology 11 (1787): 11. https://doi.org/10.3389/fpsyg.2020.01787.
- Von Helmholtz, H., and J. P. C. Southall. 1925. Treatise on Physiological Optics: Translated from the 3rd German Ed. Optical Society of America. https://doi.org/10.1037/13536-000.
- Wedel, M., R. Pieters, M. Wedel, and R. Pieters. 2008. Eye Tracking for Visual Marketing. Now Publishers Inc. https://doi.org/10.4324/9780203809617.
- Yadav, R., M. Balaji, and C. Jebarajakirthy. 2019. “How Psychological and Contextual Factors Contribute to travelers’ Propensity to Choose Green Hotels?” International Journal of Hospitality Management 77:385–395. https://doi.org/10.1016/j.ijhm.2018.08.002.
- Zamani, H., A. Abas, and M. Amin. 2016. “Eye Tracking Application on Emotion Analysis for Marketing Strategy.” Journal of Telecommunication, Electronic and Computer Engineering (JTEC) 8 (11): 87–91.
- Zurawicki, L. 2010. Neuromarketing: Exploring the Brain of the Consumer. Springer Science & Business Media. https://doi.org/10.1007/978-3-540-77829-5.