
ABSTRACT
The protection and balance of visibility and the visual interface of urban historic landmarks has been widely regarded in urban development and expansion. Taking Tiger Hill in Suzhou, China as an example, this study evaluates its visual characteristic from two perspectives: view and viewing. From the “view” perspective, changes in visibility as a viewing object are compared by cumulative viewshed analysis in ArcGIS. Additionally, a visual preference questionnaire is applied to determine the threshold (1.2 km) at which Tiger Hill becomes an object of attention. Based on the urban green space system planning map of Suzhou, the study selects green spaces that offer suitable viewing conditions. From the “viewing” perspective, Tiger Hill is considered a viewpoint for climbing and viewing, and a 3D city model is used to compare the changes in the visual interface of the mountains in the south and west of Suzhou from the top of Tiger Hill. Lastly, based on the “Two-thirds Rule”, the study calculates the maximum allowable building height within the field of vision and compares it with the existing building heights. The research provides a reference for the evaluation and improvement of the visual quality of urban historic landmarks.
1. Introduction
Urbanization is a significant contributor to the destruction of the integrity and cultural value of urban heritage landscapes (Ali et al. Citation2020; Su et al. Citation2023; Wang et al. Citation2023). It has prompted authorities to consider the protection and inheritance of urban heritage within the dynamic process of urban and rural construction and development (Najd et al. Citation2015). The expansion of high-rise buildings can lead to the degradation of the visibility and visual integrity of landmark heritage landscapes (Bu et al. Citation2021; Feng and Wu Citation2011). Therefore, the urban development planning should utilize effective tools and scientifically manage land in order to protect the heritage value, enhance the visibility of heritage, protect the skyline, and promote the integrity of heritage landscapes (Roders Citation2013; Santander, Garai-Olaun, and Ander Citation2018; Sukwai et al., Citation2022a).
Many cities have already incorporated important natural or cultural heritage into their urban visual interfaces in urban planning. For example, in Kyoto, the sacred mountain is planned as the backdrop for the urban visual interface, and the important temples on the mountain are also featured as a view target. Additionally, the height of the surrounding high-rise buildings is strictly regulated (World Bank Group Citation2018). Due to the elevated topography, mountain heritage landscapes located within the city usually offer good visibility and function as landmarks. This type of heritage landscape also has the function of overseeing the urban physical environment from a higher elevation, and creating a visual interface for the city. Therefore, the heritage landscapes can create a favorable interaction between “view” and “viewing” in the city (Lin et al. Citation2019, Sukwai et al., Citation2022b; Mak, Yip, and Lai Citation2005). “view” emphasizes the value and significance of urban heritage landmarks as scenery, how they can be seen in the city, and the visual feeling of being seen. “viewing”: emphasizing the viewpoint, viewing sightline and viewer’s psychological feeling of urban landscape. There have been few research findings on the visual assessment of heritage landscapes from this perspective.
In urban planning, visual impact assessment method based on Geographic Information System (GIS) is often used to assess the impact on landscape visual aesthetics of important natural resources and landmarks under land use change (Palmer Citation2019a; Pullar and Tidey Citation2001). Visibility is crucial for mountain heritage landmarks as it affects their range and frequency of being seen in the city (Palmer Citation2019b, ; Qiang, Shen, and Chen Citation2019). Visibility is typically determined using visibility analysis, which is a standard operation of GIS application software, calculated and expressed through raster data models, particularly using Digital Elevation Model (DEM) (Wani and Nagai Citation2021; Yang and Liu Citation2010). In order to explore the internal relationships of space, Wheatley proposed the concept of cumulative viewshed, referring to the visible degree of all points in space (Wheatley Citation1995).
Cumulative viewshed analysis describes the degree of mutual visibility between all points in a research range when all points are chosen as viewpoints. The traditional method of calculating cumulative viewshed involves repeatedly computing the viewshed from each point and then overlapping the results to create a cumulative viewshed map, which is a time-consuming and tedious process involving a lot of repetition (Danese, Nolè, and Murgante Citation2009; Salehi et al. Citation2022; Zamora Citation2007). Modern GIS software includes the function of cumulative viewshed analysis that covers the calculation process. The output is a viewable raster model that stores the viewed times of each raster pixel for viewable points (Inglis et al. Citation2022; Quinn Citation2022). Many factors affect visibility, including the observer’s height, restrictions around the viewpoint, the size, height, and viewing distance of the observation target, as well as atmospheric conditions (Weitkamp, Bregt, and Lammeren Citation2011; Yuan et al. Citation2022). Architectural construction is influenced by urban planning and land use policies, and buildings may have a visual impact on important landmark and heritage landscapes (Lake et al. Citation1998; Yu, Han, and Chai Citation2007). For this reason, the visibility and preservation of cultural and natural heritage has been greatly valued in the urban planning of many historical and cultural cities, including Vilnius in Lithuania, and Florence in Italy, etc.
Using GIS, three-dimensional (3D) city modeling is a useful tool for evaluating and predicting the visual impact of pre- or post-planning building construction on urban landmark landscapes (Fu and Ding Citation2021). Moreover, due to the ability to process large and complex urban spatial data, it provides new technical support for improving the visual interface of urban skylines, especially by controlling building height (Guney et al. Citation2012; Tong and Ding Citation2010). The Metroplan (Citation1991), a strategic urban planning document for Hong Kong, pointed out that in order to protect the mountain view of Victoria Harbour, a height control zone of 20%-30% of the mountain view should be set up in some areas, that is, the view should be visible from the top of the mountain 1/3 height down, known as the “Two-thirds Rule”. However, exceptions can be made in special cases, landmarks at proper locations may be allowed to stand out on ridgelines. The Urban Design Guidelines, Chapter 11 of the Hong Kong Planning Standards and Guidelines, aim to preserve and improve the link between the city and its natural landscape, particularly the ridgelines or peaks. To safeguard vital ridgelines, peaks, and mountain views on both sides of Victoria Harbour, the ridgelines visible from the major lookout points should be retained as an unobstructed zone (Hong Kong Planning Department Citation2002). The Two-thirds Rule is widely used to control the height of mountain skylines in many Chinese cities (Gao et al. Citation2023).
In complex sightline control systems, which include mountain landscapes as the background, improvements have been made in terms of sightline occlusion, peripheral background environmental protection, and sightline control areas. GIS and its three-dimensional modeling function are used to evaluate and analyze the height control of high-density urban building skylines, taking into account the collaborative consideration of the built and natural environment (Agius, Sabri, and Kalantari Citation2018; Sadoun and Al-Hanbali Citation2007). Redesigning the skyline control scheme based on this analysis provides a way to promote urban development while protecting natural resources. In urban planning and landscape protection practice and research, it is essential to focus not only on management and protection of urban landscape landmarks, but also on the changing sensory and visual experiences of the public amidst the changing urban environment (Karimimoshaver et al. Citation2021; Zacharias Citation1999; Zhao, Zhang, and Cai Citation2020).
2. Methodology
2.1. Study area
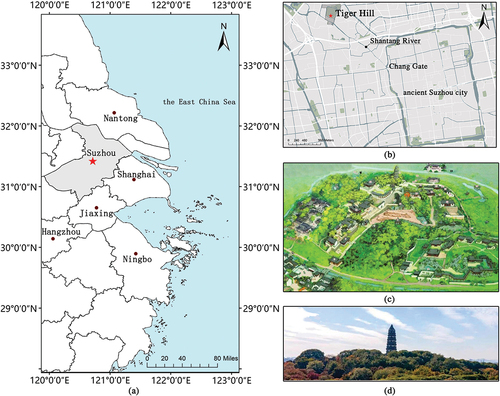
Suzhou is a city on the southeast coast of China with a history of more than 2,500 years (). Today, its core area (the ancient city) retains its ancient scale and texture. Suzhou is a low-lying city characterized by gentle plains. Low mountains and hills are scattered throughout the western region generally 100 to 350 meters high. Some notable peaks include Qionglong Mountain, Qizi Mountain, Tianping Mountain, Lingyan Mountain, etc. Tiger Hill is a hillock covering about 15.7 hectares and standing 34.3 meters tall. It is less than 3.5 kilometers away from the northwest corner of the ancient Suzhou city (). Tiger Hill boasts a large number of famous historic sites, including the Tiger Hill Pagoda, Tomb of King He Lu, Sword Testing Stone, Sword Pool, among others (). Usually, Tiger Hill refers to the general term for a scenic area that includes all the attractions (). Due to the flat terrain, Tiger Hill has been a symbol landscape of Suzhou since ancient times, offering various recreational activities such as flower markets, mountain climbing, full moon viewing, and snow sightseeing, etc. Therefore, Tiger Hill has earned the title of “the first mountain in Suzhou”, and is a historic landmark that has been closely tied to urban life.
Figure 1. (a) location of Suzhou; (b) Tiger Hill in Suzhou; (c) overall bird’s-eye view of Tiger Hill (source: Management Office of Tiger Hill); (d) the façade of Tiger Hill (source: Suzhou Garden and Greening Administration Bureau).
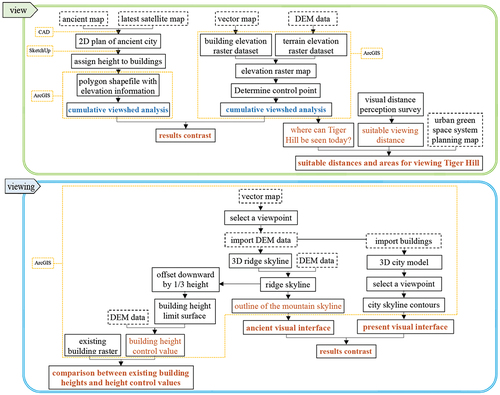
shows the research framework. First, it aims to compare the cumulative viewshed analysis results of Tiger Hill between ancient times and the present, to identify the areas in Suzhou where Tiger Hill was visible. Then, suitable areas for viewing Tiger Hill in urban green spaces were selected based on visual preference questionnaires and urban planning data. Second, this study investigates the visual interface of the western and southern mountains when viewed from the top of Tiger Hill using a three-dimensional city model. It also discusses the control of building height in the viewing range under the application of the “Two-thirds Rule”.
Figure 2. Methodological framework.
2.2. Data resource
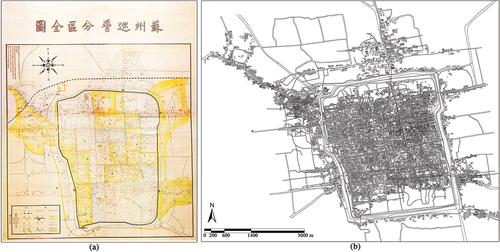
The Suzhou vector map of 2022 (1:100,000) was downloaded from JavaScript API (lbsyun.baidu.com), which includes building elevation data. Then, the digital elevation model (DEM) data of Suzhou was downloaded from the Geospatial Data Cloud (https://www.gscloud.cn/). Both datasets use the WGS 1984 coordinate system to ensure consistency. In addition, this study used the “Complete Map of Suzhou Police Districts” published by the Shanghai Weiwen Company in 1908 (Zhang Citation2004, ), and the latest satellite map downloaded from the National Platform for Common Geospatial Information Services of China (www.tianditu.gov.cn) was also used.
Figure 3. (a) Complete map of Suzhou Police Districts created in 1908; (b) two-dimensional reconstruction map of Suzhou in 1908.
2.3. Computer-generated 3D modeling
To assess the impact of urban expansion on the visual interface of Tiger Hill, a three-dimensional model of ancient Suzhou city is necessary. The Complete Map of Suzhou Police Districts was chosen as the basis for the model. The ancient Suzhou city has been well-preserved until now, the street names on this map are still in use today. Authors used Computer-Aided Design (CAD) software to plot streets, buildings, waterways, and contour lines from the map onto the latest satellite map, resulting in a two-dimensional plan of Suzhou in 1908 ().
The 2D reconstruction city plan was imported into SketchUp and height values were manually assigned to the buildings. The heights of ordinary residential buildings were 4.5 m, while the height of 2-story shop was 8 m. River depths were ignored, and the heights of other buildings such as city walls, towers, and pagodas were assigned according to actual conditions. The SketchUp model of ancient Suzhou was then imported into ArcGIS to obtain a polyhedron, which was later converted into a raster file and then into a polygon shapefile with elevation information. This file served as the basis for cumulative viewshed analysis.
2.4. Analysis by ArcGIS
2.4.1. Cumulative viewshed analysis
First, we used ArcGIS 10.6 to convert the Suzhou vector map to the building elevation raster dataset by assigning the elevation value of each building to the central location of each raster cell. DEM data was loaded to generate a terrain elevation raster dataset by resampling. The building and terrain elevation raster datasets were combined by the Raster Calculator tool to output the elevation raster map of Suzhou city (ERMSC). All input and output raster datasets have a cell size of 0.5 m × 0.5 m. Tiger Hill was divided into some control points from which to observe the city. Based on ERMSC, the visual range of each control point was determined. ERMSC was clipped to extract the Tiger Hill raster dataset, which was then resampled to a grid of 10 m × 10 m, used as the sampling frequency of the control points, so as to balance the contradiction between analysis accuracy and computational efficiency.
The height value of each grid center was assigned using the “Raster to Point” function. Control points and ERMSC were then used with the Viewshed analysis tool to determine the visible area from each control point. The output raster records the visible frequency of each cell in the input ERMSC relative to each control point, with the frequency data then divided into seven gradients to generate the cumulative viewsheds.
2.4.2. Changes of the visual interface
Until the early 20th century, the area outside the city walls of Suzhou consisted of farmland and wasteland. From the top of Tiger Hill to the south and west, the view was unobstructed. To compare changes in the visual interface of Tiger Hill over time, we constructed the visual interface of Tiger Hill viewing the southern and western mountains based on real viewpoints (). Specific steps were taken as follows:
Figure 4. (a) the visual interface of Tiger Hill viewing the southern and western mountains based on real viewpoints; (b) the panoramic city visual interface from the top of Tiger Hill.
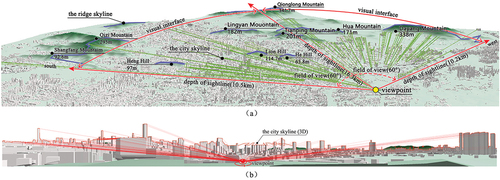
First, a viewpoint located on the top of Tiger Hill was selected and converted to 3D point elements in ArcScene. DEM data was imported to generate 3D terrain. Second, the Skyline tool in ArcGIS was used to construct the 3D ridge skyline observed at the viewpoint. Third, DEM data was imported into ArcMap and superimposed with the 3D ridge skyline. A line element was added, and the overlap between the ridge and skyline was traced using the 3D Analyst tool, generating a 2D profile of the ridge skyline, specifically, the outline of the mountain skyline.
To construct the current visual interface, the specific steps are as follows:
First, in the second step of the “ancient visual interface” section above, we imported the “building” surface element to construct a superimposed 3D terrain and build the 3D city model. Second, in ArcGIS, we selected the viewpoint used in the analysis of the ancient visual interface and then used the Skyline tool to segmentally move the viewpoint towards the southern and western mountains within the human comfortable visual field range of 60°. This allowed us to obtain the city skyline contours, including mountains and buildings. These contours were then combined to form a panoramic city visual interface (). Finally, we compared the visual interfaces by superimposing the ancient visual interface and the current visual interface.
2.4.3. Analysis of building height control
Based on the analysis results of the ridge skyline, the process for analyzing and controlling building height in the view area is as follows:
First, we used the “Feature Vertices to Points” tool to extract the turning points of the ridge skyline. Then, we used the “Add Surface Information” tool to obtain the elevation value (H) of each turning point. Additionally, to ensure that the mountain below 1/3 of the ridge line does not obstruct the view, we set the “Z factor” of the turning point to be multiplied by a coefficient of 0.67, and offset each turning point downward by 0.33 H. Second, we used the “Create Tin” tool to generate an irregular triangulated data set between the viewpoint and the offset skyline turning points, forming a building height limit surface and converting it to a raster called “control height”. Third, we used the “Raster Calculator” tool to calculate the result of “control height” minus the DEM value to obtain the “building height control value”, and divided it into six categories. According to the above classification, we used the “Extract by Mask” tool to extract the existing building raster respectively, and labeled the colors according to the five levels in the symbol system.
2.5. Selection of suitable areas for viewing Tiger Hill
The cumulative viewshed analysis result is an ideal visibility analysis result. However, Humans have a limited visual range and a comfortable viewing distance (Kent and Schiavon Citation2020; Ulrich Citation1979). Therefore, it is important to find out the comfortable viewing distance for selecting the suitable area for viewing Tiger Hill.
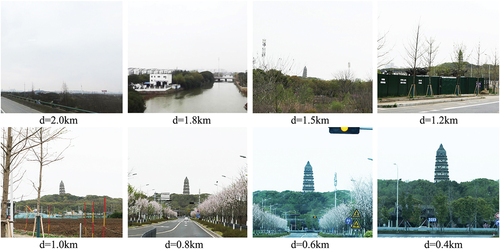
Questionnaires based on the Likert five-level scale were distributed at distances of 0.4, 0.6, 0.8, 1.0, 1.2, 1.5, 1.8, and 2.0 km from the Tiger Hill Pagoda, respectively (), asking questions such as “Does Tiger Hill attract your attention at this viewing distance?” and “Is Tiger Hill your viewing object at this viewing distance? Is this the best viewing distance? Would you like to view Tiger Hill closer or farther?” All result data were expressed as mean (standard deviation) or mean (standard error). The Wilcoxon signed-rank test was conducted using SPSS 20.0 to determine statistical significance between two groups of data, with a significance level set at p < 0.05.
Figure 5. Tiger Hill at different visual distances.
After determining the threshold of the suitable viewing distance for Tiger Hill, the cumulative viewshed analysis results will then overlay with the green space system planning map of Gusu District in Suzhou within this range to screen the suitable green spaces.
3. Results
3.1. Comparison of cumulative viewshed analysis results
As can be seen from , in ancient times, Tiger Hill could be seen in a large number of areas in Suzhou city. Meanwhile, in the west and north areas out of the ancient city, Tiger Hill was also visible. Moreover, the Shantang River from Chang Gate to Tiger Hill was a sightline corridor. The above is consistent with the historical records about Tiger Hill as the landmark of ancient Suzhou.
Figure 6. The cumulative viewshed analysis result of Tiger Hill in ancient (a) and current (b) Suzhou.
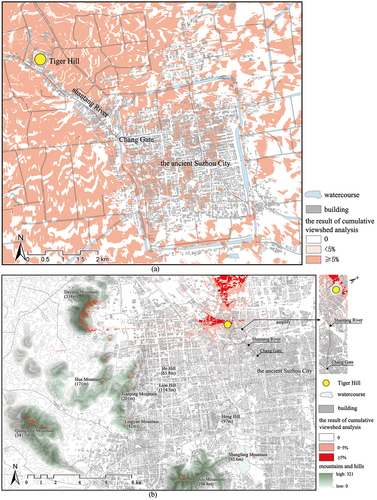
shows that after the urban expansion, Tiger Hill is no longer visible from the ancient Suzhou city, and the function of Shantang River from Chang Gate to Tiger Hill as a sightline corridor has greatly weakened. Due to the dominance of factories, the visibility of Dayang Mountain in the west side of Tiger Hill remains good. The south and southwest of Tiger Hill are mainly occupied by residential and commercial areas with dense buildings and high-rise structures, obstructing the view of the mountains. To the northwest of Tiger Hill is the Tiger Hill Wetland Park, and further to the north is a large area of fields and vacant land, resulting in good visibility. The area within a 2 km radius of Tiger Hill has varying degrees of visibility, Notably, the west side of Tiger Hill has higher visibility, particularly in the park and vacant land areas.
3.2. Suitable distances and areas for viewing Tiger Hill
The authors randomly distributed 60 questionnaires to passers-by within 2 km of Tiger Hill on March 25 to 26, 2023, and recovered 54 valid questionnaires. The answers to four questions in the questionnaires all passed the internal consistency test using Cronbach’s alpha value of 0.80 or higher. The mean and standard deviation of questionnaire survey results and the difference analysis results using the Wilcoxon signed-rank test are shown in .
Figure 7. (a–d) questionnaire results. The mean ± SD, n = 54, * p < 0.05, *** p < 0.001 using the Wilcoxon signed-rank test; (e) the visual perception of Tiger Hill under different visual distances.
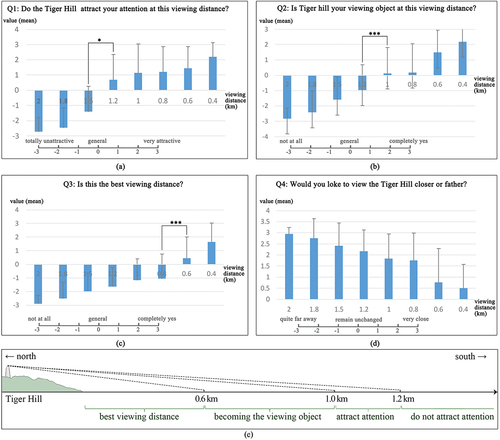
The contents of Questions 1 to 4, which measured respondents’ perceptions of viewing distance and attention towards Tiger Hill, were progressively set. The threshold for Tiger Hill to attract attention was determined to be around 1.2 km. When the viewing distance was increased from 1.2 km to 1.5 km, there was a significant difference in the results (p < 0.05). The threshold for respondents to actively seek out Tiger Hill as their viewing object was around 1 km. When the viewing distance was reduced from 1.2 km to 1 km, there was a significant difference in the results (p < 0.001). The optimal viewing distance was found to be around 0.6 km. When the viewing distance was reduced from 0.8 km to 0.6 km, there was a significant difference in the results (p < 0.001). Finally, the respondents’ expectations to reduce the visual distance were found to increase as the visual distance increased. These results were consistent with the findings of the foregoing three questions.
Therefore, based on the results of the questionnaire survey and difference analysis, this study designates the area within 1.2 km of the Tiger Hill Pagoda as the suitable viewing distance for this landmark (). This distance not only ensures the visibility and attractiveness of Tiger Hill but also aligns with its historical and cultural significance as a prominent feature of urban landmark landscape. By designating this area as the suitable viewing distance, this study offers valuable insights for urban planning and development initiatives aimed at preserving and enhancing the visual experience of Tiger Hill.
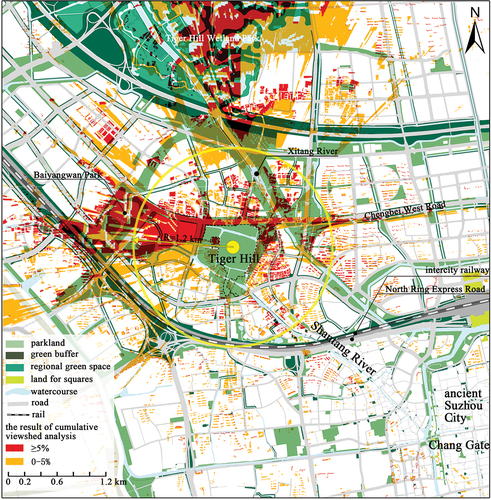
The urban green space system planning map of Gusu District in Suzhou was used as the base map, with Tiger Hill Pagoda as the center of the circle. Rings with a radius of 1.2 km were superimposed on the base map, along with the cumulative viewshed analysis results, resulting in . 1.2 km can be used to preliminarily judge the green spaces suitable for viewing Tiger Hill. It highlights the park green spaces park in the west, Chengbei West Road in the north, green spaces along Xitang River in the northeast, and green buffers of other roads within 1.2 km. Notably, Chengbei West Road is an urban expressway that places great importance on managing the trees on both sides of the road to maintain clear visibility of Tiger Hill from the road.
Figure 8. The superimposed result of the cumulative viewshed analysis result and the urban green space system planning map of Gusu District in Suzhou.
3.3. Building height control
The panoramic visual interface from the viewpoint on the top of Tiger Hill to the south and west is shown in . The figure includes mountain contour lines, as well as the skyline of urban buildings. The mountain contours are also the ancient visual interfaces. It can be calculated that the proportion of the current visible part of the mountains in relation to the total mountains area is 42%. The shorter Lingyan Mountain and Tianping Mountain are blocked by high-rise buildings to the southwest of Tiger Hill, while the mountain contour line of Dayang Mountain in the west is largely visible. The contour lines of the other mountains are partially blocked by buildings.
Figure 9. The panoramic visual interface from the viewpoint on the top of Tiger Hill to the south and west.
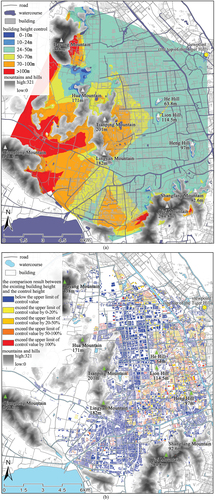
In order to maintain and enhance the visual interface of viewing the southern and western mountains from the top of Tiger Hill, it is necessary to analyze the building height control value within the visual range and compare it with the height of existing buildings. displays the building height control value of the lower one-third area of the mountain within the visual field. shows the comparison between the height of existing buildings and the building height control values. It can be seen from that in the southwest of Tiger Hill, where buildings are densely distributed from north to south, the height of most buildings exceeds the height control value by 0–20%, blocking the contour of Tianping Mountain and Lingyan Mountain. In the south of Tiger Hill and the north of Qizi Mountain, although many buildings have a height above 20% or even 50% of the height control value, their distribution density is low, and many other buildings have a height below the height control value, allowing the sightline to pass through those buildings. is significant for guiding the height control of reconstructed buildings during urban renewal and new buildings during urban development.
Figure 10. (a) result of building height control analysis; (b) result of the comparison between the height of existing buildings and the building height control values.
4. Discussion
4.1. “View” and “viewing” interaction of urban heritage landmark
As a city’s name card and cultural symbol, urban heritage landmarks usually contain dual resources of natural and cultural heritage. They represent historic layering through time and stability and continuity in space. Therefore, from the perspective of urban historic landscape, the value of urban heritage landmarks is dynamic, and it is necessary to incorporate historic landscape protection into the sustainable development of the city (Skrede and Berg Citation2019; Veldpaus Citation2015).
To comprehensively evaluate the visual characteristic of Tiger Hill, this study divided the landscape evaluation into two parts: “view” and “viewing”. “view” emphasizes the value and significance of urban heritage landmarks as scenery, how they can be seen in the city, and the visual feeling of being seen. “viewing”: emphasizing the viewpoint, viewing sightline and viewer’s psychological feeling of urban landscape. In most cities, the focus is often on how heritage landmarks can be viewed from the city, rather than on how the city can be viewed from these landmarks (Batool et al. Citation2020; Sopina and Scitaroci Citation2020). Although visual perception tends to be subjective and different visual subjects have different perceptions of the same landscape, there are relatively universal aesthetic standards for evaluating urban landscapes using quantitative indicators and means (Bell Citation2001; Yuan et al. Citation2022). The special perspective of appreciating Suzhou city and suburban mountains from Tiger Hill also needs to be improved. Therefore, only by synchronously optimizing and adjusting “view” and “viewing” can the expected effect be achieved.
Although the Suzhou government has set a limit of 24 meters on building heights within the ancient city to keep the historical city style, there is no height restriction for buildings outside the city. With the continuous development of new structures, the visual corridor between Tiger Hill and the ancient city and the visual interface of viewing south and west mountains from the top of Tiger Hill have been severely impacted. It is crucial to balance land use and heritage preservation in urban planning. Establishing urban planning theories and corresponding digital analysis methods that emphasize the interaction between viewing and landscape for heritage landmarks is essential (Su, Sigley, and Song Citation2020; Kavaliauskas Citation2010).
This study indicates that in densely built urban environments, the spatial distance is not the primary factor that determines the visibility of Tiger Hill as the object to be viewed. Due to the obstruction of buildings, the area within 1.2 km south of Tiger Hill has very low or even no visibility. Additionally, the supply of park green space in urban areas is relatively limited, and most of them are stock green spaces. Therefore, more attention should be paid to the sightlines and viewing interfaces from green spaces on both sides of roads and waterways. The width of roads and waterways is also an essential factor affecting visibility. Narrow roads can be obscured by buildings and vegetation on both sides, almost making them invisible.
In theory, if a road or its extension intersects the observed object, such that the object is located in the direction of the end of the road, its visibility should be high. However, as can be seen from , this ideal situation is not entirely consistent with the analysis results and actual scenarios. This is because another road perpendicular to the former road is often present at its end, and the buildings between the perpendicular road and the observed object obstruct the sightline from the former road. Therefore, when designing urban areas around Tiger Hill, the height of buildings and trees on both sides of the former road and toward its end should be controlled to ensure an unobstructed sightline.
4.2. The application of the “two-thirds rule” of mountain contour lines
The top of Tiger Hill serves as a viewpoint and is located more than 10 km away from the southern and western mountains of Suzhou. Its visual interface encompasses the entire urban skyline and landscape pattern of the western part of Suzhou city, reflecting the overall image, cultural heritage, and style characteristics of the city. This panoramic view is the most complete and intuitive reflection of the city’s macro image. The “Two-thirds Rule” has been widely used for skyline control in many Chinese cities over the past three decades, such as Suzhou, Wuhan, Chongqing, Fuzhou, Nanjing, and Quanzhou, et al. The general value of visible height for mountain landscape visibility protection is one-third. In 2009, the Suzhou Planning and Preparation Center released the Study on the Height of Suzhou. For Shangfang Mountain (with a height of 92.6 m) and Lion Hill (with a height of 114.5 m), the study proposed the strategy of “control to ensure that at least one-third of the height of the mountain can be seen”. However, with the expansion and development of the city, this strategy falls short of the requirements for visual interface management of urban landscape heritage.
On the one hand, the mountains in the west and south of Suzhou are visually coherent, covering a visual field of 120° with the top of Tiger Hill as the viewpoint (as shown in ). However, the Study on the Height of Suzhou only targeted two of these mountains, which have been obstructed by buildings. On the other hand, the Two-thirds Rule may not be practical in the complex urban environment (Gao et al. Citation2023).
Cities often propose different building height control proportions based on the class of mountains. For instance, some suggest that building height be kept below half (Yang et al. Citation2008) or two-thirds (Wang Citation2018) the height of the mountain, while others advocate lower standards, such as 1/5 (Lai Citation2017) or 1/4 (Rao and Dai Citation2012). The proportion of building height control can be flexibly adjusted according to factors such as the mountain grade, scale, and current construction conditions. Research suggests that 1/3 of the mountain height is not the ideal visual ratio for viewing mountains; rather, it represents the minimum protected skyline (Xu, Zhou, and Wu Citation2013).
The Two-thirds Rule primarily provides guidance for building height control and does not constrain horizontal building or block scale control. Some researches indicate that the public perception tends toward the mountain landscape being exposed by reducing building height, rather than the mountain landscape seen through narrow viewing corridors between buildings (Xu, Zhou, and Wu Citation2013; Zacharias Citation1999). Hence, building height control is more crucial than controlling horizontal building or block scale. In Urban Design Guidelines for Hong Kong, it is proposed to establish an “unblocked mountain view area of 20% to 30%” that only targets partial spaces of mountains and allows individual landmark buildings to break through the ridge skyline. Unilaterally emphasizing strict control under the rule may unduly restrict urban construction and development, resulting in ineffective protection. Ultimately, the public is the main audience for appreciating urban heritage landmark. Conducting public perception evaluation surveys (Wang, Zhao, and Liu Citation2016; Jin and Wang Citation2021) and visual interface simulations and evaluations of development or renovation in local key areas can help improve design accuracy and align with public preferences.
4.3. Limitations and insights for future research
This study has some limitations that require further research.
First, the study relied on DEM data of Suzhou with a precision of 30 meters, which led to a loss of spatial information and reduced the accuracy of the analysis results due to the large granularity (Yang and Liu Citation2010).
Second, the three-dimensional urban models used in this study did not account for urban vegetation, such as megaphanerophytes, and large structures such as billboards that can block sightlines and affect the accuracy of cumulative viewshed analysis (Garnero and Fabrizio Citation2015; Lin, Lin, and Hu Citation2017).
Third, the selection of the elevation raster map of Suzhou City as the control points for Tiger Hill resulted in the viewpoint’s elevation being the same as that of the top of Tiger Hill. While this introduced some errors in the analysis results, such errors can be ignored in large-scale viewshed analysis.
Fourth, in this study, Tiger Hill was selected as the viewing object from the city and the top of Tiger Hill as the viewpoint for overlooking the ancient city and suburban mountains based on the local culture and folk activity tradition formed by long-term historical precipitation. However, with the advancement of urbanization, it is crucial to evaluate whether traditional viewpoints still have the viewing conditions or value in shaping viewing corridors. Additionally, this study selected the green space within a 1.2 km radius with Tiger Hill Pagoda as the center of the circle as suitable areas for viewing Tiger Hill. In future studies, the scenic beauty estimation method can be introduced to evaluate visual perception preferences at different distances (Frank et al. Citation2013; Mo, Chen, and Xie Citation2021), to rank the importance of green spaces.
Fifth, since the visual images of Tiger Hill have similar appearance in different locations, this study did not compare the visual differences in various viewing directions. However, for other types of scenic heritage, where the visual images of different locations are inconsistent, it is crucial to evaluate and select suitable viewpoints.
Finally, in the process of this study, it is found that Tiger Hill, as one of the most important urban heritage landmarks of Suzhou, has not set up a buffer zone, and the existing surrounding residential areas and buildings are in disorder and lack of management. Buffer zones are seen not only as transitional areas to protect heritage from potential threats beyond borders, but also as areas that connect the values of the cultural landscape while being able to limit potential risk factors (Lv et al. Citation2022; Schlee Citation2017). In future studies, attention should be paid to the study of how to delimit the buffer zone of Tiger Hill, so as to protect not only the visual interface of Tiger Hills to be viewed, but also its surrounding ecological environment (Comer Citation2014; Darabi et al. Citation2020).
5. Conclusion
The “view” and “viewing” attributes are common characteristics of mountainous urban heritage landmarks, but there is few research that simultaneously considers these two aspects. Visual evaluation and protection of urban historic landmarks should take precedence over urban planning and architectural design in order to achieve a balance between urbanization and the visual quality of historic heritage. From the perspective of “view”, urban design leaders should provide reasonable routes and viewpoints for historic landmarks in the city, integrating city design with people’s feelings, and increasing the visibility of historic landmarks. From the perspective of “viewing”, the design and optimization of urban heritage landscapes require a future-oriented, forward-thinking concept and measures. It also requires the establishment of a more scientific methodology and working platform to make the regulation and management of urban heritage landscapes more reasonable. The scientific and reasonable use of multidimensional, multi-angle analysis, simulation, and design methods in the macro-control of urban heritage landscapes will be the overall trend of future urban construction and management. It is also something that various disciplines including urban planning, landscape architecture, and architectural design need to collectively focus on.
Acknowledgements
We would like to express our deepest appreciation to Dr. Zefeng Lian for his kind help in this research.
Disclosure statement
The authors report no declarations of interest.
Additional information
Funding
Notes on contributors
Tiantian Zhang
Tiantian Zhang is an assistant professor in the Department of Landscape Architecture at Soochow University, China. Her research areas include the spatial form of traditional Chinese gardens and urban historical landscapes. Dr. Zhang’s research has been published in high-impact journals within the field of traditional Chinese gardens. She’s also a reviewer for a number of international journals.
Mengling Yan
Mengling Yan is an undergraduate student in the Department of Landscape Architecture at Soochow University, China. Her research interest is the planning and design of landscape architecture.
Xiang Yu
Xiang Yu is an undergraduate student in the Department of Landscape Architecture at Soochow University, China. His research interest is the planning and design of landscape architecture.
Binyi Liu
Binyi Liu is currently an invited professor at Soochow University and special invited professor at Macau University of Science and Technology. He is the honorary member of American Society of Landscape Architects, the coordinator and member of Landscape Architecture Discipline Review Group of National Academic Degree Office of the State Council, China. His research interests are mechanism and principle of landscape space visual aesthetic perception and theories, methodology and technique of the construction of regional urban and rural green space system.
References
- Agius, T., S. Sabri, and M. Kalantari. 2018. “Three-Dimensional Rule-Based City Modelling to Support Urban Redevelopment Process.” ISPRS International Journal of Geo-Information 7 (10): 413. https://doi.org/10.3390/ijgi7100413.
- Ali, S., H. Xu, W. Ahmed, N. Ahmad, and Y. A. Solangi. 2020. “Metro Design and Heritage Sustainability: Conflict Analysis Using Attitude Based on Options in the Graph Model.” Environment Development and Sustainability 22 (4): 3839–3860. https://doi.org/10.1007/s10668-019-00365-w.
- Batool, A., P. Rutherford, P. Mcgraw, T. Ledgeway, and S. Altomonte. 2020. “View Preference in Urban Environments.” Lighting Research & Technology 53 (7): 613–636. https://doi.org/10.1177/1477153520981572.
- Bell, S. 2001. “Landscape Pattern, Perception and Visualisation in the Visual Management of Forests.” Landscape and Urban Planning 54 (1–4): 201–211. https://doi.org/10.1016/S0169-2046(01)00136-0.
- Bu, X., X. Chen, S. Wang, Y. Yuan, and C. Han. 2021. “The Influence of Newly Built High-Rise Buildings on Visual Impact Assessment of Historic Urban Landscapes: A Case Study of Xi’an Bell Tower.” Journal of Asian Architecture and Building Engineering 21 (4): 1304–1319. https://doi.org/10.1080/13467581.2021.1930011.
- Comer, D. C. 2014. “Zoning: Boundary Areas and Buffer Zones.” In Encyclopedia of Global Archaeology, edited by C. Smith, 7984–7986. New York: Springer New York. https://doi.org/10.1007/978-1-4419-0465-2_507.
- Danese, M., G. Nolè, and B. Murgante. 2009. “Visual Impact Assessment in Urban Planning.” In Geocomputation and Urban Planning. Studies in Computational Intelligence, edited by B. Murgante, G. Borruso, and A. Lapucci, Vol. 176 133–146. Berlin: Springer Berlin Heidelberg. https://doi.org/10.1007/978-3-540-89930-3_8.
- Darabi, H., H. I. Behbahani, S. Shokoohi, and S. Shokoohi. 2020. “Perceptual Buffer Zone: A Potential of Going Beyond the Definition of Broader Preservation Areas.” Journal of Cultural Heritage Management and Sustainable Development 10 (3): 271–291. https://doi.org/10.1108/JCHMSD-12-2017-0087.
- Department, P. 1991. “The Metroplan”. Hong Kong Planning Standards and Guidelines. https://www.pland.gov.hk/pland_en/tech_doc/hkpsg/index.html
- Feng, P., and X. Wu. 2011. “Sustainable Development of High-Rise Building.” Procedia Engineering 21:943–947. https://doi.org/10.1016/j.proeng.2011.11.2098.
- Frank, S., C. Fürst, L. Koschke, A. Witt, and F. Makeschin. 2013. “Assessment of Landscape Aesthetics—Validation of a Landscape Metrics-Based Assessment by Visual Estimation of the Scenic Beauty.” Ecological Indicators 32:222–231. https://doi.org/10.1016/j.ecolind.2013.03.026.
- Fu, L., and Y. Ding. 2021. “3D City Online Visualization and Cluster Architecture for Digital City.” Journal of Sensors 2021:1–12. https://doi.org/10.1155/2021/6427468.
- Gao, Y., S. Cheng, Y. Wang, G. Zhang, and Z. Su. 2023. “The Delicacy Control of Building Height in Consideration of Mountain Landscape and Development Capacity: A Practical Exploration of One-Third Height Control Rule in Preserving the Mufu Mountain Skyline in Nanjing.” Architectural Journal 651 (2): 112–116. https://doi.org/10.19819/j.cnki.ISSN0529-1399.202302018.
- Garnero, G., and E. Fabrizio. 2015. “Visibility Analysis in Urban Spaces: A Raster-Based Approach and Case Studies.” Environment and Planning B Planning and Design 42 (4): 688–707. https://doi.org/10.1068/b130119p.
- Guney, C., S. A. Girginkaya, G. Cagdas, and S. Yavuz. 2012. “Tailoring a Geo Model for Analyzing an Urban Skyline.” Landscape and Urban Planning 105 (1–2): 160–173. https://doi.org/10.1016/j.landurbplan.2011.12.016.
- Hong Kong Planning Department. 2002. “Hongkong Planning Standards and Guidelines.” Accessed May 8, 2023. https://www.pland.gov.hk/pland_sc/tech_doc/hkpsg/full/index.htm.
- Inglis, N. C., J. Vukomanovic, J. Costanza, and K. K. Singh. 2022. “From Viewsheds to Viewscapes: Trends in Landscape Visibility and Visual Quality Research.” Landscape and Urban Planning 224:104424. https://doi.org/10.1016/j.landurbplan.2022.104424.
- Jin, X., and J. Wang. 2021. “Assessing Linear Urban Landscape from Dynamic Visual Perception Based on Urban Morphology.” Frontiers of Architectural Research 10 (1): 202–219. https://doi.org/10.1016/j.foar.2021.01.001.
- Karimimoshaver, M., M. Parsamanesh, F. Aram, and A. Mosavi. 2021. “The Impact of the City Skyline on Pleasantness; State of the Art and a Case Study.” Heliyon 7 (5): e07009. https://doi.org/10.1016/j.heliyon.2021.e07009.
- Kavaliauskas, P. 2010. “Sustainable and Balanced Development of Lithuanian Curonian Spit and Neringa Municipality: Planning and Political Aspects.” Ukio Technologinis ir Ekonominis Vystymas 16 (1): 58–74. https://doi.org/10.3846/tede.2010.04.
- Kent, M., and S. Schiavon. 2020. “Evaluation of the Effect of Landscape Distance Seen in Window Views on Visual Satisfaction.” Building and Environment 83:107160. https://doi.org/10.1016/j.buildenv.2020.107160.
- Lai, X. 2017. “Control System Research of City Mountain Protection Planning: A Case Study on Mountain Protection Planning of Urumqi City.” Shanghai Urban Planning Review 134 (3): 69–76.
- Lake, I. R., A. A. Lovett, I. J. Bateman, and I. H. Langford. 1998. “Modelling Environmental Influences on Property Prices in an Urban Environment.” Computers, Environment and Urban Systems 22 (2): 121–136. https://doi.org/10.1016/S0198-9715(98)00012-X.
- Lin, Y., Y. Ke, C. Bosch, K. Yu, and J. Liu. 2019. “Bird Eye Analysis of Skyline Views from an Elevated Recreation Trail—The Case of the Fu Forest Trail, Fuzhou, China.” Urban Forestry & Urban Greening 47:126543. https://doi.org/10.1016/j.ufug.2019.126543.
- Lin, T., H. Lin, and M. Hu. 2017. “Three-Dimensional Visibility Analysis and Visual Quality Computation for Urban Open Spaces Aided by Google SketchUp and WebGis.” Environment and Planning B Planning and Design 44 (4): 618–646. https://doi.org/10.1177/0265813515605097.
- Lv, R., Y. Liu, L. Zhang, and D. Kong. 2022. “Urban Historic Heritage Buffer Zone Delineation: The Case of Shedian.” Heritage Science 10 (1): 1–15. https://doi.org/10.1186/s40494-022-00702-9.
- Mak, A., E. Yip, and P. Lai. 2005. “Developing a City Skyline for Hong Kong Using Gis and Urban Design Guidelines.” URISA Journal 17 (1): 33–42.
- Mo, L., J. Chen, and Y. Xie. 2021. “Assessment of Landscape Resource Using the Scenic Beauty Estimation Method at Compound Ecological System.” Environmental Science and Pollution Research 28 (5): 5892–5899. https://doi.org/10.1007/s11356-020-10978-8.
- Najd, M. D., N. A. Ismail, S. Maulan, M. M. Yunos, and M. D. Niya. 2015. “Visual Preference Dimensions of Historic Urban Areas: The determinants for Urban Heritage Conservation.” Habitat International 49:115–125. https://doi.org/10.1016/j.habitatint.2015.05.003.
- Palmer, J. F. 2019a. “The Contribution of a GIS-Based Landscape Assessment Model to a Scientifically Rigorous Approach to Visual Impact Assessment.” Landscape and Urban Planning 189:80–90. https://doi.org/10.1016/j.landurbplan.2019.03.005.
- Palmer, J. F. 2019b. “The Contribution of Key Observation Point Evaluation to a Scientifically Rigorous Approach to Visual Impact Assessment.” Landscape and Urban Planning 183:100–110. https://doi.org/10.1016/j.landurbplan.2018.11.001.
- Pullar, D. V., and M. E. Tidey. 2001. “Coupling 3d Visualisation to Qualitative Assessment of Built Environment Designs.” Landscape & Urban Planning 55 (1): 29–40. https://doi.org/10.1016/S0169-2046(00)00148-1.
- Qiang, Y., S. Shen, and Q. Chen. 2019. “Visibility Analysis of Oceanic Blue Space Using Digital Elevation Models.” Landscape and Urban Planning 181:92–102. https://doi.org/10.1016/j.landurbplan.2018.09.019.
- Quinn, S. D. 2022. “What Can We See from the Road? Applications of a Cumulative Viewshed Analysis on a US State Highway Network.” Geographica Helvetica 77 (2): 165–178. https://doi.org/10.5194/gh-77-165-2022.
- Rao, X., and D. Dai. 2012. “Study on the Landscape Organization of City Skyline Under the Constraint of Natural Environment: A Case Study of Nan ‘An City.” Urban Problems 209:12–16. https://doi.org/10.13239/j.bjsshkxy.cswt.2012.12.001.
- Roders, A. R., 2013. Lessons from Island of Mozambique on Limits of Acceptable Change. In Swahili Historic Urban Landscapes: Report on the Historic Urban Landscape Workshops and Field Activities on the Swahili Coast in East Africa 2011–2012. van Oers, R., Haraguchi, S., Eds. Paris, France: UNESCO. pp. 40–49.
- Sadoun, B., and N. Al-Hanbali, 2007. “Three Dimensional (3D) GIS Modeling for High Buildings and Applications.” 2007 IEEE/ACS International Conference on Computer Systems and Applications, 572–577. Amman, Jordan.
- Salehi, A., A. Halabian, F. A. Beni, M. Salehi, and B. Dadras. 2022. “A Fast Serial Computation Approach for Computing Viewshed of a Region by Detecting Key Spots on the Terrain.” Geocarto International 37 (27): 17625–17641. https://doi.org/10.1080/10106049.2022.2129841.
- Santander, A. A., A. A. Garai-Olaun, and D. Ander. 2018. “Historic Urban Landscapes: A Review on Trends and Methodologies in the Urban Context of the 21st Century.” Sustainability 10 (8): 2603. https://doi.org/10.3390/su10082603.
- Schlee, M. B. 2017. “The Role of Buffer Zones in Rio de Janeiro Urban Landscape Protection.” Journal of Cultural Heritage Management and Sustainable Development 7 (4): 381–406. https://doi.org/10.1108/JCHMSD-10-2015-0040.
- Skrede, J., and S. K. Berg. 2019. “Cultural Heritage and Sustainable Development: The Case of Urban Densification.” The Historic Environment: Policy & Practice 10 (1): 83–102. https://doi.org/10.1080/17567505.2019.1558027.
- Sopina, A., and B. B. O. Scitaroci. 2020. “Connecting City and Landscape: Urbanism and Landscape Point of View.” Prostor 27 (2): 270–282. https://doi.org/10.31522/p.27.2(58).7.
- Sukwai, J., N. Mishima, and N. Srinurak. 2022a. “Balancing Cultural Heritage Conservation: Visual Integrity Assessment to Support Change Management in the Buffer Zone of Chiang Mai Historic City Using GIS and Computer-Generated 3D Modeling.” Land 11 (5): 666. https://doi.org/10.3390/land11050666.
- Sukwai, J., N. Mishima, and N. Srinurak. 2022b. “Identifying Visual Sensitive Areas: An Evaluation of View Corridors to Support Nature-Culture Heritage Conservation in Chiang Mai Historic City.” Built Heritage 6 (23). https://doi.org/10.1186/s43238-022-00071-z.
- Su, X., G. G. Sigley, and C. Song. 2020. “Relational Authenticity and Reconstructed Heritage Space: A Balance of Heritage Preservation, Tourism, and Urban Renewal in Luoyang Silk Road Dingding Gate.” Sustainability 12 (14): 5830. https://doi.org/10.3390/su12145830.
- Su, M. M., M. Wang, J. Yu, G. Wall, and M. Jin. 2023. “Measuring Tourism Impacts on Community Well-Being at the Hani Rice Terraces GIAHS Site, Yunnan Province of China.” Society & Natural Resources 36 (7): 796–820. https://doi.org/10.1080/08941920.2023.2185844.
- Tong, Z., and W. Ding, 2010. “Sightline-Based GIS Model for Building Height Control.” 2010 18th International Conference on Geoinformatics, 1–5. Beijing, China.
- Ulrich, R. S. 1979. “Visual Landscapes and Psychological Well‐Being.” Landscape Research 4 (1): 17–23. https://doi.org/10.1080/01426397908705892.
- Veldpaus, L. 2015. “Reconnecting the City: The Historic Urban Landscape Approach and the Future of Urban Heritage.” Cultural Trends 24 (4): 285–285. https://doi.org/10.1080/09548963.2015.1106036.
- Wang, X. 2018. “Study on Building Height Control Based on Landscape Sightline Corridor: A Case Study of the Overall Urban Design of Yuxi City.” Low Carbon World 177 (3): 155–157. https://doi.org/10.16844/j.cnki.cn10-1007/tk.2018.03.093.
- Wang, M., J. Wu, N. An, and M. Lin. 2023. “The Effect of Emotional Experiences in Fieldwork: Embodied Evidence from a Visual Approach.” Journal of Geography in Higher Education 47 (2): 188–209. https://doi.org/10.1080/03098265.2021.2005002.
- Wang, R., J. Zhao, and Z. Liu. 2016. “Consensus in Visual Preferences: The Effects of Aesthetic Quality and Landscape Types.” Urban Forestry & Urban Greening 20:210–217. https://doi.org/10.1016/j.ufug.2016.09.005.
- Wani, Z. M., and M. Nagai. 2021. “An Approach for the Precise DEM Generation in Urban Environments Using Multi-GNSS Receivers Mounted on a Mobile Platform.” Measurement 177:109311. https://doi.org/10.1016/j.measurement.2021.109311.
- Weitkamp, G., A. Bregt, and R. V. Lammeren. 2011. “Measuring Visible Space to Assess Landscape Openness.” Landscape Research 36 (2): 127–150. https://doi.org/10.1080/01426397.2010.549219.
- Wheatley, D. 1995. “Cumulative Viewshed Analysis: A GIS-Based Method for Investigating Intervisibility, and Its Archaeological Applications.” In Archaeology and Geographical Information Systems: A European Perspective, edited by G. Lock and Z. Stacic, 171–186. London: Taylor & Francis.
- World Bank Group. 2018. Cultural Heritage, Sustainable Tourism and Urban Regeneration: Capturing Lessons and Experience from Japan with a Focus on Kyoto. Washington: World Bank Group.
- Xu, L., F. Zhou, and R. Wu. 2013. “The Preference and Perception of the Skyline of Mountain-Landscape City: The Influence of Building Height and View Corridor Numbers.” Chinese Landscape Architecture 29 (10): 46–52.
- Yang, Y., and X. Liu, 2010. “Three-Demensional GIS Visibility Analysis Based on Urban DEM.” Proceedings of 2010 IEEE International Conference on Progress in Informatics and Computing, 837–841. Shanghai, China. https://doi.org/10.1109/PIC.2010.5687911.
- Yang, W., W. Wang, D. Lin, and Y. Ma. 2008. “Conservation of Mountains in Fuzhou City.” Planners 24 (8): 28–31+5.
- Yuan, G., H. Wang, M. Wang, and M. Lin. 2022. “Visual Attention and Ethnic Landscape Perception: A Case of Three Cities in the Guangdong-Hong Kong-Macao Greater Bay Area.” Applied Geography 147:102781. https://doi.org/10.1016/j.apgeog.2022.102781.
- Yu, S. M., S. S. Han, and C. H. Chai. 2007. “Modeling the Value of View in High-Rise Apartments: A 3d Gis Approach.” Environment and Planning B: Planning and Design 34 (1): 139–153. https://doi.org/10.1068/b32116.
- Zacharias, J. 1999. “Preferences for View Corridors Through the Urban Environment.” Landscape and Urban Planning 43 (4): 217–225. https://doi.org/10.1016/S0169-2046(98)00104-2.
- Zamora, M., 2007. “Total and Cumulative Viewshed: An Application in the Genii River Valley.” In The world is in your eyes. Computer Applications and Quantitative Methods in Archaeology. Proceedings of the XXXIII Computer Applications and Quantitative Methods in Archaeology Conference, CAA 2005, edited by A. Figueiredo and G. L. Velho, 313–318. CAAPortugal, Tomar.
- Zhang, Y., Eds. 2004. The Atlas of Ancient Suzhou. Suzhou, China: Gu Wu Xuan Publishing House.
- Zhao, M., J. Zhang, and J. Cai. 2020. “Visual Preference Evaluation on Urban Landmarks in the Process of Urbanization: A Case Study of Shanghai Oriental Pearl Radio & TV Tower.” Journal of Asian Architecture and Building Engineering 20 (5): 493–501. https://doi.org/10.1080/13467581.2020.1799800.