
 ?Mathematical formulae have been encoded as MathML and are displayed in this HTML version using MathJax in order to improve their display. Uncheck the box to turn MathJax off. This feature requires Javascript. Click on a formula to zoom.
ABSTRACT
Due to lithological and environmental differences, the weathering degree of stone heritage varies even within the same area. Various factors dominate the weathering process at different stages. Implementing preventive measures has reduced the impact of controllable factors such as human activities. However, salt weathering caused by atmospheric pollutants, water, and salt migration in rock formations has emerged as a major contributor to the deterioration of stone heritage. Understanding the re-weathering characteristics of stone cultural heritage at different weathering degrees is crucial for preventive protection. This study investigated the weathering status of Nanshiku Temple and designed an experimental scheme based on field monitoring data. By controlling the number of freeze-thaw cycles, stones with different weathering degrees were prepared, and sulfate weathering simulations were conducted. The results revealed severe damage to sandstone due to Na2SO4 crystallization. Higher initial weathering degrees resulted in more pronounced deterioration and faster weathering rates. Surface hardness analysis approximated the decay process using a logarithmic function within a certain range but could not fully capture the overall weathering of the stone. Uniaxial compressive strength showed a strong correlation with weathering indices like p-wave velocity. These findings provide a theoretical basis for preventive protection efforts in stone cultural heritage.
1. Introduction
According to published data (Gan Citation2014), there are currently 1,674 immovable stone artefacts classified as cultural heritage in China. Under long-term weathering, stone cementation became worse and its strength decreased, which leaded to crack development, peeling off, discoloration accumulation and other phenomena and greatly reduced the artistic value of cultural bequests (André et al. Citation2011; LI Citation2011; Nasri, Boumezbeur, and Benavente Citation2019). Stone weathering is influenced by various internal factors such as lithology, material composition, microstructure, and other properties, and external factors such as geological conditions, external loads, natural disasters, and other environmental factors (Zhang Citation2008). From the perspective of the long-term preservation time scale of stone cultural heritage, the dominant factors affecting weathering in different stages vary significantly among various examples. In addition, the degradation of rock materials can also affect the structural stability and seismic resistance of the entire rock mass (Wang et al. Citation2022; Wang, Shi, and Zhou Citation2022).
Taking stone cultural relics in cold regions as an example, freeze-thaw cycle was one of the main factors leading to their weathering. Everett (Citation1961) and Bayram (Citation2012) showed that the physical parameters of rocks, especially the pore structure, after exposure to freeze-thaw weathering, leading to a gradual decrease in rock strength parameters. Jamshidi et al. (Citation2013) and Niu et al. (Citation2021) suggested that freeze-thaw causes varying degrees of damage to rocks, and that rock samples with a higher number of freeze-thaws are more severely weathered. Zhang et al. (Citation2018) concluded, based on field research and tests, that freeze-thaw leads to material microstructure loosening and a non-linear upward trend in freeze swelling rate and thawing settlement coefficient. Series studies (Fang et al. Citation2014; Yang et al. Citation2021; Gholamreza, Reza, and Yasin Citation2015; Nasri et al., Citation2018) conducted field research on various cultural relics, including those located in Yungang Grottoes (Yungang, Shanxi Province, Northern China), Maijishan Grottoes (Tianshui, Gansu Province, Western China), and historic constructions in Tebessa. They found that prolonged exposure to freeze-thaw cycles contributed to cumulative damage and accelerated the deterioration rate of cultural heritage. Tan et al. (Citation2011) and Park et al. (Citation2020) summarized the damage mechanism and mechanical property degradation rule of stones through indoor laboratory investigation based on the field situation of stone cultural legacy. By monitoring and analyzing the global climate environment, the increasing content of SOx, NOx and other acidic gases in the air, that reacted with water and stones to generate soluble salts (Graue et al. Citation2013), has resulted in crystallization extrusion pressure which causes irreparable damage to cultural estates and becoming one of the main factors affecting stone weathering (Germinario and Oguchi Citation2021; Theoulakis and Moropoulou Citation1997). Rodriguez et al. (Citation2000) showed that salt crystallization is related to temperature and humidity and evaporation effects, which were positively correlated with each other, and that the deterioration caused by salt crystallization was very damaging to stone materials. Moreover, Oguchi and Yu (Citation2021) pointed out that crystallization pressure with salt enrichment and crystallization patterns, as one of the main causes of stone destruction, leads to the destruction of the pore structure of stone samples.
Globally, there are two common research schemes in studying the weathering of stone heritage, as in-situ test and laboratory test. The in-situ test data were used as the reference index, and the indoor weathering test was carried out according to the on-site monitoring data. About the site survey study of the heritage: The degradation degree of stone was evaluated according to the change of weathering indexes including wave velocity, hardness, microstructure and uniaxial compressive strength. Zhang et al. (Citation2018) conducted a site survey of the Dazu Rock Carvings in Chongqing, China, and used a combination of non-destructive testing methods to conclude that changes in the apparent morphology, wave velocity and surface hardness of the rock are important parameters for measuring the degree of weathering. The degree of weathering is also assessed on the basis of changes in the microscopic characteristics, physical and mechanical properties and mineral chemistry of the rock (Zhou and Gao Citation2015). Study of indoor experiments: Wilhelm et al. (Citation2016) used hardness loss to evaluate the deterioration degree of samples with different rock lithologies, and analyzed the testing methods and influencing factors. Geng et al. (Citation2019) analyzed the damage degree of sandstone according to p-wave velocity, hardness and compressive strength in order to explore the influence of different salt solutions on Yungang Grottoes. Eslami et al. (Citation2018) and Wen et al. (Citation2020) analyzed the change rules and deterioration characteristics of rock mass, microstructure, apparent morphology, it is concluded that the more the number of freeze-thaws experienced, the greater the attenuation of the physical parameters of the rock samples, compressive strength and damage morphology under freeze-thaw, and discussed the failure effect of freeze-thaw. Khodabandeh and Rozgonyi-Boissinot (Citation2022) showed that the damaging effect of sulphate crystallization on rocks can be assessed by the variation of weathering indicators such as mass and p-wave velocity.
It is evitable that stone cultural heritage continue to be affected by weathering because of environment. Even in the same environment, stones with different degrees of weathering may have different deterioration characteristics, weathering rates, and damage degree to the stability of the entire cultural bequest, and these damages result in different status quo of the stone cultural relic. In recent years, great achievements have been made in the protection of stone cultural heritage in China. However, most immovable stone objects cannot be separated from their original environment and are inevitably affected by the environment in which they are found. They continue to face multiple weathering effects. Scholars mainly focus on studying fresh rock samples as research subjects to investigate the degree of damage caused by single or dual factors. There is scant research on the re-weathering characteristics of rock cultural relics in different weathering states. In this study, sandstones with different degrees of weathering were prepared using freeze-thaw cycles, on the basis of which salt weathering tests were carried out to simulate the deterioration rate of stones already at different degrees of weathering when exposed to sulphate erosion. During the test, the changes in stone surface hardness, longitudinal wave velocity and uniaxial compressive strength were measured and analysed to investigate the re-weathering characteristics of the artefacts. It provided a theoretical basis and guidance for the protection of stone cultural estates under the possible weathering conditions in the future.
2. Material and methods
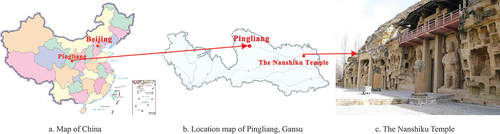
2.1. Environmental features of the Nanshiku Temple, Gansu, China
The samples were collected near the Nanshiku Temple in Gansu, China. The geographical location is shown in . The site lies in the southwest corner of the Ordos Basin, and pre-cretaceous strata are plentiful in the geological tectonic zone in close proximity. Due to water scouring, cretaceous sandstones are exposed in strips along both sides of the river channel in this area.
Figure 1. Location map of the Nanshiku Temple in Pingliang, Gansu, China.
The sandstone has the highest quartz content, and the feldspar content is roughly equivalent to the rock chip content, as shown in . The feldspar consists primarily of potassium feldspar and plagioclase, while the rock chips mainly consist of igneous rock chips. The filler is mostly composed of illite, which has a high content and appears in the form of thin films enveloping the main grains. The sandstone also contains small amounts of dolomite blocks, which act as cement. The sandstone has a loose structure, with significant development of inter-grain pore space and point contact between grains. The primary grain size ranges from 0.08 to 0.3 mm, and the grains are sub-rounded in shape. Overall, the surface of the sandstone samples is flat, with uniformly distributed particles of different sizes and a high degree of cementation, showing no significant differences between the samples.
Table 1. Analysis of rock minerals and their contents (%)
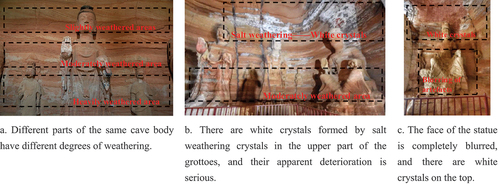
Extensive monitoring and analysis of the environmental conditions at the Nanshiku Temple revealed significant seasonal and cyclical fluctuations in temperature and humidity, with freeze-thaw cycles being one of the key factors contributing to the deterioration of the cave structures The stone artifacts located in the same area, or even different parts of the same artifact, are exposed to varied degrees of damage due to weathering because of different environmental factors, such as coverage, orientation, water content, and stress-strain conditions. The various states of weathering at Nanshiku Temple are depicted in . In addition, numerous white crystals appear on the surface of the rocks, and the artefacts could be subjected to salt weathering. In order to simulate sulphate weathering, rocks of varying levels of weathering were prepared by controlling the number of freeze-thaw cycles, as specified by the objective of this study.
Figure 2. Example map of the weathered state of the Nanshiku Temple, Gansu, China.
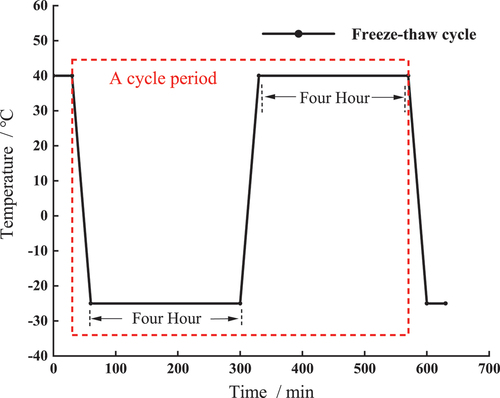
2.2. Freeze-thaw experimental scheme
Freeze-thaw cycle experiments was conducted by using a rapid temperature and humidity test chamber (RPS-408BT, Huanrui, Dongguan, China). The temperature range of the chamber was controlled within −40℃~120℃ with an error range of ± 1℃, and the rise and fall rate was up to 10℃/min, which fully met the experimental requirements. The stone samples were positioned in the testing chamber and completely immersed in pure water during the experiment process. According to the available documents, the temperature extremes was 36℃ and −23℃ in the last decade. Thus, in order to simulate the temperature extremes, the temperature in this test was set at 40℃ for the thawing phase and −25℃ for the freezing phase. After preparation, the samples were put into the test box. The freeze-thaw program: from 40℃ down to −25℃ in 0.5 h, freezing for 4 h; then from −25℃ up to 40℃ in 0.5 h, dissolving for 4 h, a cycle lasting 9 h, with temperature changes as shown in .
Figure 3. Diagram of freeze-thaw cycle temperature variation.
During the sample preparation, 42 fresh red sandstone samples with 50 mm cube dimensions were selected. 24 of them were divided into 6 groups and labelled as F1~F6, while the other 18 samples were also divided into 6 groups and labelled as C1 to C6. The stone samples were subjected to freeze-thaw tests 0, 5, 10, 15 and 20 to 25 times respectively, the number of freeze-thaws for the different groups of F and C series samples is shown in . Upon completion of the freeze-thaw tests, only the C series samples were subjected to the uniaxial compression destructive test and their strength values were used as a reference for the compressive strength of the F series samples.
Table 2. Table of group of stone samples.
2.3. Salt weathering simulation experiment
In this study, with regards to the studied region, the annual average atmospheric temperature and relative humidity are 19.5℃ and 68.96% respectively, with temperatures reaching a minimum in January and a maximum in July in a continuous cycle. The rainfall in the studied region is mainly occurred in June, July and August, as that the annual average precipitation is about 560 mm. In addition, the groundwater, surface water and atmospheric precipitation in the region were measured and analysed, and the anions were mainly SO42- and the cations were mainly Na+, and the PH value was weakly alkaline, Sodium sulphate crystallisation is one of the main factors contributing to the deterioration of the grotto. Selwitz and Doehne (Citation2002) and Lubelli et al. (Citation2018) found that there were many types of soluble salts that harm cultural heritage, among which Na2SO4 had the most significant and universal damage to cultural heritage. Thus, with regards to the site monitoring data from the South Grotto, the salt weathering simulation test was set up as follows:
Rock samples F1~F6 were submerged in saturated Na2SO4 solution for 12 h, then removed from the sample and the surface suspension was wiped off using a damp cloth. Subsequently, the stones were placed in a rapid temperature and humidity chamber for 36 h, with the temperature and humidity set at 20℃ and 65%. A soak-crystallise cycle is formed, with 48 h being the cycle. The stones were then placed in a saturated Na2SO4 solution and the cycle was repeated;
Salt weathering tests were conducted on samples with different freeze-thaw cycles, with all F series samples being subjected to 15 salt cycles. The samples were weighted and the wave velocity and surface hardness were measured at 5 times per salt cycle;
After the salt weathering tests, the macroscopic characteristics of specimens with different numbers of salt weathering cycles were photographed and recorded. Subsequently, a single compression test was conducted to study the failure modes of sandstone with different degrees of weathering and analyze the extent of strength decrease and its variation trend. Additionally, the micro structural characteristics of the surface of rock samples before and after salt weathering were observed using an electron scanning microscope.
2.4. Determination of basic physical parameters of stones
The samples were placed in a drying box at a temperature of 105℃ for 48 h until they reached a constant weight. Then, the samples were cooled naturally to room temperature inside the dryer. Subsequently, the samples were saturated for 48 h and then forced to drain for another 48 h. The natural saturated mass, completely saturated mass and immersion mass were weighed, and the basic physical parameters of the samples were calculated. During this process, the water absorption rate was calculated using formula (1), as follows:
Where Aw represents water absorption rate of stone sample (%), Mdry and Mwet represent mass of dried sample and mass of naturally saturated sample (G).
The open porosity is determined by EquationEquation (2)(2)
(2) (Moses, Robinson, and Barlo Citation2014; Wang et al. Citation2016):
In this formula, represents open porosity, which represents the ratio of the connected voids to the volume of the entire stone sample (%). Msat represents the mass (g) after the sample is saturated by boiling water method and wiped with water on the sample surface. Mw is the immersion mass (g) measured by immersing a saturated sample in water. The non-metallic ultrasonic tester (Koncrete NM-4B), Richter hardness tester (Botech BH200C) and electro-hydraulic universal testing machine (CSS-WAW 1000DL) were used to measure the wave velocity, hardness and uniaxial compressive strength of the rock, and the physical parameters of the stone samples were measured. The scanning electron microscope (Hitachi S-3000N) was used to observe the microstructure characteristics of the stone samples.
3. Results and discussion
3.1. Basic physical indicators of sandstones with different degrees of weathering
The basic physical parameters of stone samples are shown in . After undergoing the freeze-thaw cycle, no apparent cracks or chunks of the samples dropped, and their surface morphology remained unchanged. The overall morphology was similar to that of fresh stone.The touch sensation of the sample surface subjected to the freeze-thaw cycle became rough, and there was obvious particle loss at the edges and corners, and local slight damage. Thomas (Citation1938) found that freeze-thaw caused different degrees of changes in the physical parameters of the rocks, in particular, the mechanical parameters decayed significantly by studying. Powers (Citation1945) and Powers and Helmuth (Citation1953) found that during freeze-thawing, due to the inhomogeneous distribution of water within the rock, the water-rich areas are the first to induce fracture development when the volume expansion is 9%, and that the volume expansion theory is well suited to the hydrostatic pressure theory, with significant differences in the physical parameters of the rock for different numbers of freeze-thaws.
Table 3. Indicators of sandstone with different weathering degrees.
3.2. Weathering characteristics of macroscopic morphology
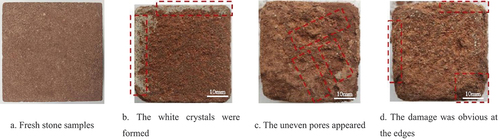
showed the surface deterioration characteristics of the stone samples under salt weathering. showed that the surface of the fresh rock samples appeared smooth, with uniform texture and a compact structure. As the salt weathering test progressed, the surface of the sample gradually generated white crystals, the color became dark and the original smooth surface became rough and uneven. Sodium sulfate tended to concentrate in the relatively weak cement of the samples, causing the mud masses to gradually fall off and form solution pits. These solution pits continuously widened and deepened along the bedding plane, resulting in the stratified cracking of the samples. This outcome is consistent with previous studies by Zhang et al., (Citation2021) and Barbera et al., (Citation2012). The primary factor causing this outcome was the saturated salt solution entering the pores, leading to the continuous creation of new cracks by the Na2SO4 crystal, which further promoted the absorption of the salt solution.
Figure 4. Surface degradation characteristics of stone samples under salt weathering.
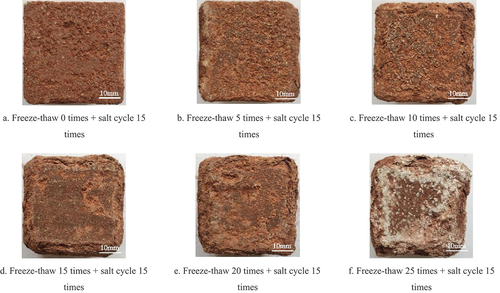
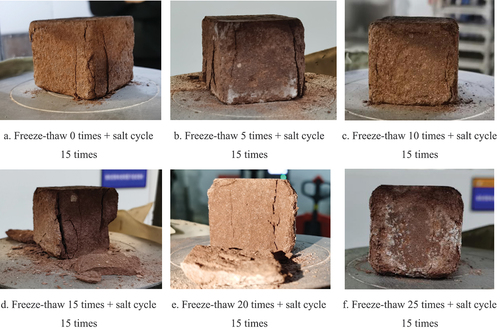
showed the macroscopic characteristics of F1~F6 stone samples after the salt weathering experiment. After 15 cycles of salt weathering, the stone samples indicated obvious deterioration characteristics, with a progressive damage trend extending from the surface layer to the interior (Barbera et al. Citation2012). The weathering morphology of each group was significantly distinctive, and the weathering degree was higher. The larger the damage degree of morphology, the more serious particle shedding. The sample with a high initial weathering degree had relatively large porosity and interpore connectivity. Under identical weathering conditions, more salt solution absorbed on the surface, generating greater extrusion pressure from salt crystallization.
Figure 5. Macroscopic characteristics of salt weathering cycles of stone samples with different weathering degrees after fifteen times.
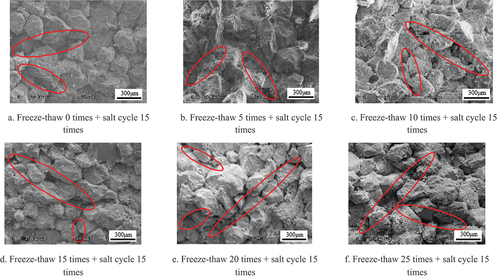
The samples with high weathering degrees had the more severe the softening of the surface and serious structure porosity. There was a strong correlation between stone deterioration rate and microstructure, and the change of microstructure, especially porosity, which was a key indicator for evaluating stone damage (Putnis and Mauthe Citation2001). The above analysis indicates that the macroscopic characteristics of the stone samples are differentiated among the different degrees of weathering, The microstructural degradation characteristics of the specimens after 15 cycles of common salt at different freeze-thaw times are shown in . As the degree of weathering increased, the degree of damage to the microscopic morphology of the stone samples deepened. In the 0th freeze-thaw sample (), the grains were relatively tightly packed, with cement filling in between the grains; and in the 5th freeze-thaw sample (), the sample was in a state of rapid deterioration, with inter-grain microfractures developing compared to the initial dense arrangement due to the physical damage caused by the hydrolysis of the cement and salt crystallisation. The surface of the grains was smooth and without any invisible particles, such as calcite attached to the surface. In the samples with 10 ~ 15 freeze-thaws (), the massive loss of cement allowed the formation of pores and the connection of fissures. Additionally, the feldspar and dolomite particles were fragmented by hydrolysis, producing fresh sections on the surface. Finally, at the time of destruction (), the fissures were entirely connected, the particles were cut by their dispersion, and some of them also developed internal fissures and became fragmented.
Figure 6. Microscopic morphology of stone samples under salt weathering.
3.3. Physical features
3.3.1. Mass loss rate
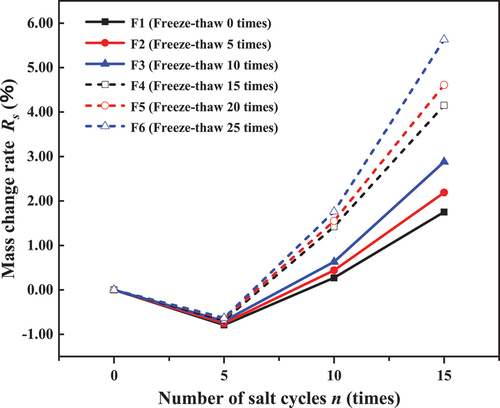
On the whole, the weathering results in a decreasing trend of stone mass, but in the process of salt weathering, the sample mass increased first and then decreased. The fracture induction has a controlling effect on the rapid increase in mass loss rate. The mass change rate is controlled by the following equation:
Where: Rs is the mass change rate; Mo is the sample mass at the initial moment; Mn is the sample mass at the nth cycle.
showed the curves of mass change during salt weathering of stones with different degrees of weathering. The results revealed that the mass of each sample increased with the increase of the number of cycles in the initial stage of salt weathering test. The primary factor was the continuous entry of Na2SO4 solution into the stone fissures, which caused an increase in sample mass. Salt weathering resulted in the loss of stone particles, but the damage primarily occurred after 5 cycles of salt weathering (Yan et al. Citation2013). In the middle and late stages of the test, particularly after 10 cycles of salt weathering, the particle shedding caused by salt weathering was dominant, leading to an increase in sample mass loss and decay rate. When the salt weathering cycle reached 15 times, the mass of each sample had certain attenuation. The mass change of samples in F1 and F2 groups was 1.75% and 1.90%, and that of samples in F3~F5 groups was 4.11%. The mass loss of samples in the F6 group was up to 5.63%, which was about three times that in the F1 and F2 groups. The higher the degree of initial weathering, the greater the mass loss and the greater the rate of mass change. The increase in initial weathering degree affected the mass loss to various degrees. This phenomenon may be due to the low surface hardness of the stone with a high initial weathering degree, reflecting the loose surface structure of the sample, resulting in more particle shedding during salt weathering.
Figure 7. Mass change rate curve of sample during salt weathering.
3.3.2. P-wave velocity
The variation of the longitudinal p-wave velocity of the rock samples with different numbers of freeze-thaws under the effect of sulphate is shown in . Under the influence of salt weathering, the p-wave velocity of samples decreased linearly, with the decreased rate of samples F4~F6 was slightly higher than that of samples F1~F3. To further analyse the variability of wave velocities of the F series samples under salt weathering, the wave velocity values of the samples are shown in . In the early stages of salt weathering tests, the deeper the initial weathering degree of the rock samples, the smaller the wave velocity, with a difference of 0.176 km/s between the F1 group and the F6 group. After 15 cycles of salt weathering, the wave velocity of rock samples in F1 group decreased by 0.386 km/s, and that of rock samples in F6 group decreased by 0.538 km/s. The difference between the two groups was nearly 0.152 km/s.
Figure 8. The measured and fitting curves of wave velocity during salt weathering.
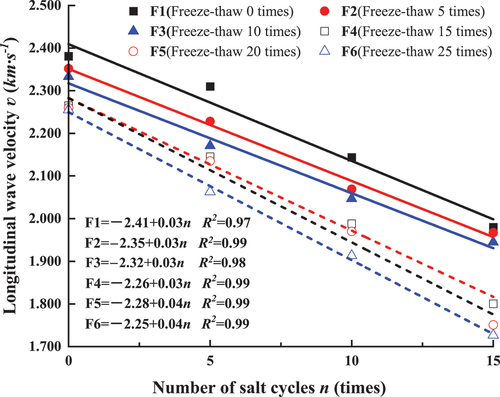
Table 4. Variation in wave velocity values of rock samples with different degrees of weathering under salt weathering.
Ruedrich and Siegesmund (Citation2007) and Barbera et al. (Citation2012) suggested that the physical damage caused by salt crystallization leads to a continuous loss of rock particles and an increase in interparticle fractures, resulting in a decrease in rock wave velocity values. The samples of the F1~F3 group had a low weathering degree, with a dense surface structure and small pores. Part of Na2SO4 crystals was blocked at the “throat” of the fracture, the hydrolysis of the mineral components within the stone is impeded, thus slowing down the deterioration of the stone to some extent (Kahraman Citation2007). This delay caused less damage to the sample structure than salt weathering, causing the wave velocity to show a relatively uniform downward trend. However, the samples of F4~F6 groups had relatively high weathering degrees and large pores, which were not enough to form a plugging condition. The deterioration of the internal structure of the samples caused by salt weathering was the main factor for the rapid decline of p-wave velocity (Wang and An Citation2017).
3.3.3. Surface hardness
The surface hardness variation curve of the salt weathering experimental stone sample is shown in . The surface hardness of samples with different weathering degrees decreased with the increase of the number of salt weathering cycles, but there was a great difference in the decreasing trend among each group. The samples of the F1~F3 group showed a trend of rapid first and then slow decline in the salt weathering test. Especially during 0–5 cycles of salt weathering, the surface hardness of samples decreased massively, and the hardness loss rate of several groups of samples was about 11.5% of the initial value. During the middle and late stages of the test, the hardness value decreased gradually. As more soluble salts were absorbed, Na2SO4 crystals concentrate on the stone surface, resulting in “the hardening” of the surface layer and delaying the weathering rate.
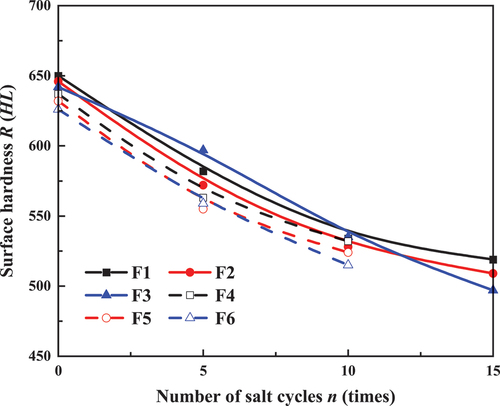
Figure 9. Surface hardness curves of samples during salt weathering.
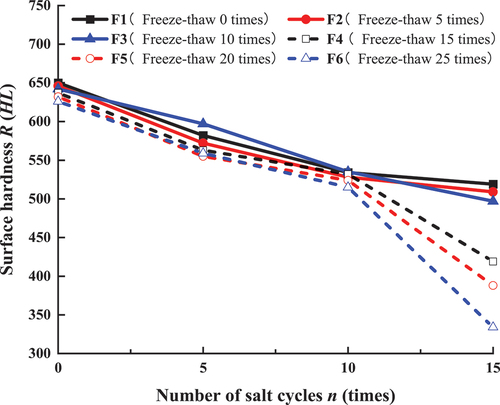
The variation trend of hardness values of samples in F4~F6 was almost the same as that of samples F1~F3 before 10 cycles of salt weathering. After 10 cycles of salt weathering, the hardness values of samples in F4~F6 groups decreased sharply. The initial weathering degree of the sample increased, and the deterioration rate of the surface structure became faster. When the salt weathering cycle was 15 times, the hardness of F6 group samples with the highest initial weathering degree decreased by 292 HL, which was about 0.5 times of the hardness of F6 group samples before salt weathering, and the hardness of F4 group samples with the lowest decline was also 0.3 times of its initial hardness. This phenomenon may be caused by the continuous growth of crystals in the pores of the sample, and the surface began to produce free energy. The increase of free energy gradually limited the growth of crystals, which was equivalent to applying mechanical force to the crystals. The mechanical force caused an increase in solubility and increased the concentration around the crystals, thus promoting the formation of crystals. The crystal extrusion pressure reached the “critical point” of the load that the stone structure can bear, which was repeated continuously, causing a drastic change of the surface structure of the sample (Jiang, Guo, and Huang Citation2021).
After undergoing 10 cycles of salt weathering, the surface morphology of the sample with a high weathering degree was significantly damaged, and the hardness value could not even be measured in some areas. At this time, the measured surface hardness value could not accurately reflect the normal attenuation of the sample’s surface structure. Therefore, the hardness values of samples in the F1 to F3 and F4 to F6 groups that underwent the first 10 cycles were selected for fitting. As shown in , the trend of surface hardness variation in sandstone with different initial weathering degrees under salt weathering was essentially uniform with the curve obtained from fitting. There existed a good logarithmic function between the surface hardness of sandstone and the number of salt weathering cycles:
Figure 10. Surface hardness measured and deterioration model curves.
Where, fN is the surface hardness (HL) of the stone samples, n is the number of cycles.
In this experiment, it was observed that after 15 salt cycles, the surface layer of the stone sample became almost completely detached, resulting in the loss of artistic appreciation of the artifacts.Therefore, it can be concluded that further experiments in this regard may be unnecessary. Overall, the above functional relationships approximate the decay of hardness values for sandstones of different degrees of weathering, and reveal the changes in the surface structure of sandstone-like artifacts under salt weathering. Based on the fact that salt crystallization causes damage to the sandstone from the outside, it can be anticipated that, once salt weathering experiments continue until the stone is completely destroyed, the change in hardness values might show a cyclical logarithmic decay. However, further experiments such as the uniaxial compression experiment are required to verify this.
3.4. Uniaxial compression experiment
3.4.1. Failure characteristics of uniaxial compression
After the salt weathering experiment, the samples from F1 to F6 groups were subjected to uniaxial compression experiment. showed the uniaxial compression damage characteristics of rock samples after 15 salt cycles with different freeze-thaw counts, and it can be found that there were distinct variations between the samples. F1 and F2 groups of stone samples were compressed with fractures concentrated on the lateral sides of the specimens, with flakes falling off and obvious brittle damage characteristics, and the integrity of the specimens was strong after damage; F3 groups of stone samples had fractures mostly at the heavily chalked lateral sides; F4 and F5 groups of stone samples were compressed along their axis into two halves, displaying multiple fractures across the blocks and compromised integrity subsequent to the damage; F6 groups of stone samples were compressed The rest of the sample was not significantly damaged. The discrepancies in the uniaxial compression damage patterns across sandstones with varying degrees of weathering were evident. This divergence can be attributed mainly to the continued expansion of the internal cracks of the samples as the degree of weathering increased. The softening of the samples also increased as the degree of weathering intensified, further compromising the samples’ integrity. The above analysis reveals that there are significant differences in the failure modes of rock samples with different degrees of weathering after uniaxial compression. As the initial weathering degree deepens, micro-cracks inside the sandstone samples gradually develop from the edges towards the interior. Moreover, the overall softening behavior of the samples notably increases, which also indicates that sulfate crystallization contributes to the progressive deterioration of the sandstone samples from the surface to the interior.
Figure 11. Failure characteristics of F1~F6 samples under uniaxial compression after salt weathering.
3.4.2. Change analysis of uniaxial compressive strength
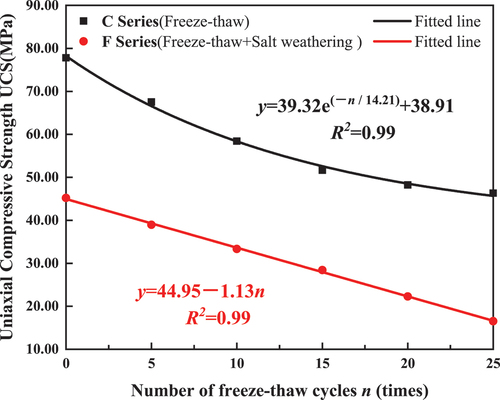
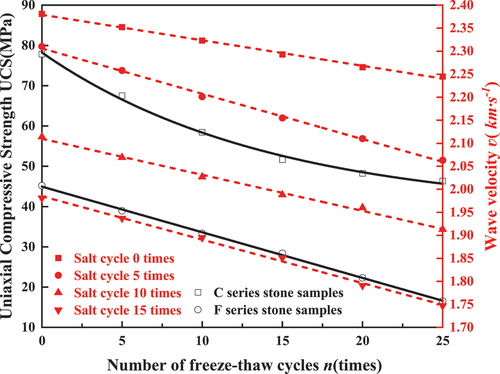
As indicated in , the uniaxial compressive strength (UCS) of sandstone under freezing-thawing decreases with the increase of the number of freezing-thawing cycles, and the decrease range between samples gradually decreased, which was consistent with previous research results (Shi, Li, and Zhao Citation2021). The UCS of F1~F6 group samples decreased with the increase of the initial weathering degree when the same salt weathering was superimposed based on different freezing-thawing cycles. Compared with their corresponding initial values, the higher the initial weathering degree of the sample, the greater the attenuation. After 15 cycles of salt weathering, the UCS of the F1 group was measured to change from 77.8MPa to 45.19MPa, reducing by 41.92%. The UCS of sample F6, with the highest initial weathering degree, decreased from 47.33MPa to 16.52MPa, which corresponds to a decrease of 30.81MPa or 65.11% of the initial value. In comparison, the remaining samples decreased by approximately 20MPa relative to their corresponding initial values. Typically, rocks with high initial strength have a better microstructure and are less susceptible to damage by sulphate crystallisation damage, and the degree of initial rock weathering is an important parameter in assessing rock re-weathering (Pápay, Rozgonyi-Boissinot, and Török Citation2021).
Figure 12. UCS curve of sandstone under different weathering.
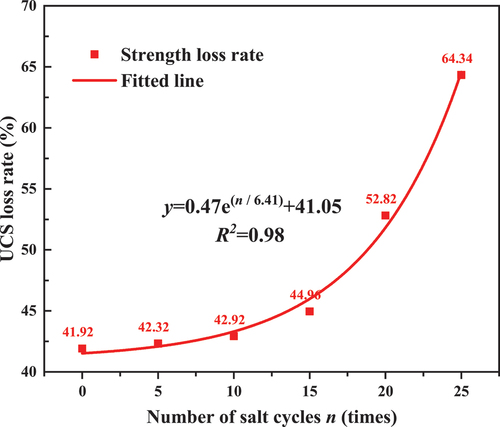
As shown in , the form of stone damage gradually transforms from brittle to flimsy with an increase in the number of freeze-thaws. further accentuates that the rate of strength loss before and after salt weathering increases exponentially with the number of freeze-thaw cycles. For rock samples subjected to 0–15 cycles of freezing and thawing, the strength loss rate is around 43% after 15 cycles of salt weathering, with little differentiation between them. For rock samples subjected to 20 or more cycles of freezing and thawing, the strength loss rate increases significantly, reaching 64.34% for rock samples subjected to 25 cycles of freezing and thawing. This reflects the fact that the UCS of highly weathered rock samples decreases more rapidly under the same salt weathering effect. With the rate of decline in strength values changing from rapid to slow. The critical parts of the caves, cliff statues and other large volumes of artifacts assume the role of overall stability. Results from tests have shown that salt weathering wreaks havoc on sandstone artifacts. Otherwise, when deterioration reaches a certain point, even if only a single fissure appears, the micro structure of the stone was severely sparse, it may indicate that the whole area has deteriorated completely and need to be protected.
Figure 13. Curves for the rate of loss of UCS of stones before and after salt weathering.
4. Relationship between mechanical properties and other weathering indexes
The uniaxial UCS under salt weathering is an accurate representation of the degree of sandstone weathering, and the strength values are referenced to indicators to qualitatively assess the accuracy and applicability of non-destructive indicators through lossy indicators. Considering the precious and uniqueness of stone cultural heritage, most of the existing studies evaluated the damage degree of stone by testing non-destructive indexes of stone in situ, and proved by laboratory tests (André et al. Citation2008; Meng et al. Citation2018; Waragai Citation2016). In this study, on the basis of laboratory tests, strength parameters were used as reference indexes to evaluate the accuracy of nondestructive indexes such as wave velocity and hardness, and then to explore the factors affecting the accuracy.
shows the comparison curve of rock sample strength and wave velocity under sulfate erosion. It can be seen that with the increase of salt weathering cycles, both weathering indicators of rock samples in different weathering states gradually decrease, and the rate of change is similar. The strength value reflects the magnitude of the rock sample’s mechanical properties, while the longitudinal wave velocity mainly reflects the internal deterioration. These two indicators are relatively less affected by the surface damage characteristics, microscopic structure, and salt absorption of the rock sample, making them capable of accurately reflecting the weathering state of the rock. Furthermore, to study the weathering of stones, especially when refining the assessment of the degree of weathering of artifacts, the integrated determination of wave velocity values and the inference of strength values based on quantitative links can accurately reflect the situation of stone mechanical parameters.
Figure 14. The curves of UCS and wave velocity were compared during the experiment.
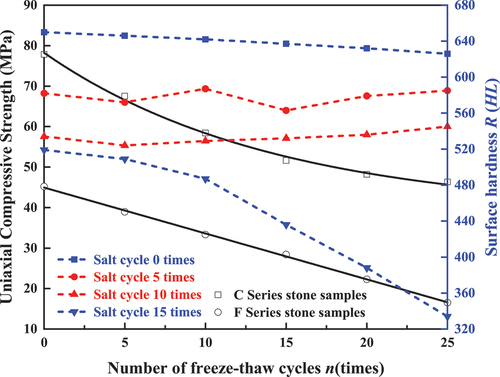
The curves of strength versus hardness values for stone samples under sulphate action are shown in . Regarding the strong values, salt cycling 0 versus 15 times, the hardness values can accurately reflect the weathering of the stone, and the trend of change is consistent with the strength values. The macroscopic indicators at the beginning of the test all decrease with increasing weathering of the stone, indicating a quantitative and qualitative correlation between lossy indicators (mechanical parameters) and non-destructive indicators (such as hardness and p-wave velocity), accurately reflecting the artifact’s weathering (Menéndez Citation2016). In contrast, there is no pattern in the variation of hardness values for stone samples with different degrees of weathering at 5 and 10 salt cycles, especially at 10 salt cycles, when hardness values instead increase with deepening weathering. With the development of the test, the surface hardness of the samples changed dramatically due to the salt crystallization under the action of salt weathering, which led to the phenomenon that the hardness value dropped precipitously or the stone with high weathering degree hardened by salt adsorption and its hardness value increased. It can be concluded that the surface hardness cannot completely reflect the weathering of the stone, and the accuracy of reflecting the weathering degree had a certain relationship with the weathering mode and depth. While surface hardness can accurately reflect the degree of weathering in the initial stages of weathering, it has its limitations in applying that range after weathering deepens, regardless of the weathering mode.
Figure 15. The curves of UCS and surface hardness were compared during the experiment.
5. Conclusion
In this study, different weathering degrees of sandstone samples were prepared by controlling the number of freezing and thawing cycles, and they were used as the research objects for conducting simulated experiments on sulfate weathering. The experimental design was based on the climatic conditions of the grotto’s location. During the experimental process, the differences between the results of six groups of examples with the different initial states under the same weathering action were compared and analyzed. The deterioration characteristics and the change rules of weathering indexes were explored. The main conclusions are as follows:
Freeze-thaw cycles successfully constructed stones with different weathering degrees, with significant differences in physical parameters such as porosity, capillary water coefficient, wave velocity, surface hardness, and uniaxial compressive strength.
Under the effect of salt weathering, the surface morphology of stone was significantly damaged, including particle shedding, damage at edges and corners, powderization and dissolution. Layered cracking occurred in the sample, which was manifested as progressive damage extending from the surface layer to the interior. The samples with a high initial weathering degree showed obvious deterioration characteristics. The higher the weathering rate, the greater the decline of the weathering indexes, including mass, wave velocity and compressive strength.
The surface hardness decreased with the increase of the number of salt weathering cycles, showing a nonlinear downward trend of fast first and then slow. In the early stages of weathering, the attenuation process can be approximately analyzed by logarithmic function, and the whole weathering process may show a trend of periodic logarithmic attenuation.
The mechanical indicators are less influenced by other factors and provide a more accurate indication of the degree of weathering of the stone sample. Strength is used as a reference indicator to qualitatively assess the applicability of non-destructive indicators such as wave velocity and hardness. Wave velocity and strength indicators are strongly linked and corroborate each other. The reliability of surface hardness is affected by the mechanisms of weathering damage, the degree of weathering of the stone sample, the characteristics of the damage, and the thickness of the weathering layer, thus limiting its applicability.
Disclosure statement
No potential conflict of interest was reported by the author(s).
Data availability statement
Data Sharing is not applicable.
Additional information
Funding
Notes on contributors
Yun Dong
Dr. Yun Dong is a professor in the Faculty of Architecture and Civil Engineering at Huaiyin Institute of Technology, China. Dr Dong received his Master's degree from Chongqing Jiaotong University, China, and received his Ph.D degree from Hohai University, China. He has more than 20 years of professional and research experience in environment and protection of architectural heritage.
Ningbo Peng
Dr. Ningbo Peng is an associate professor in the Faculty of Architecture and Civil Engineering at Huaiyin Institute of Technology, China. Dr Peng received his Master's degree and Ph.D degree from Lanzhou University, China. His professional and research are mainly focused on the architectural heritage and geo-heritage conservation.
Jie Hong
Jie Hong is currently enrolled as a Ph.D candidate in the Institute for Conservation of Cultural Heritage at Shanghai University, China. He received his Master's degree from the Faculty of Architecture and Civil Engineering at Huaiyin Institute of Technology. His research interests include the preservation of cultural heritage and architectural heritages.
Hengrui Liu
Hengrui Liu received his Master's degree from the College of Water Conservancy and Hydropower Engineering at Hohai University. His research interests include the preservation of hydraulic heritage.
Le Tang
Dr. Le Tang is an associate professor in the Faculty of Architecture and Civil Engineering at Huaiyin Institute of Technology, China. Dr Tang received his Master's degree from Cardiff University, and received Ph.D degree from Liverpool University. His professional and research experience is mainly about urban renewal and historic architecture preservation.
Bo Sun
Bo Sun is currently enrolled as a Ph.D candidate in Lanzhou University. He is also employed at Heritage protection science and Innovation Center, Northwest Research Institute Co. Ltd. of China Railway Engineering Corporation. His research interests include cultural heritage preservation.
References
- André, M. F., S. Etienne, D. Mercier, F. Vautier, and O. Voldoire. 2008. “Assessment of Sandstone Deterioration at Ta Keo Temple (Angkor): First Results and Future Prospects.” Environmental Geology 56 (3–4): 677–688. https://doi.org/10.1007/s00254-008-1408-8.
- André, M. F., B. Phalip, O. Voldoire, F. Vautier, Y. Ge, M. Benbakkar, C. Constantin, F. Huber, and G. Morvan. 2011. “Weathering of Sandstone Lotus Petals at the Angkor Site: A 1,000-Year Stone Durability Trial.” Environmental Earth Sciences 63 (7–8): 1723–1739. https://doi.org/10.1007/s12665-010-0734-9.
- Barbera, G., G. Barone, P. Mazzoleni, and A. Scandurra. 2012. “Laboratory Measurement of Ultrasound Velocity During Accelerated Aging Tests: Implication for the Determination of Limestone Durability.” Construction and Building Materials 36:977–983. https://doi.org/10.1016/j.conbuildmat.2012.06.029.
- Bayram, F. 2012. “Predicting Mechanical Strength Loss of Natural Stones After Freeze-Thaw in Cold Regions.” Cold Regions Science and Technology 83-84:98–102. https://doi.org/10.1016/j.coldregions.2012.07.003.
- Eslami, J., C. Walbert, A. Beaucour, A. Bourges, and A. Noumowe. 2018. “Influence of Physical and Mechanical Properties on the Durability of Limestone Subjected to Freeze-Thaw Cycles.” Construction and Building Materials 162:420–429. https://doi.org/10.1016/j.conbuildmat.2017.12.031.
- Everett, D. H. 1961. “The Thermodynamics of Frost Damage to Porous Solids.” Transactions of the Faraday Society 57:1541–1551. https://doi.org/10.1039/tf9615701541.
- Fang, Y., L. Qiao, X. Chen, S. Yan, G. Zhai, and Y. Liang. 2014. “Experimental Study of Freezing-Thawing Cycles on Sandstone in Yungang Grottos.” Rock and Soil Mechanics 35 (9): 2433–2442.
- Gan, L. 2014. “Temporal and Spatial Distribution Characters of Historic Relics in China’s Minority Areas: An Analysis on Important Historical Monuments Under Special Preservation of National Autonomous Area.” Guizhou Ethnic Studies 35 (7): 48–52.
- Geng, H., S. Zhang, J. Zhi, R. Zhang, J. Ren, and C. Ro. 2019. “Acid Solution Decreases the Compressional Wave Velocity of Sandstone from the Yungang Grottoes, Datong, China.” Heritage Science 7 (1): 4–15. https://doi.org/10.1186/s40494-019-0245-2.
- Germinario, L., and C. T. Oguchi. 2021. “Underground Salt Weathering of Heritage Stone: Lithological and Environmental Constraints on the Formation of Sulfate Efflorescences and Crusts.” Journal of Cultural Heritage 49 (3): 85–93. https://doi.org/10.1016/j.culher.2021.02.011.
- Gholamreza, K., Z. Reza, and A. Yasin. 2015. “The Effect of Freeze-Thaw Cycles on Physical and Mechanical Properties of Upper Red Formation Sandstones, Central Part of Iran.” Arabian Journal of Geosciences 8 (8): 5991–6001. https://doi.org/10.1007/s12517-014-1653-y.
- Graue, B., S. Siegesmund, P. Oyhantcabal, R. Naumann, T. Licha, and K. Simon. 2013. “The Effect of Air Pollution on Stone Decay: The Decay of the Drachenfels Trachyte in Industrial, Urban, and Rural Environments-A Case Study of the Cologne, Altenberg and Xanten Cathedrals.” Environmental Earth Sciences 69 (4): 1095–1124. https://doi.org/10.1007/s12665-012-2161-6.
- Jamshidi, A., M. R. Nikudel, and M. Khamehchiyan. 2013. “Predicting the Long-Term Durability of Building Stones Against Freeze-Thaw Using a Decay Function Model.” Cold Regions Science and Technology 92:29–36. https://doi.org/10.1016/j.coldregions.2013.03.007.
- Jiang, G., F. Guo, and J. Huang. 2021. “Acceleration and Mitigation of Sandstone Weathering in the Yungang Grottoes for More Than One Millennia.” Zeitschrift für Geomorphologie, Supplementary Issues 62 (3): 301–314. https://doi.org/10.1127/zfg_suppl/2021/0700.
- Kahraman, S. 2007. “The Correlations Between the Saturated and Dry P-Wave Velocity of Rocks.” Ultrasonics 46 (4): 341–348. https://doi.org/10.1016/j.ultras.2007.05.003.
- Khodabandeh, M. A., and N. Rozgonyi-Boissinot. 2022. “The Effect of Salt Weathering and Water Absorption on the Ultrasonic Pulse Velocities of Highly Porous Limestone.” Periodica Polytechnica Civil Engineering 66 (2): 627–639. https://doi.org/10.3311/PPci.18647.
- LI, H. 2011. “Classification of Deterioration States of Historical Stone Relics and Its Application.” Sciences of Conservation and Archaeology 23 (1): 1–6.
- Lubelli, B., V. Cnudde, T. Diaz-Goncalves, E. Franzoni, R. P. J. van Hees, I. Ioannou, B. Menendez, et al. 2018. “Towards a More Effective and Reliable Salt Crystallization Test for Porous Building Materials: State of the Art.” Materials and Structures 51 (2): 55–76. https://doi.org/10.1617/s11527-018-1180-5.
- Menéndez, B. 2016. “Estimation of Salt Mixture Damage on Built Cultural Heritage from Environmental Conditions Using Ecos-Runsalt Model.” Journal of Cultural Heritage 52 (24): 22–30. https://doi.org/10.1016/j.culher.2016.11.006.
- Meng, T., Y. Lu, G. Zhao, C. Yang, J. Ren, and Y. Shi. 2018. “A Synthetic Approach to Weathering Degree Classification of Stone Relics Case Study of the Yungang Grottoes.” Heritage Science 6 (1): 1–7. https://doi.org/10.1186/s40494-017-0165-y.
- Moses, C., D. Robinson, and J. Barlo. 2014. “Methods for Measuring Rock Surface Weathering and Erosion: A Critical Review.” Earth Science Reviews 135:141–161. https://doi.org/10.1016/j.earscirev.2014.04.006.
- Nasri, F., A. Boumezbeur, and D. Benavente. 2019. “Influence of the Petrophysical and Durability Properties of Carbonate Rocks on the Deterioration of Historic Constructions in Tebessa (Northeastern Algeria).” Bulletin of Engineering Geology and the Environment 78 (6): 3969–3981. https://doi.org/10.1007/s10064-018-1410-7.
- Niu, C., Z. Zhu, L. Zhou, X. Li, P. Ying, Y. Dong, and S. Deng. 2021. “Study on the Microscopic Damage Evolution and Dynamic Fracture Properties of Sandstone Under Freeze-Thaw Cycles.” Cold Regions Science and Technology 191:103328. https://doi.org/10.1016/j.coldregions.2021.103328.
- Oguchi, C., and S. Yu. 2021. “A Review of Theoretical Salt Weathering Studies for Stone Heritage.” Progress in Earth and Planetary Science 8 (1): 32–55. https://doi.org/10.1186/s40645-021-00414-x.
- Pápay, Z., N. Rozgonyi-Boissinot, and Á. Török. 2021. “Freeze–Thaw and Salt Crystallization Durability of Silica Acid Ester Consolidated Porous Limestone from Hungary.” Minerals 11 (8): 824–842. https://doi.org/10.3390/min11080824.
- Park, K., K. Kim, K. Lee, and D. Kim. 2020. “Analysis of Effects of Rock Physical Properties Changes from Freeze-Thaw Weathering in Ny-Ålesund Region: Part 1-Experimental Study.” Applied Sciences 10 (5): 1707. https://doi.org/10.3390/app10051707.
- Powers, T. C. 1945. “TA Working Hypothesis for Further Studies of Frost Resistance of Concrete.” Journal of the American Concrete Institute 16 (4): 45–272.
- Powers, T. C., and R. A. Helmuth. 1953. “Theory of Volume Changes in Hardened Portland Cement Paste During Freezing.” Proceedings Highway Research 32 (1): 285–297.
- Putnis, A., and G. Mauthe. 2001. “The Effect of Pore Size on Cementation in Porous Rocks.” Geofluids 1 (1): 37–41. https://doi.org/10.1046/j.1468-8123.2001.11001.x.
- Rodriguez, N., E. Doehne, and E. Sebastian. 2000. “How Does Sodium Sulfate Crystallize Implications for the Decay and Testing of Building Materials.” Cement and Concrete Research 30 (10): 27–34. https://doi.org/10.1016/S0008-8846(00)00381-1.
- Ruedrich, J., and S. Siegesmund. 2007. “Salt and Ice Crystallisation in Porous Sandstones.” Environmental Geology 52 (2): 225–249. https://doi.org/10.1007/s00254-006-0585-6.
- Selwitz, C., and E. Doehne. 2002. “The Evaluation of Crystallization Modifiers for Controlling Salt Damage to Limestone.” Journal of Cultural Heritage, (3): 205–216. https://doi.org/10.1016/S1296-2074(02)01182-2.
- Shi, Z., J. Li, and Y. Zhao. 2021. “Study on Damage Evolution and Constitutive Model of Sandstone Under the Coupled Effects of Wetting-Drying Cycles and Cyclic Loading.” Engineering Fracture Mechanics 253 (5): 83–97. https://doi.org/10.1016/j.engfracmech.2021.107883.
- Tan, X., W. Chen, J. Yang, and J. Cao. 2011. “Laboratory Investigations on the Mechanical Properties Degradation of Granite Under Freeze-Thaw Cycles.” Cold Regions Science and Technology 68 (3): 130–138. https://doi.org/10.1016/j.coldregions.2011.05.007.
- Theoulakis, P., and A. Moropoulou. 1997. “Microstructural and Mechanical Parameters Determining the Susceptibility of Porous Building Stones to Salt Decay.” Construction and Building Materials 11 (1): 65–71. https://doi.org/10.1016/S0950-0618(96)00029-3.
- Thomas, W. N. 1938. Experiments on the Freezing of Certain Buildings Materials. Building Research, Technical Paper N 17.
- Wang, Z., and Z. An. 2017. “Theoretical Modeling of Thermal Expansion Mechanism of Salt-Bearing Rocks.” Arabian Journal of Geosciences 10 (23): 526–530. https://doi.org/10.1007/s12517-017-3322-4.
- Wang, P., Y. Jin, S. Liu, S. Liu, and H. Wang. 2016. “A Prediction Model for the Dynamic Mechanical Degradation of Sedimentary Rock After a Long-Term Freeze-Thaw Weathering: Considering the Strain-Rate Effect.” Cold Regions Science & Technology 131:16–23. https://doi.org/10.1016/j.coldregions.2016.08.003.
- Wang, L., S. Nagarajaiah, W. Shi, and Y. Zhou. 2022. “Seismic Performance Improvement of Base-Isolated Structures Using a Semi-Active Tuned Mass Damper.” Engineering Structures 271:114963. https://doi.org/10.1016/j.engstruct.2022.114963.
- Wang, L., W. Shi, and Y. Zhou. 2022. “Adaptive-Passive Tuned Mass Damper for Structural Aseismic Protection Including Soil-Structure Interaction.” Soil Dynamics and Earthquake Engineering 158:107298. https://doi.org/10.1016/j.soildyn.2022.107298.
- Waragai, T. 2016. “The Effect of Rock Strength on Weathering Rates of Sandstone Used for Angkor Temples in Cambodia.” Engineering Geology 207:24–35. https://doi.org/10.1016/j.enggeo.2016.04.006.
- Wen, L., J. Shen, S. Mei, Y. Huang, X. Tang, and Z. Kou. 2020. “Study on Quality Evaluation Method of Freeze-Thaw Damaged Rock Mass.” Mining Research & Development 40 (12): 57–63.
- Wilhelm, K., H. Viles, and B. Ó. 2016. “Low Impact Surface Hardness Testing (Equotip) on Porous Surfaces-Advances in Methodology with Implications for Rock Weathering and Stone Deterioration Research.” Earth Surface Processes and Landforms 41 (8): 1027–1038. https://doi.org/10.1002/esp.3882.
- Yan, S., Y. Fang, J. Liu, and S. Tan. 2013. “Deterioration Experiment with Soluble Salt on Sandstone of Yungang Grottoes and Its Model Creation.” Rock and Soil Mechanics 34 (12): 3410–3416.
- Yang, H. J., P. Liu, B. Sun, Z. Yi, J. Wang, and Y. Yue. 2021. “Study on Damage Mechanisms of the Microstructure of Sandy Conglomerate at Maijishan Grottoes Under Freeze-Thaw Cycles.” Chinese Journal of Rock Mechanics & Engineering 40 (3): 545–555.
- Zhang, J. 2008. “Research into the Mechanism of Disease of Stone Artefacts.” Sciences of Conservation and Archaeology 20 (2): 60–67.
- Zhang, J., J. Huang, J. Liu, S. Jiang, L. Li, and M. Shao. 2018. “Surface Weathering Characteristics and Degree of Niche of Sakyamuni Entering Nirvana at Dazu Rock Carvings, China.” Bulletin of Engineering Geology and the Environment 78 (6): 3891–3899. https://doi.org/10.1007/s10064-018-1424-1.
- Zhang, H., S. Yang, B. Sun, and J. Zhu. 2021. “Research on the Relationship Between Salt Damage Types and Evaporation Rate of Stone Relics.” Chinese Journal of Rock Mechanics & Engineering 40 (S2): 3284–3294.
- Zhou, X., and F. Gao. 2015. “Study and Non-Destructive or Qudsi-Nondestructive Testing Methods on Weathering Diseases of Stone Cultural Relics.” China Cultural Heritage Scientific Research 10 (2): 68–75.