
 ?Mathematical formulae have been encoded as MathML and are displayed in this HTML version using MathJax in order to improve their display. Uncheck the box to turn MathJax off. This feature requires Javascript. Click on a formula to zoom.
ABSTRACT
In order to accurately optimize the structural parameters of steel bridge deck(OSD), an optimal design method of continuous steel box girder bridge deck based on response surface method is proposed. Optimization design process includes full scale model test, finite element analysis, response surface function fitting and design parameter optimization. The orthotropic steel bridge deck’s deck thickness, stiffener thickness, diaphragm thickness, stiffener height, and diaphragm opening form are chosen as independent variables, and the internal forces of important structural components discovered are used as dependent variables. Design-Expert software created a five-factor, three-level response surface test. A multivariate quadratic response surface regression model between structural parameters and target response values was developed after the objective function and constraint criteria were identified. Numerical theory’s variance analysis was used to find the best combination, and Design Expert software was used to confirm it to make sure the design value was accurate. The findings indicate that optimized structural parameters are trustworthy because the difference between the predicted value and the theoretical value is less than 5%. An orthotropic steel bridge deck’s structural parameters can be optimized using the response surface approach. It serves as a reference for subsequent steel bridge deck design and construction.
1. Introduction
With the rapid development of society and a sharp increase in traffic volume, bridge decks have always been the primary focal point of bridge-related issues. As the direct load-bearing components, bridge decks are directly exposed to external loads and operate in complex working conditions, enduring vehicle loads, rain and snow loads, wind loads, and other environmental factors. Compared to other components of bridges, bridge decks are more susceptible to the influence of environmental factors. As a structural form of large and medium-span steel bridge decks (OSD), the orthotropic steel bridge deck has a wide range of applications in all types of bridges due to its lightweight, high strength, exceptional spanning capacity, convenient construction, and short construction time. The use of orthotropic steel bridge decks has become an integral part of the development and construction of steel structures in some countries (Chang-Kook et al. Citation2011). In the 1930s, the orthotropic steel bridge deck was invented, and the Feldcoeg bridge in Germany was responsible for its mechanical characteristics. The Seven Bridge, constructed in 1966, is the first suspension bridge in the world with orthotropic steel decks and the first bridge with deck cracking (Wolchuk Citation1990). Both the Akashi Strait Bridge, constructed in 1998, and the Dodoro Bridge, constructed in 1999, feature orthotropic steel bridge decks. Long-span bridges with orthotropic steel bridge decks have demonstrated great promise (de Jong Citation2005). Due to the recent increase in traffic volume, the bridge deck is susceptible to fatigue failure and cracking under a repeated wheel load. Problems such as cracking at the junction of each component and the arc opening of the diaphragm, are becoming increasingly severe. GURNEY T studied the primary reasons for the cracking of steel bridge decks, which are as follows: the deck directly bears the repeated action of wheel load; the stress of steel bridge decks is complex and stress concentration is greater, and there are few experimental data for reasonable optimization of structural parameters. Firstly, there is the issue of the load-bearing performance (cracking) of steel bridge decks, followed by the optimization of bridge deck structural parameters, and finally, the issue of the availability of bridge structures under external excitations (Shi et al. Citation2019, Weixing; Shi, Wang, and Lu Citation2018; Wang, Zhou, and Weixing Citation2023, Citation2023). These three types of issues have become global issues, impeding the advancement of steel bridge deck (Ahmadivala et al. Citation2022; Battista, Pfeil, and Carvalho Citation2008; Duchaczek and Mańko Citation2017; Fisher and Barsom Citation2016; Miki Citation2006; Su, Nassif, and Xia Citation2018; Xiao et al. Citation2005). Researchers have proposed several solutions to the problem of steel bridge decks under load, but the effect is minimal. Currently, single variable analysis dominates the optimization of structural parameters of steel bridge decks. The combination of each design parameter level is obtained by changing a single parameter to analyze the experimental design without considering the interaction between the design parameters. The optimization accuracy is not high, and the effect is not ideal.
Professor Wang Liangkun led a team to develop the Tuned Mass Damper (TMD), which effectively improves the performance of bridges by readjusting parameters through the reconfiguration of mass (Wang, Zhou, and Weixing Citation2023; Wang, Wang, and Shi Citation2021, Liangkun; Wang, Wang, and Shi Citation2021, Liangkun; Wang et al. Citation2020; Wang, Zhou, and Weixing Citation2023; Zhang, Wang, and Shi Citation2023). Sim used six full-scale orthodeck specimens to evaluate the effects of both weld melt-through and measures of distortion control on the fatigue resistance of the rib-to-deck plate welded junction and found that there was no crack at the weld. whereas pre-cambering was advantageous in fatigue resistance, full penetration weld roots (Sim Citation2009). C. S. Krishnamoorthy proved the potential application of genetic algorithm in structural optimization of steel bridges (C. S. Krishnamoorthy Citation2001). Based on fatigue performance and structural weight, Wang Zhiwen proposed the structural parameter optimization process for an orthotropic steel deck (OSD) and investigated the effects of individual factors such as deck thickness, stiffener thickness, diaphragm thickness, and longitudinal rib thickness on fatigue stress (Wang Zhiwen et al. Citation2022).Compared to the studies conducted by Alberto M, C.O. Orangun & T.A. Akeju, Long Kai, Wu Fangxiang, and others, this research analyzes the sensitivity of structural internal force characteristics to single-factor parameters, revealing the internal force characteristics of orthotropic steel bridge decks (Martins, Simões, and Negrão Citation2016; Orangun and Akeju Citation1977; Kai et al. Citation2021, Fangxiang; Wu Citation2018). Furthermore, the study employs response surface methodology to consider the interactions among multiple factors. Through a combination of full-scale model testing and refined finite element simulation, the study optimizes structural parameters to enhance load-carrying capacity, internal force distribution, and overall durability of the structure.
2. Full-scale segmental model
2.1. Full-scale model specimen
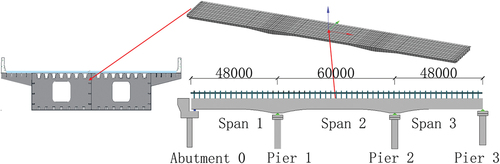
This study is based on a proposed steel box-girder bridge that would be part of an urban elevated system. The upper structure of the main beam is a 48 m +60 m +48 m steel box girder. The full width of the bridge is 13.5 m, and the steel box girder adopts a single box double chamber section. The bridge layout is shown in . The main structural material of the steel box girder is Q345qe which yield stress 345MPa (China Iron and Steel Industry Association Citation2018).
Figure 1. Bridge layout (unit: mm).
To accurately analyze the stress characteristics of the structure, this study employs a full-scale model test of a steel box girder. The steps are to choose the type of test model, figure out its size parameters, make the model loading scheme, and draw the test points and load arrangement diagram.
Referring to the proposed project, the size of the full-scale model test specimen is set, and the material is the same kind of steel in the project. Referring to the design drawings of orthotropic steel bridge deck, the full-scale model specimens were manufactured by steel welding method. Full-size models of continuous steel box girder steel bridge decks with 8 mm stiffeners, 300 mm upper mouth width, 180 mm lower mouth width, 280 mm height, and 30 mm standard spacing. The specimen design parameters are shown in , and the model specimen is shown in .
Figure 2. Full-scale model specimen of the steel bridge deck.
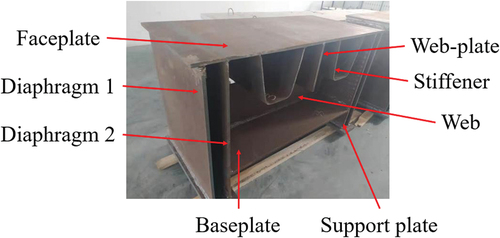
Table 1. Design parameters of the full-scale model specimen.
2.2. The Abaqus finite element analysis model
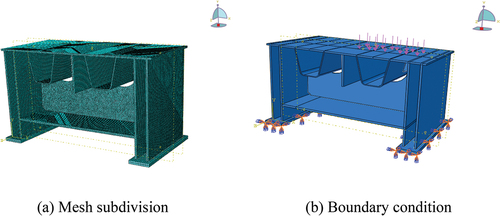
In this study, the stress-strain curve relationship is modeled as an elastoplastic relationship, and the steel constitutive model is a bilinear kinematic hardening model (Rajai Z. Al-Rousan Citation2022a). The binding constraint is put on the assembly member, the full fixed constraint is set on the support plate at the bottom of the model, and all other parameters are kept at their default values. displays the meshing and boundary conditions for the finite element analysis model. To generate a more precise stress state diagram, the finite element. The solid element is used in the model for this study, and the C3D8R element is chosen to mesh the model. The steel box and bridge deck’s mesh is relatively coarse, so a seed size of 0.2 is chosen. The stiffener and arc notch forces are more complicated, the mesh is thick, and a seed size of 0.1 is used.
Figure 3. Abaqus finite element model.
2.3. Test scheme
To evaluate the influence of various structural factors on the load-bearing performance at the panel-to-stiffener junction, stiffener-to-diaphragm junction, and curved notch detail locations, full-scale model tests were conducted on a specific steel bridge deck to assess the stress magnitude and stress distribution at these structural details.
The value range given in the “Code for Design of Highway Steel Structure Bridges” (JTG D64–2015) and the “Code for Design of Urban Bridges 2019 Edition” is the basis for the load imposed in the finite element model (CJJ-112011). For loading, the uniform load is utilized to simulate the wheel load. To ensure that the local load of the bridge simulation operation does not exceed the design range, the vehicle load adopts the standard load of 48T triaxial vehicle simulation design, and the maximum load is therefore specified to be 480kN. The initial loading is 80kN, each subsequent load is 100kN, the total loading is 480kN, and use the same load for unloading. Load is applied in the middle of the span, and each increase is followed by a 5-minute wait for data recording. For the test, a PLS-500 electro-hydraulic servo fatigue testing machine was employed. The actuator’s 500kN maximum load and 150 mm maximum stroke allow it to meet the loading requirements for the static load test in this study. depicts the loading device.
Figure 4. Test loading diagram.
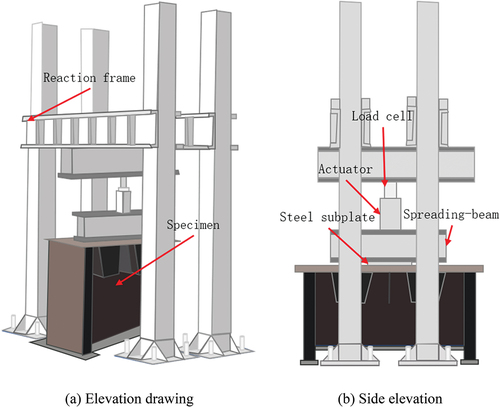
As shown in , the electro-hydraulic servo fatigue testing machine consists of a hydraulic pulsator, control system, and hydraulic loading pulsator. The pulsator conducts the test loading according to the preset loading program from the control system until the test is completed.
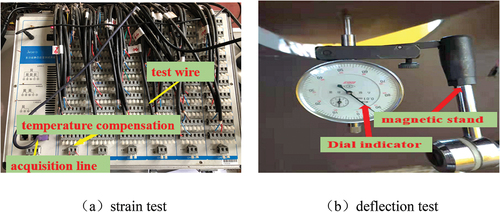
The most important information to reflect the structure’s stress is stress and strain. The strain during the test is measured using the static strain gauge (JM3812). The instrument’s acquisition frequency, which can reach 50 Hz, can precisely measure the strain data generated throughout the test. To ensure the accuracy of the test data, temperature compensation modules of the same material are connected during the test to offset the influence of temperature on the static load test. Additionally, for locations where the stress direction is unclear, three rosette strain gauges are used for measurement. The deflection data during the test can directly reflect the deformation form of the structure in the test and judge whether the structure is kept in the linear range during the static load test. A dial indicator is used to monitor the vertical deflection of three important sections of the specimen model, and two dial indicators were set for each section. Select the longitudinal ends and mid-span of the specimen as the test sections. Strain and deflection measuring points are shown in . Among them, YL and ZL represent the left and right sides, respectively; DB represents the roof measuring point; HGB represents the diaphragm measuring point, and UL represents the stiffener. The strain testing and deflection testing instruments are shown in .
Figure 5. Measurement point layout.
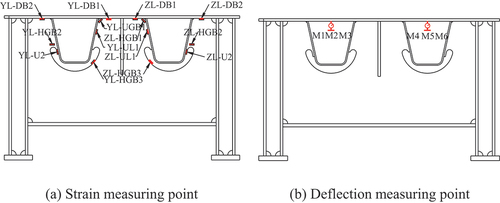
Figure 6. Testing instruments.
2.4. Test result analysis
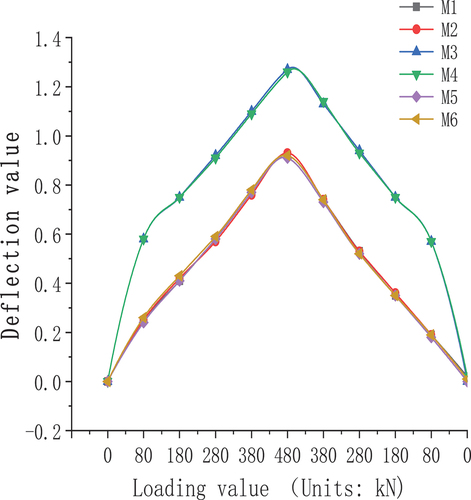
The load-strain (displacement) curves of each measuring point show a good linear relationship during the full-scale model test, and the loading and unloading curves have good symmetry. It shows that the structure is in an elastic working state during the test. For unified data analysis, the measured strain data is converted to stress data, as shown in . The load-deflection curve is shown in .
Figure 7. Stress load curve.
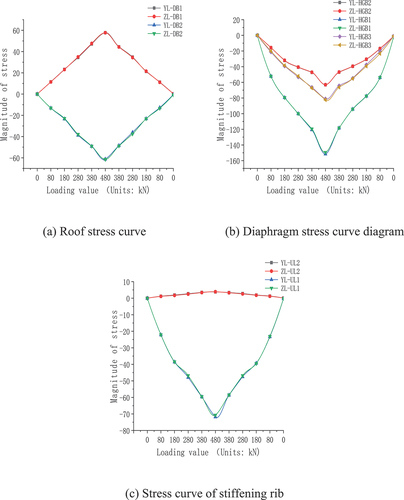
Figure 8. Displacement load curve.
demonstrates that the stress values of the measuring points at the symmetrical position are distributed symmetrically about the specimen’s central axis. The fact that the stress increases linearly as the load increases and decreases linearly as the load decreases indicate that the structure is in the elastic stage. When the load reaches 480kN, the maximum stress at the panel-stiffener joint is 61.5MPa, 151.58MPa at the diaphragm and stiffener, 63.18MPa at the arc opening of the diaphragm, and 82.41MPa at the bottom of the opening, and 71.7MPa at the stiffener joint.
In , it is clear that stress concentration takes place and is more pronounced at the diaphragm’s arc opening. The longitudinal rib will experience local secondary stress due to the contact force between the diaphragm and web and the secondary effect generated by the limited notch depth, hence the notch depth should be increased as much as possible. Geometric linearity can be made smoother and the stress concentration brought on by geometric discontinuity can be reduced by the smooth transition of the reverse radius at the junction between the diaphragm and the longitudinal rib (AAshto Citation2004). The internal force of the structure is greatly influenced by the shape of the diaphragm aperture, hence this study uses an opening in the shape of an apple with an expanded radius and notch. This study adopts an apple-shaped opening with an enhanced radius and notch depth to optimize the parameters of the detailed structure of the steel bridge deck because the diaphragm opening form greatly influences the internal force of the structure (Li Citation2019; Mori and Harada Citation2011).
As shown in , M1, M3, M4, and M6 are the measuring points at both ends of the longitudinal component, and M2 and M5 are the measuring points in the longitudinal span of the component. The deflection values of the measuring points at symmetrical positions are similar and symmetrically distributed about the specimen’s central axis. The maximum movement is 1.27 mm, and the variation between symmetrical measuring points is less than 0.10%. This indicates that the structure’s internal forces are distributed uniformly.
The stress of the measuring point in with a significant shift in the stress response is taken as the theoretical value from the finite element model and compared to the measured strain in the experiment. The outcomes are displayed in .
Figure 9. Stress value comparison diagram.
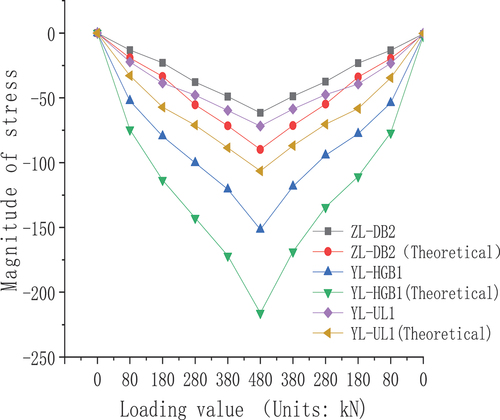
illustrates that the calibration coefficients of UL, DB, and HGB are linear with the loading levels and range from 0.67 ~ 0.70. The static load test of the full-scale model specimen demonstrates that the stress distribution law of the component connection is essentially consistent with the calculation results of the finite element model, indicating that the finite element analysis theoretical model can accurately reflect the actual stress state of the bridge.
3. Optimization design of a continuous steel box girder bridge deck
3.1. Optimization objectives and experimental design
Response surface methodology (RSM) was initially proposed in the 1950s by mathematicians Box and Wilson. Currently, factorial experimental design, central composite design (CCD), Box-Behnken design (BBD), D-optimal design, Latin square design (LSD), etc. are some of the sample design techniques frequently employed in RSM (Li, Lu, and Qiao Citation2010; Bayramov, Taşdemir, and Taşdemir Citation2004; Bo et al. Citation2022). In order to guarantee the spatial uniformity of sample distribution, the CCD method and the BBD method choose samples. The uniform distribution of samples in a sparse space is essential for getting precise explicit functions and preventing significant errors. This study will use the BBD method for sample design because it requires fewer tests than the CCD method to produce evenly distributed sample groups. Multivariable optimization design is guided by the function relationship between the fitting factor and response value of the nonlinear regression equation. This is accomplished using the method of reasonable experimental design and experimental data. Optimization analysis of steel bridge deck design by establishing a finite element analysis model and a response surface method model to study optimal matching design parameters. Based on full-scale model testing and finite element model analysis, four analysis points with large internal forces are chosen as control points, and the stress of control points is chosen as the dependent variable upon which the optimization objective function will be based. The analysis points are shown in .
Figure 10. Analysis point diagram.
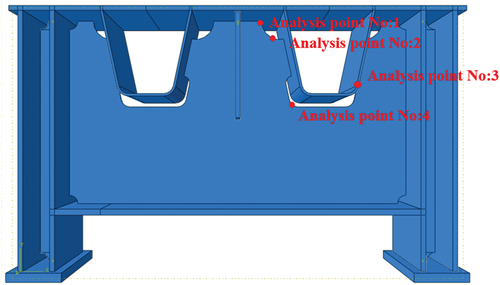
The established Abaqus finite element analysis model uses the five parameters including panel thickness (A, in millimeters), stiffener thickness (B, in millimeters), diaphragm thickness (C, in millimeters), stiffener height (D, in millimeters), and diaphragm opening form (E), which have a big effect on the optimization goal as design variables. The value ranges of the detailed parameters are shown in .
Table 2. Design variable values.
For bridge structures, the lower the internal structural force, the greater the bearing capacity and the superiority of the force system. Finding the best set of design parameters for the structural system in by optimizing the design to make the objective function as small as possible. Using a 5-factor, 3-level BBD model, the following is the function of test times.
is the number of factors
is the number of central groups
For the BBD model with five factors and three levels, the number of central groups is set to 6, and the number of model calculation experiments is 36 (Kayaroganam Citation2021). Detail parameters are designed as shown in .
Table 3. 5 factors BBD experimental design group.
The Abaqus finite element analysis software is used to establish the full bridge model, and the specific parameters are the same as in the second chapter. The 36 groups of different detailed parameter combinations are modeled, and some model diagrams are shown in .
Figure 11. Partial finite element cloud diagram.
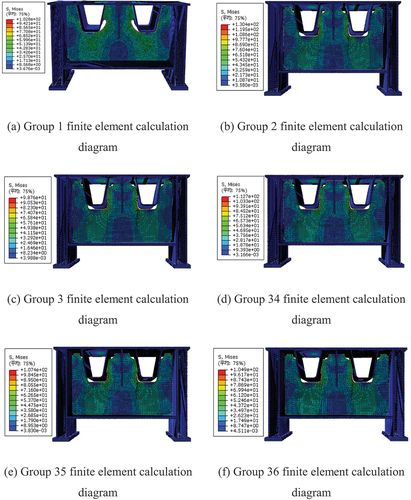
Under normal operating conditions, the orthotropic steel bridge deck is primarily loaded by the top plate and transverse diaphragms. As shown in , the maximum stress is distributed at the connection between the transverse diaphragm and the stiffener, which aligns with the force distribution pattern observed in the full-scale model test. This further validates the accuracy of the finite element model.
3.2. The impact of various parameters on the mechanical performance of orthotropic bridge decks
The influence of different parameters on the mechanical performance of orthotropic steel bridge decks, namely, panel thickness, stiffener thickness, crossbeam thickness, and stiffener height, was analyzed using a one-factor-at-a-time parametric analysis method. By disassembling the experimental groups from , individual factor control experiments for panel thickness, stiffener thickness, crossbeam thickness, and stiffener height were conducted, and the experimental groups are presented in .
Table 4. One-factor control experimental groups.
Through the analysis of different finite element models in the experimental groups, the stress distribution patterns and deflection values at sensitive locations of the components were obtained. This highlighted the influence of various design parameters on the experimental indicators at different component measuring points. A qualitative analysis of the finite element models was conducted to analyze the effects of one-factor parameters on the structural stress state, as shown in .
Figure 12. Single factor parameter influence.
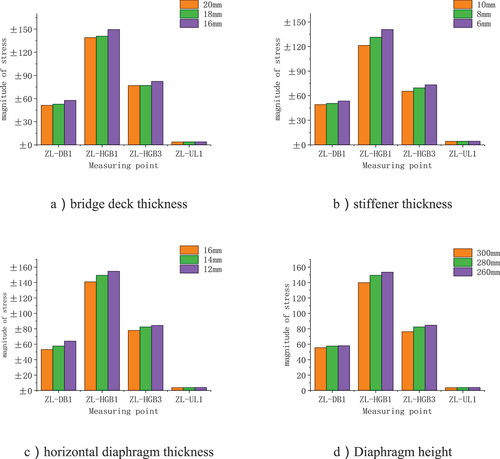
As shown in , with the increase in the top plate thickness, stiffener thickness, crossbeam thickness, and crossbeam height, the absolute values of stress at the sensitive analysis points in the structure gradually decrease. This indicates that increasing the thickness of individual components under single-parameter conditions can enhance the structural load-bearing capacity and reduce the maximum stress within the structure. The percentage reduction in the maximum stress at sensitive analysis points with the change of individual parameters is shown in .
Table 5. Maximum stress reduction ratio.
As evident from , it is observed that changes in panel thickness and crossbeam thickness have the most significant impact on the stress distribution in the top plate, while they have the least influence on the internal forces of the stiffeners. On the other hand, variations in stiffener thickness are the primary factor affecting the stress at the openings of the crossbeams. In this study, analysis and optimization will be conducted using normal working loads. Subsequently, structural load characteristic tests and analysis optimization will be carried out on orthotropic steel bridge decks, focusing on energy absorption at the ultimate load-carrying capacity state, structural stiffness degradation, and failure modes (Rajai Z. Al-Rousan Citation2022b, Rajai Z. Al-Rousan Citation2022a, Al-Rousan and Alkhawaldeh Citation2021).
3.3. Results validation and analysis
Based on the results of the finite element model’s calculations, Design-Expert software analyzed the BBD model’s results. The BBD model, also known as the Box-Behnken design, is one of the design types of the RSM secondary model, a second-order three-level design for fitting the response surface. This resulted in a precise, understandable model and an optimized design. The statistical results of finite element calculation are shown in .
Table 6. Preliminary statistics of finite element calculation data.
Analysis of response value variation based on finite element calculation results and a response surface model. The variance analysis in mathematical theory is used to test the model, and the multivariate quadratic response surface regression model is used to fit the stress and factors of each analysis point to the test results. The following multivariate quadratic response surface regression model was obtained by fitting.
And the variance test table for each analysis point is obtained. Due to space limitations, only the analysis of variance for analysis point 1 is shown in .
Table 7. R1 variance test table.
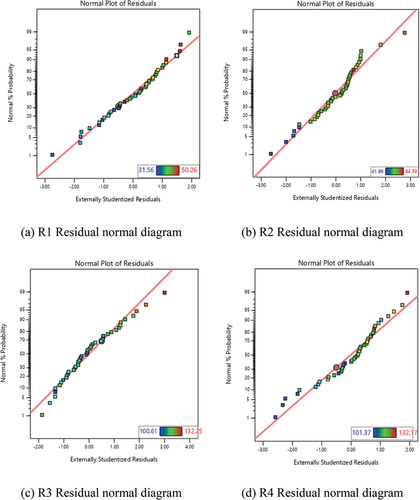
P and R2 should be used to validate the model’s credibility. The P value shows how much each factor affects the response value. The smaller the P value, the more of an effect the factor has on the optimization model. From the analysis, it can be seen that the P values of the response surface regression model are less than 0.05, indicating that the model has a significant effect, and the most significant factors affecting the stress of each analysis point are obtained by the P value. The fitting correlation coefficient R2 of each regression model was 0.9968, 0.9912, 0.9876, and 0.9526, respectively, which were all greater than 0.85, indicating that the fitting degree of the model was good.
The calculated residuals are shown in . The residuals are distributed uniformly close to the zero line, and the residual normality distribution is satisfactory. Using the finite element calculation model, the interaction model can accurately demonstrate how different factors affect the response value.
Figure 13. Residual normal diagram.
The influence of the diaphragm opening shape on the model is consistent with the original design test results, as shown in . It demonstrates that the shape of the diaphragm’s opening has a significant effect on the stress at the sensitive location; therefore, all diaphragms in the design group have apple-shaped openings with improved stress characteristics. From the analysis of variance, there is an interaction between AB, BD, BC, and AC. The contour map of the factor interaction is shown in .
Figure 14. Contour map and surface map of interaction between two factors.
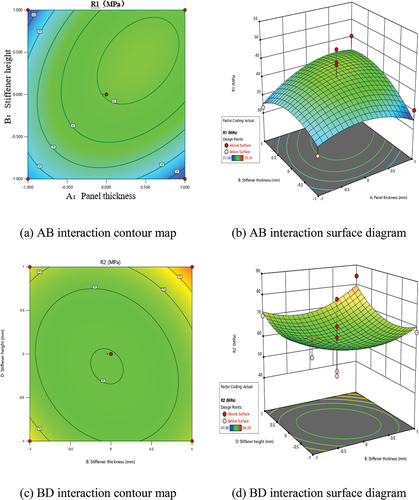
demonstrates that the stress at the No. 1 analysis point decreases as the panel thickness and stiffener thickness increase. The stress at analysis point No. 2 decreases as the stiffener’s thickness and height increase. The stress at the No. 3 analysis point decreases as the thickness and height of the stiffener is increased. The No. 4 analysis point decreases as the thickness of the diaphragm and the panel increase. The Design Expert software’s Optimization function is used to determine the ideal parameter combination by choosing the one with the highest mathematical expectation. The panel is 18 mm thick, the U ribs are 10 mm thick, the diaphragm is 16 mm thick, the U ribs are 280 mm tall, and the diaphragm opening form is apple-shaped.
Figure 14. (Continued).
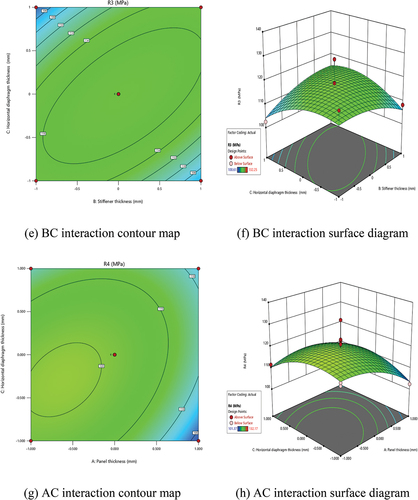
The best combination is confirmed, and the correctness of the design value is determined using the Abaqus finite element model. R1 = 30.26 MPa, R2 = 42.06 MPa, R3 = 108.46 MPa, and R4 = 105.87 MPa, according to the findings. The error rates between the test values and the optimized values are now 2.37%, 0.49%, 5.84%, and 4.43%, respectively. It demonstrates that the anticipated value agrees with the theoretical calculation outcome, the calculation model.
4. Conclusion
Combining full-scale model testing and finite element simulation validates the accuracy of the finite element model. Consideration is given to the influence of panel thickness, stiffener thickness, diaphragm thickness, stiffener height, and diaphragm opening shape on the mechanical properties of a continuous steel box girder. Taking the stress of four main structural analysis points as the objective function, the detailed design of the continuous steel box girder bridge is optimized by the response surface method. The following conclusions are obtained.
(1)The design parameters are reasonable, and the results of the full-scale model tests are within the allowable range. The finite element model shows good agreement with the static test results and accurately represents the actual stress state of the structure. Under the action of vehicle loads, the maximum stress point in the structure occurs at the connection between the diaphragm and the stiffener. Through single-factor tests, the influence of panel thickness, stiffener thickness, diaphragm thickness, and diaphragm height on the structural load characteristics was analyzed, resulting in maximum stress reduction percentages of 11.1%, 13.85%, 16.98%, and 9.87%, respectively. Under load, the maximum internal force of the steel bridge deck appears at the diaphragm-stiffener joint, which is 151.58 MPa. The maximum stress value of the panel-stiffener connection is 61.5 MPa, the maximum stress value of the diaphragm arc opening is 63.18 MPa, and the stiffener connection has a maximum stress value of 71.7 MPa. The stress conditions of these locations must be taken into account during the design and calculation processes.
(2)Based on response surface theory, the optimization calculation model of the bridge deck is established, as well as the nonlinear fitting relationship between the mechanical performance of the steel bridge deck and the five detailed structural parameters. The model indicates that the shape of the diaphragm opening and the thickness of the diaphragm is the most significant factors affecting the steel bridge deck. Per the response surface, the optimal structural parameters of the steel bridge deck are as follows: the panel thickness is 18 mm, the stiffener thickness is 10 mm, the diaphragm thickness is 16 mm, the stiffener height is 280 mm, and the diaphragm opening shape is an apple. The finite element analysis confirms that the modification of the structural parameter combination reduces the maximum stress in the structure by 30.16%.
(3)The application of the response surface method to structural optimization design is an efficient method. Using the response surface optimization design method and considering the coupling effects between structural design parameters, the optimization design results are not restricted to a single level of choice but encompass a broad spectrum of optimization.
This paper investigates the influence of single parameters and the interactions among multiple parameters on the internal forces of orthotropic steel bridge decks. Mathematical analysis methods are used to study the sensitivity of different parameters. The response surface method is employed to obtain the optimal structural design combination, and validation is performed using Design-Expert software.Structural dynamic problem is a main concentration for slender bridges while tuned mass damper is a popular vibration absorber, and will be investigated in the future (Liangkun Wang, Sun, and Ding Citation2022, Liangkun; Wang, Sun, and Ding Citation2022; Alhassan, Al-Rousan, and Al-Khasawneh Citation2020).
Acknowledgements
The authors gratefully appreciate the support from the Key R & D Plan Guidance Projects of Heilongjiang Province (GZ20220133).
Disclosure statement
No potential conflict of interest was reported by the author(s).
Additional information
Funding
Notes on contributors
Chao Zhang
Chao Zhang, a graduate student of Department of Civil Engineering and Transportation of Northeast Forestry University, the main research direction is transportation and prefabricated box culvert structure.
Quansheng Sun
Quansheng sun, Professor of Civil Engineering and Transportation College of Northeast Forestry University. The main research directions are bridge reinforcement, bridge detection and bridge design.
Dandan Kong
Dandan Kong, the Geological Environment Survey Institute of the Eleventh Geological Brigade of Zhejiang Province, the main research direction is geological survey.
Bowen Hu
Bowen hu, a graduate student of Department of Civil Engineering and Transportation, Northeast Forestry University, whose main research direction is transportation.
References
- Ahmadivala, M., J. Berthellemy, A. Orcesi, C. Mattrand, N. Gayton, and T. Yalamas. 2022. “A Strategy for Rib-To-Deck Crack Propagation Analysis and Strengthening of Orthotropic Deck Bridges.” Engineering Failure Analysis 134. https://doi.org/10.1016/J.ENGFAILANAL.2022.106057.
- Alhassan, M. A., R. Z. Al-Rousan, and S. I. Al-Khasawneh. 2020. “Control of Vibrations of Common Pedestrian Bridges in Jordan Using Tuned Mass Dampers.” Procedia Manufacturing(C) 44:36–43. https://doi.org/10.1016/j.promfg.2020.02.202.
- Al-Rousan, R. Z. 2022a. “Cyclic Lateral Behavior of NLFEA Heat-Damaged Circular CFT Steel Columns Confined at the End with CFRP Composites. Case Studies in Construction Materials.” Case Studies in Construction Materials 17:e01223. https://doi.org/10.1016/J.CSCM.2022.E01223.
- Al-Rousan, R. Z. 2022b. “Impact of Sulfate Damage on the Behavior of Full-Scale Concrete Bridge Deck Slabs Reinforced with FRP Bars.” Case Studies in Construction Materials 16:e01030. https://doi.org/10.1016/J.CSCM.2022.E01030.
- Al-Rousan, R. Z., and A. Alkhawaldeh. 2021. “Behavior of Heated Damaged Reinforced Concrete Beam-Column Joints Strengthened with FRP.” Case Studies in Construction Materials 15:e00584. https://doi.org/10.1016/J.CSCM.2021.E00584.
- American Association of State Highway and Transportation Officials (AASHTO). 2004. AASTO LRFD Bridge Design Specifations[s].
- Battista, R. C., M. S. Pfeil, and E. M. L. Carvalho. 2008. “Fatigue Life Estimates for a Slender Orthotropic Steel Deck.” Journal of Constructional Steel Research 64 (1): 134–143. https://doi.org/10.1016/j.jcsr.2007.03.002.
- Bayramov, F., C. Taşdemir, and M. A. Taşdemir. 2004. “Optimisation of Steel Fibre Reinforced Concretes by Means of Statistical Response Surface Method.” Cement and Concrete Composites 26 (6): 665–675. https://doi.org/10.1016/S0958-9465(03)00161-6.
- Bo, X., L. Jianfeng, L. Weigang, X. Lei, and X. Renyi. 2022. “Design and Optimization of γ-Shaped Settlement Training Wall Based on Numerical Simulation and CCD-Response Surface Method.” Processes 10 (6): 1201. https://doi.org/10.3390/PR10061201.
- Chang-Kook, O., K.-J. Hong, D. Bae, and T. Han. 2011. “Analytical and Experimental Studies on Optimal Details of Orthotropic Steel Decks for Long Span Bridges.” International Journal of Steel Structures 11 (2): 227–234. https://doi.org/10.1007/s13296-011-2010-6.
- China Iron and Steel Industry Association. 2018. Gb/T 1591-2018. State Administration for Market Regulation; china National Standardization Management.
- de Jong, F. B. P. 2005. “Overview Fatigue Phenomenon in Orthotropic Bridge Decks.” In s.n. edited by, Proceedings of the orthotropic bridge conference, 489–512. Sacramento, CA, USA: ASCE. Sacramento Section, capital branch.
- Duchaczek, A., and Z. Mańko. 2017. “Influence of Fatigue Crack on Strains State within Assembly Holes in a Web of Steel Bridge Girder.” International Journal of Civil Engineering 15 (4): 627–640. https://doi.org/10.1007/s40999-017-0173-z.
- Fisher, J. W., and J. M. Barsom. 2016. “Evaluation of Cracking in the Rib-To-Deck Welds of the Bronx-Whitestone Bridge.” Journal of Bridge Engineering 21 (3). https://doi.org/10.1061/(ASCE)BE.1943-5592.0000823.
- Kai, L., L. Fan, Z. Linyan, and R. Zhihong. 2021. “Research on Structural Optimization of Orthotropic Steel Bridge Deck Based on Force Analysis of Bridge Deck Pavement.” Highway Engineering 3:86–92 + 104. https://doi.org/10.19782/j.cnki.1674-0610.2021.03.13.
- Kayaroganam, P. 2021. Response Surface Methodology in Engineering Science. IntechOpen. https://doi.org/10.5772/intechopen.90965.
- Krishnamoorthy, C. S. 2001. “Structural Optimization in Practice: Potential Applications of Genetic Algorithms.” Structural Engineering and Mechanics 11 (2): 151–170. https://doi.org/10.12989/sem.2001.11.2.151.
- Li, C. 2019. Research on Crack Fatigue Mechanism and Optimization Design of Longitudinal Rib Diaphragm Connection of Steel Box Girder. Harbin University of Technology. https://doi.org/10.27061/d.cnki.ghgdu.2019.003989.
- Li, H. S., Z. Z. Lu, and H. W. Qiao. 2010. “A New High-Order Response Surface Method for Structural Reliability Analysis.” Structural Engineering and Mechanics 34 (6): 779–799. https://doi.org/10.12989/sem.2010.34.6.779.
- Martins, A. M. B., L. M. C. Simões, and J. H. J. O. Negrão. 2016. “Optimum Design of Concrete Cable-Stayed Bridges with Prestressed Decks.” International Journal for Computational Methods in Engineering Science And 17 (5–6): Mechanics(5–6. https://doi.org/10.1080/15502287.2016.1231237.
- Miki, C. 2006. “Fatigue Damage in Orthotropic Steel Bridge Decks and Retrofit Works.” International Journal of Steel Structures 6 (4): 255–267. UCI:G704-001716.20066.4.006.
- Mori, T., and H. Harada. 2011. “Fatigue Tests and Stress Analyses on Connections Between Deck Plates, Transverse Ribs and Trough Ribs in Steel Orthotropic Deck.” Journal of Japan Society of Civil Engineers, Ser A1 (Structural Engineering & Earthquake Engineering (SE/EE)) A1 67 (1): 95–107. in Japanese. https://doi.org/10.2208/jscejseee.67.95.
- Orangun, C. O., and T. A. I. Akeju. 1977. “A Study of Some Characteristics of Optimum Design of Composite Bridge Deck.” Matériaux et Constructions 10 (1): 39–44. https://doi.org/10.1007/BF02473587.
- Shi, W., L. Wang, and Z. Lu. 2018. “Study on Self-Adjustable Tuned Mass Damper with Variable Mass.” Structural Control and Health Monitoring 25 (3): e2114. https://doi.org/10.1002/stc.2114.
- Shi, W., L. Wang, L. Zheng, and H. Wang. 2019. “Experimental and Numerical Study on Adaptive-Passive Variable Mass Tuned Mass Damper.” Journal of Sound and Vibration 452:97–111. https://doi.org/10.1016/j.jsv.2019.04.008.
- Sim, H.-B. 2009. “Chia-Ming Uang & Charles Sikorsky(2009) ‘Effects of Fabrication Procedures on Fatigue Resistance of Welded Joints in Steel Orthotropic Decks.” Journal of Bridge Engineering 14 (5): 366–373. https://doi.org/10.1061/(ASCE)1084-0702(2009)14:5(366).
- Su, D., H. Nassif, and Y. Xia. 2018. “Optimization of Deck Construction Staging for Multiple-Span Continuous Steel Girder Bridge.” Journal of Performance of Constructed Facilities 32 (1). https://doi.org/10.1061/(ASCE)CF.1943-5509.0001073.
- Wang, L., S. Nagarajaiah, Y. Zhou, and W. Shi. 2023. “Experimental Study on Adaptive-Passive Tuned Mass Damper with Variable Stiffness for Vertical Human-Induced Vibration Control.” Engineering Structures 280:280. https://doi.org/10.1016/j.engstruct.2023.115714.
- Wang, L., W. Shi, Q. Zhang, and Y. Zhou. 2020. “Study on Adaptive-Passive Multiple Tuned Mass Damper with Variable Mass for a Large-Span Floor Structure.” Engineering Structures 209:209. https://doi.org/10.1016/j.engstruct.2019.110010.
- Wang, L., W. Shi, and Y. Zhou. 2022. “Adaptive-Passive Tuned Mass Damper for Structural Aseismic Protection Including Soil–Structure Interaction.” Soil Dynamics and Earthquake Engineering 158:107298. https://doi.org/10.1016/J.SOILDYN.2022.107298.
- Wang, Zhiwen., S. Sun, and Y. Ding. 2022. “Fatigue Optimization of Structural Parameters for Orthotropic Steel Bridge Decks Using RSM and NSGA-II.” Mathematical Problems in Engineering 2022:1–12. https://doi.org/10.1155/2022/4179898.
- Wang, Y., L. Wang, and W. Shi. 2021. “Two-Dimensional Air Spring Based Semi-Active TMD for Vertical and Lateral Walking and Wind-Induced Vibration Control.” Structural Engineering and Mechanics 80 (4): 377–390. https://doi.org/10.12989/sem.2021.80.4.377.
- Wang, L., Y. Zhou, and S. Weixing. 2023. “Seismic Response Control of a Nonlinear Tall Building Under Mainshock-Aftershock Sequences Using Semi-Active Tuned Mass Damper.” International Journal of Structural Stability and Dynamics. https://doi.org/10.1142/S0219455423400278.
- Wolchuk, R. 1990. “Lessons from Weld Cracks in Orthotropic Decks on Three European Bridges.” Journal of Structural Engineering 116 (1): 75–84. https://doi.org/10.1061/(ASCE)0733-9445(1990)116:1(75).
- Wu. 2018. “Research on mechanical properties and optimization design of new orthotropic steel bridge deck.” Master ‘s thesis, Changsha University of Science and Technology. https://kns-cnki-net-443.webvpn.nefu.edu.cn/KCMS/detail/detail.aspx?dbname=CMFD201901&filename=1019090464.nh.
- Xiao, Z.-G., K. Yamada, J. Inoue, and K. Yamaguchi. 2005. “Fatigue Cracks in Longitudinal Ribs of Steel Orthotropic Deck.” International Journal of Fatigue 28 (4): 409–416. https://doi.org/10.1016/j.ijfatigue.2005.07.017.
- Zhang, H., L. Wang, and W. Shi. 2023. “Seismic Control of Adaptive Variable Stiffness Intelligent Structures Using Fuzzy Control Strategy Combined with LSTM.” Journal of Building Engineering 78:107549. https://doi.org/10.1016/j.jobe.2023.107549.