
 ?Mathematical formulae have been encoded as MathML and are displayed in this HTML version using MathJax in order to improve their display. Uncheck the box to turn MathJax off. This feature requires Javascript. Click on a formula to zoom.
ABSTRACT
To promote the application of steel-reinforced-concrete structures in prefabricated concrete structures, the semi-prefabricated steel-tube double-layer concrete (SPSTDC) column was proposed. The eccentric compression mechanical behavior was studied through theoretical analysis, experiments, and numerical simulations. Three possible failure modes, namely, compression failure, total yield failure, and tension failure, were obtained. Then, corresponding calculation methods of the bearing capacity (Nu) were established and their effectiveness was verified through comparison with test results. The analysis results showed that Nu decreased with the increase in the eccentricity. Nu increased with the precast concrete strength, and its effect on Nu diminished with increasing eccentricity. The post-cast concrete strength had a smaller effect on Nu than the precast concrete strength. Nu increased with the increase in the steel ratio αa, while the steel tube strength had little influence on Nu. The N–M curve of the SPSTDC column could be divided into three segments, corresponding to the three failure modes. For the compression failure mode, the ultimate load Ns decreased with the increase in the ultimate bending moment Ms. For the other two failure modes, the pattern was the opposite. The eccentricity had a significant impact on the horizontal lateral deflections of the SPSTDC columns. With the increase in the eccentricity, the horizontal lateral deflection corresponding to Nu increased. The horizontal lateral displacement of the mid-height section remained the largest compared with those of other sections. The lateral stiffness increased with the increase in the concrete strength, steel strength, and steel ratio. The impact of the precast concrete strength was the most significant while the influence of the steel tube strength was the weakest.
1. Introduction
1.1. Research aims and significance
Steel-reinforced-concrete (SRC) structures are widely employed due to their technical advantages. The presence of section steel in the SRC structure helps improve the bearing capacity, stiffness, ductility, and seismic performance (Li et al. Citation2021; Wang, Shi, and Zhou Citation2019, Citation2022; Wang et al. Citation2022; Wang, Zhou, Nagarajaiah, and Shi Citation2023; Wang, Zhou, and Shi Citation2023; Zhang, Wang, and Shi Citation2023). The wrapping of reinforced concrete allows the section steel to exhibit high durability, fire resistance, and buckling resistance (Ren et al. Citation2021). As vertical load-bearing components whose failure may lead to the collapse of buildings, columns are essential research objects for SRC structures. Eccentric compression is a typical working condition of SRC columns, and the mechanical behaviors of SRC columns under eccentric vertical loads have been studied for decades.
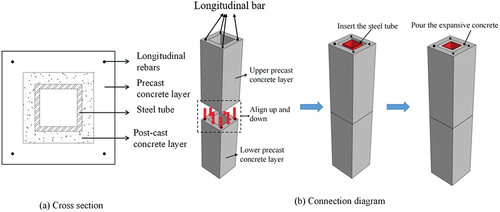
Currently, prefabricated concrete structures have become a development trend in the field of concrete engineering. To fully integrate the technical advantages of SRC columns with the concept of prefabricated concrete, a new kind of SRC column shown in , which can be called the semi-prefabricated steel-tube double-layer concrete (SPSTDC) column, has been proposed (Wang et al. Citation2022). The SPSTDC column includes a precast concrete layer, a post-cast concrete layer, and a square steel tube, as shown in . The precast concrete layer, which is prefabricated in the factory, contains a steel cage composed of longitudinal steel bars and stirrups. For convenience of transportation and lifting, the precast concrete layer should have an appropriate weight and volume. Therefore, a complete column in the actual structure may consist of several precast concrete layers. These precast concrete layers are arranged vertically. The longitudinal bars at the joints can be connected by sleeve grouting. Subsequently, a whole square steel tube is passed through the vertical hole formed by adjacent hollow precast layers, and the expansive concrete is then poured to fill the gap between the steel tube and the inner wall of the precast concrete layer, forming the post-cast concrete layer, as illustrated in . The presence of the steel tube can significantly enhance the bearing capacity of the SPSTDC column. The concrete grades of these two kinds of concrete layers can be different. It is worth noting that due to the precast concrete layer, the construction of the SPSTDC column does not require additional formwork arrangement, providing significant convenience and high efficiency in an actual construction process.
Figure 1. Schematic diagram of semi-prefabricated steel tube double-layer concrete (SPSTDC) column.
It can be seen that compared with most existing SRC column types, this kind of SPSTDC column has outstanding advantages for the prefabrication concept. Another kind of partially prefabricated SRC column was proposed by Yang et al. (Citation2019). Due to its more complex form of the section steel (two H-beams arranged perpendicular to each other) and the larger volume of the prefabricated components, it does not have advantages in construction.
As a typical kind of vertical load-bearing component, it is necessary and valuable to investigate the mechanical performances of SPSTDC columns under eccentric loads, as the combination of the axial load and bending moment is the primary internal force status for the vertical load-bearing components. Therefore, the mechanical performances of SPSTDC columns under eccentric loads, which have significant research value, will be studied in detail in this paper.
1.2. Research methods
The previous related studies and standards have primarily focused on SRC columns with ordinary cross-sectional forms and common materials, which typically used H-shaped steel, cross-shaped steel, or circular steel tubes (Naghipour, Ahmadi, and Nematzadeh Citation2022; Shi et al. Citation2020; Zhou, Yan, and Liu Citation2015). Relevant design specifications have been issued. For example, in CN (Citation1978), section steel is treated as equivalent to reinforcement bars. Then, the eccentric bearing capacity of the SRC column is calculated similarly to how it is calculated for ordinary reinforced-concrete (RC) columns. Methods of treating RC as section steel are presented equivalently in other specifications, such as Euro Code 4 (Citation2004), AISC (Citation2010), and ACI (Citation2014). The eccentric compression bearing calculation method of pure steel columns can be used for SRC columns based on this simplification. The superposition method, which considers the bearing capacity to be the superposition of the capacities of the steel and RC parts for the SRC column, has been adopted in YB 90822007 (Citation2007). Equilibrium conditions of the force and moment on the section are utilized to calculate the eccentric bearing capacity in JGJ 138 (Citation2016).
For SRC columns with distinctive section forms or special materials, relevant targeted research on the eccentric compression bearing capacity has also been carried out. For example, the eccentric compression bearing capacity was studied for the square-cross-section concrete-encased concrete-filled steel tube (CFST) columns using a circular steel tube, and a calculation model was proposed (An and Han Citation2014). For composite concrete-filled steel tube columns with steel fibers and different cross-sectional shapes, the performance evaluation was carried out by Pour et al. (Citation2023). Tests on 27 CFST columns were conducted to investigate the effects of the concrete strength grade, cross-sectional shape, and steel fiber content on the bearing performance, and then, a calculation formula was proposed. Furthermore, aiming at an SRC column with asymmetric section steel, a bearing capacity calculation method that simplifies the asymmetric section into a symmetric one was proposed Lai et al. (Citation2018)). Aiming at a kind of SRC column with two H-beams arranged perpendicular to each other, a method for calculating the bearing capacity under an eccentric load was established based on experimental research and theoretical analysis (Yang et al. Citation2019). For square hollow SRC columns under eccentric loads, a bearing capacity calculation method based on the superposition principle was proposed (Ren et al. Citation2021). Aiming at square hollow octagonal SRC columns, a method for calculating the eccentric-load-bearing capacity based on limit equilibrium principle was proposed (Wang et al. Citation2018). For SRC columns with Q460 and Q690 steels, the eccentric compression performance was investigated Wang et al. (Citation2021). For long square concrete-filled steel tubular columns made of high-strength steel and concrete, eccentric compression tests and theoretical analysis of the bearing capacity were conducted by Li et al. (Citation2021).
Overall, previous relevant research has adopted three types of research methods: theoretical analysis, experiments, and numerical simulations. The previous literature on the eccentric bearing capacities of SRC columns is deemed unsuitable for direct application to SPSTDC columns because of the distinctions in their respective section forms and steel types. Thus, the mechanical performances of SPSTDC columns under eccentric loads were analyzed in detail by theoretical analysis, experiments, and finite element simulations in this study.
1.3. Novelty and main contributions
In this paper, three possible failure modes of the SPSTDC columns were identified based on the different core features and then the corresponding calculation methods of the bearing capacity (Nu) were established. The effects of the eccentricity, concrete strength grade, steel ratio, and steel tube strength on Nu were explored. The N–M correlation curve was plotted and can be divided into three segments, corresponding to the three failure modes. It was found that the ultimate vertical load value may decrease or increase with the increase in the ultimate bending moment value for different failure mode. The N–M curves of the CFST and SPSTDC columns were compared. The ductility of the SPSTDC columns was characterized by the horizontal lateral deflection under a load and then the influence of eccentricity was analyzed. Lateral deflection–section height curves during loading were also obtained and analyzed. The lateral stiffness was characterized by the lateral deflection–load curve and the curves were also established and analyzed. The influence of concrete strength, steel strength, and steel ratio was then analyzed and compared.
2. Theoretical analysis of eccentric compression mechanical behavior
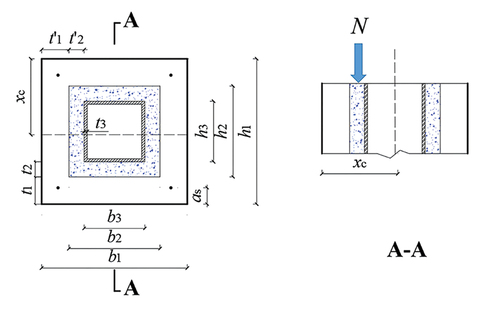
For the convenience of theoretical analysis, a detailed section diagram of an SPSTDC column under an eccentric compression load is shown in . For the precast RC layer, post-cast RC layer, and square steel tube, h1, h2, and h3 are the vertical heights, respectively, and t1, t2, and t3 are the corresponding vertical thicknesses. h0 is the effective height of the section, h0 = h1−as. as is the distance from the action point of the resultant force of the lower longitudinal reinforcement bar to the lower edge of the whole section. In addition, b1, b2, and b3 are the corresponding horizontal widths. xc is the vertical distance from the neutral axis to the upper edge of the whole section. The compression zone of the section is above the neutral axis, and the tension zone is below the neutral axis.
Figure 2. Section diagram of SPSTDC column.
According to the section form of the SPSTDC column, most of the area of the normal section will be under tension if the value of e is too large. When the full section of the steel tube is subjected to tension, most concrete will have difficulty playing its role due to the small compression area of concrete and possible slip between the steel tube and concrete. Therefore, a targeted design should be employed to avoid this working condition for the SPSTDC column in actual projects. For this working condition, the compression area of the normal section starts from the upper flange of the steel tube, and the corresponding e can be recorded as eb. In this paper, the working conditions considered satisfy 0 < e ≤ eb.
2.1. Basis for analysis
The lateral deflection of a column under an eccentric vertical load will generate additional moments, and the bearing capacity will be reduced to some extent. To consider the influence of second-order effects, the calculated eccentricity e can be used. It can be obtained by multiplying the initial eccentricity e0 (e0 = M/N) with a factor η, i.e., e = ηe0. η can be called the eccentricity increase factor, which can reflect the actual moment magnification effect (Ahmed et al. Citation2019; Wang, Young, and Gardner Citation2021; Zhang, Zhao, Wang, and Chen Citation2023) and be calculated using the following formulas (Zhu et al. Citation2015):
where b is the section width of the SPSTDC column (here, b1 = b), l0 is the calculation length of the SPSTDC column, K1 is the correction factor considering the eccentricity, which is set to 1 when its value is greater than 1, and K2 is the correction factor considering the slenderness ratio, which is set to 1 when its value is greater than 1.
To obtain reasonable results simply, the tensile strength of concrete can be neglected. The tensile and compressive yield strengths and the tensile and compressive moduli of elasticity of the steel tube can be considered to be equal (fa = f“a; Ea = E”a). Meanwhile, the tensile and compressive yield strengths and the tensile and compressive moduli of elasticity of the longitudinal rebars can also be considered to be equal (fy = f“y; Es = E”s).
Due to the constraint of the eccentricity (0 < e ≤ eb) and the positive effect of expansive concrete, the slip between the steel tube and concrete can be ignored. Furthermore, referring to previous research results Cao et al. (Citation2022); Chen et al. (Citation2022)), the “plane section assumption” can be employed, that is, the distribution of strain values along the eccentric direction in the cross-section approximately follows a linear distribution based on this assumption, as shown in .
Figure 3. Schematic diagram of plane section assumption.
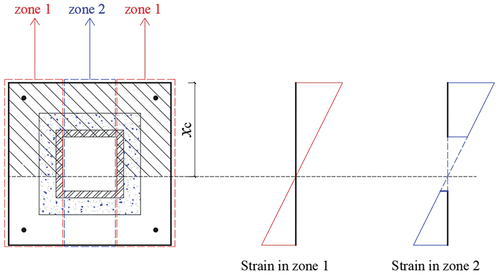
The cross-sectional area of the steel tube is much larger than those of the longitudinal reinforcements. Therefore, the steel tube can be seen as the main component providing the eccentric compression bearing capacity, in addition to the concrete compression zone. In this paper, the upper side and lower side of the square steel tube are called the “upper flange” and “lower flange,” respectively. The left and right sides of the square steel tube are called the “web.” The failure state of the concrete compression zone and steel tube (distinguishing the upper flange, lower flange, and web) can then be taken as the core feature of normal section failure under eccentric loads.
2.2. Failure modes
With the gradual increase in the e value in the range 0 < e ≤ eb, the biasing degree of the normal section changes constantly. The height of the compression zone xc is constantly changing, and the stress state of each part of the column is also constantly changing, leading to a variety of failure modes.
2.2.1. Description of failure modes
Detailed characteristics of the different failure modes can be obtained from theoretical analysis directly. According to the different core features induced by theoretical analysis, there are three possible failure modes: compression failure, total yield failure, and tension failure. It is worth noting that all three failure modes of the SPSTDC column are marked by the crushing of the edge of the concrete compression zone. The states of other parts of the normal section corresponding to these three failure modes are described as follows.
In the compression failure mode, the e value is small, and most of the area of the section is under compression. The upper flange of the steel tube undergoes yielding under compression. Furthermore, the lower flange may experience either compression or tension, and even yielding, depending on the location of the neutral axis.
In the total yield failure mode, the e value is large, and a small area of the section is under compression. When the column fails, the upper and lower flanges have yielded under tension and compression, respectively. At the same time, the upper compressive longitudinal rebars and the lower tensile longitudinal rebars also undergo yielding.
In the tension failure mode, the e value is large, and a small area of the section is under compression. The upper flange may not yield under compression, and the stress may even be zero (the neutralization axis is located on the upper flange). At this point, the lower flange has yielded under tension. In addition, the upper compressive longitudinal rebars and the lower tensile longitudinal rebars have also yielded when the column fails.
2.2.2. Description of limit state for each failure mode
For each failure mode, there is a limit state that represents the boundary between this mode and the next failure mode with the change of the neutral axis. The core features of each limit state are shown in . The strain diagram of each limit state can be obtained based on the plane section assumption, as shown in . Therefore, xc of the compression failure mode should satisfy xp ≤ xc < h1, xc of the total yield failure mode should satisfy xt ≤ xc < xp, and xc of the tension failure mode should satisfy xn ≤ xc < xt.
Figure 4. Strain diagram of each limit state.
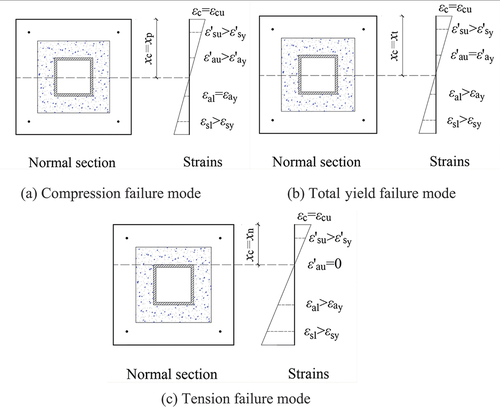
Table 1. Core features of each limit state.
In , εc is the compressive strain of concrete, and εcu is the ultimate compressive strain of concrete. For ordinary SPSTDC columns whose strength grades are not greater than C50, εcu = 0.0033. ε“su and σ”su are the compression strain and stress of the upper longitudinal rebars, respectively. εsl and σsl are the tensile strain and stress of the lower longitudinal rebars, respectively. ε”sy and εsy are the compressive and tensile yield strain of the longitudinal rebars, respectively. HRB400-grade longitudinal rebars are widely used at present, with a design yield strength of 360 MPa, and ε‘sy = εsy = 0.00175. ε’au is the compression strain of the upper flange of the steel tube. εal is the tensile strain of the lower flange of steel tube. ε”ay and εay are the compressive and tensile yield strains of the steel tube, respectively. The steel tube is generally a Q235 steel tube, with a yield strength design value of 215 MPa and ε’au = εau = 0.00104.
According to the linear relationship of the strain shown in , xp can be obtained as follows:
According to the linear relationship of the strain shown in , xt can be obtained as follows:
According to , xn can be obtained directly by xn = t1+ t2.
Based on the strain state of each part in , detailed characteristics of each limit state can be summarized as follows:
For the limit state of the compression failure mode, the edge of the concrete compression zone is crushed, while the tensile lower flange of the steel tube reaches yield. At this time, the upper flange and part of the web in the compressive zone have already yielded. Furthermore, the upper compressive longitudinal rebars and the lower tensile longitudinal rebars have also yielded. The neutral axis height corresponding to this limit state is xp.
For the limit state of the total yield failure mode, the edge of the concrete compression zone is crushed, while the upper flange just reaches yield under compression. At this point, the lower flange and part of the web in the tensile zone have already yielded. In addition, the upper compressive longitudinal rebars and the lower tensile longitudinal rebars have also yielded. The neutral axis height corresponding to this limit state is xt.
For the limit state of the tension failure mode, the neutral axis is located at the upper flange of the steel tube, resulting in a compressive stress of zero at the upper flange, while the edge of concrete compression zone is crushed. At this time, the lower flange and part of the web in the tensile zone have already yielded. Moreover, the upper compressive longitudinal rebars and the lower tensile longitudinal rebars have also yielded. The neutral axis height corresponding to this limit state is xn.
It is worth noting that the e value of the limit state of the tension failure mode is exactly eb, which is the upper limit value of the eccentricity for the analysis of the failure mode of the normal section under an eccentric load and the calculation of the bearing capacity in this paper.
2.2.3. Brief summary
In summary, through theoretical analysis, it is known that as the eccentricity increases, the column will undergo compression failure, total yield failure, and tensile failure in sequence. These different failure modes are caused by changes in the neutral axis. Although the names of these three failure modes are different from the relevant terms in existing studies and standards (ACI Citation2014; AISC Citation2010; Euro Code 4 Citation2004; An and Han Citation2014; Yang et al. Citation2019), they are fundamentally consistent. The main reasons for the consistency are the application of the “plane section assumption” and the definition manner of the failure states. For example, in the study of CFST columns made by An and Han (Citation2014), two kinds of failure modes were proposed and called compression-controlled failure and tension-controlled failure. Compared to this study, compression-controlled failure is equivalent to including the “compression failure mode” and “total yield failure mode,” while tension-controlled failure corresponds to the “tensile failure mode.”
2.3. Eccentric compression bearing capacity calculation method
Eccentric compression bearing capacity calculation methods for each failure mode can be established using the aspects introduced in Section 2.1 as the basis for analysis and the limit balance principle (axial force balance and bending moment balance). Based on the stress of the concrete, rebars, and steel tube, the axial force balance and moment balance formulas to be satisfied in the section can be established, which is the core idea of the limit balance principle.
To determine the stress in the concrete, it is necessary to determine the strain first. According to the failure characteristics, the concrete at the edge of the compression zone will be crushed in each failure mode. Based on the strain of the concrete at the edge of the compression zone (ɛc = εcu = 0.0033) and the plane section assumption, the strain of a fiber on the section at a vertical distance x from the neutral axis can be expressed as ɛ(x) = 0.0033x/xc, as shown in .
Figure 5. Strain state of normal section based on plane section assumption.
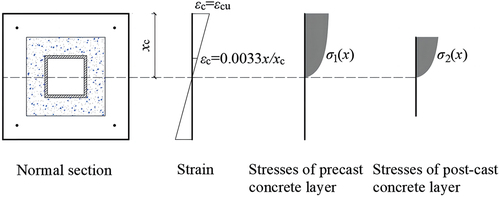
Subsequently, the concrete stress σc in the concrete compressive zone can be calculated according to its strain value εc and the constitutive relationship for concrete in GB 5Citation0010–2020 (2020), which is as follows:
where fc is the design value of the axial compressive strength of concrete. For the concrete of the precast layer and post-cast layer, fc is denoted by fc1 and fc2, respectively. n is a coefficient. ε0 is the concrete strain when the concrete compressive stress reaches fc. For ordinary SPSTDC columns whose strength grades are not greater than C50, n = 2 and ε0 = 0.002. The stress function of a precast concrete layer (σ1(x)) and the stress function of a post-cast concrete layer (σ2(x)) can be expressed respectively as follows:
Note that x ≤ 0.06061xc is obtained from ɛ(x) = 0.0033x/xc ≤ ɛ0 = 0.002.
According to the stress condition of concrete, the resultant force of the concrete part on the section can be obtained, and the axial force balance and moment balance formulas can be established. The following is a detailed demonstration of the limit balance principle, with the limit state of each failure mode as examples.
2.3.1. Limit state of compression failure mode
The stress and strain state of the normal section for the limit state of the compression failure mode is shown in . In this case, d is the height of the unyielding web of steel tube above the neutral axis, which can be obtained as follows:
Figure 6. Stress and strain state of the normal section for the limit state of the compression failure mode.
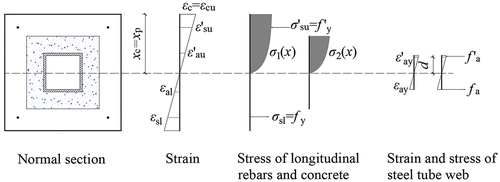
The load capacity N can be calculated by combining the following formulas, which were obtained from the balance of the axial force and bending moment of the normal section based on :
2.3.2. Limit state of total yield failure mode
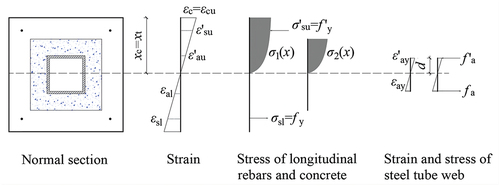
The stress and strain state of the normal section for the limit state of the total yield failure mode is illustrated in . d is also the height of the unyielding web of steel tubes above the neutral axis, which can be obtained using Formula 9. The axial force balance and bending moment balance for the normal section can be established as follows:
Figure 7. Stress and strain state of the normal section for the limit state of the total yield failure mode.
2.3.3. Limit state of tensile failure mode
The stress and strain state of the normal section for the limit state of the tensile failure mode is illustrated in . d’ is the height of unyielding steel tube web below the neutral axis, which can be obtained as follows:
Figure 8. Stress and strain state of the normal section for the limit state of the tensile failure mode.
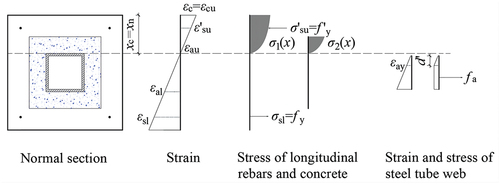
According to , the following formula can be obtained from the axial force balance of the section:
The following formula can be deduced in terms of the bending moment balance in the normal section:
2.4. Discussion of concrete material and steel material
For concrete, various types of strength grades can be adopted in theory. Based on the actual engineering application and the recommendation in the specification GB 50,010, the range of the concrete strength recommended for SPSTDC columns is from C30 to C50. For steel tubes, there are two commonly used strength grades: Q235 and Q345. Both of these strength grade steel tubes can be used in SPSTDC columns. Based on the performance requirements and costs, Q235 steel tubes are more recommended in actual engineering. In addition, for the longitudinal rebars and stirrups used in a precast concrete layer, four grades and seven types of steel bars are available in China: HPB300, HRB335, HRB400, HRBF400, RRB400, HRB500, HRBF500. However, currently in engineering applications, it is generally only recommended to use HRB400 type steel bars.
3. Test overview and validation of formulas
3.1. Test overview
The experimental SPSTDC column specimens had lengths of 1300 mm and 240 mm × 240 mm cross-sectional dimensions. The reinforcement cages in the precast concrete layer were formed using four HRB400 longitudinal reinforcement bars with diameters of 12 mm, along with HRB400 stirrups with diameters of 6 mm and spacings of 100 mm. The thickness of the protective layer was 15 mm, which resulted in as = 27 mm. Square steel tubes with strength grades of Q235 and wall thicknesses of 5 mm were employed. To demonstrate the representativeness of the experiments, two different side lengths were selected for the square steel tube: 80 and 100 mm.
Corresponding to Section 2.3.1, the eccentricity value e0 selected during loading was determined based on the limit state of the compression failure mode. Through calculations, the e0 values for SPSTDC column specimens with square steel tubes of side lengths 80 and 100 mm were determined to be 130 and 150 mm, respectively. Detailed information about these two specimens is presented in and .
Figure 9. Details of the specimens.
Table 2. Detailed information of all specimens.
The precast concrete and post-cast concrete were designed to have strength grades of C30 and C40, respectively. The mixture designs of the precast concrete and post-cast concrete are presented in . According to GB/T 50107 (Citation2010) and GB/T 228.1–Citation2021 (Citation2021), the mechanical characteristics of the concrete and steel were tested. The test results are shown in , respectively.
Table 3. Mixture designs of concrete (unit: kg/m3.).
Table 4. Main mechanical parameters of concrete.
Table 5. Main mechanical parameters of steel.
3.2. Validation of calculation methods
The two specimens mentioned in , SPSTDC-80-130 and SPSTDC-100-150, were loaded on a 500-T hydraulic loading machine until failure to obtain the test bearing capacity (Nt). In the test, no significant slip between the steel tube and concrete was observed, indicating good bonding between each part. Subsequently, a comparison between the calculated bearing capacity (Nc) values obtained using the calculation methods in Section 2.3.1 and the Nt values is presented in , which shows small differences between Nc and Nt, with an average ratio of 0.96.
Table 6. Comparison of Nc and Nt values for specimens.
3.3. Comparison with the calculation results of code YB 9082–2006
In YB 9082–2006, the principle of superposition is adopted for calculating the bearing capacities of SRC columns, which is a relatively simple approach. The calculation is based on the following formulas:
where Nst and Mst represent the axial force and bending moment borne by the steel tube, respectively, Nrc and Mrc represent the axial force and bending moment borne by the RC, respectively, Nau represents the compressive bearing capacity of the column axis, ,
is the axial compressive capacity of steel tube,
is the axial compressive capacity of the RC, Nb is the axial compression bearing capacity of boundary failure, and Mbst is the bending bearing capacity of the steel tube.
The bearing capacities of test specimens were calculated using the method recommended in YB 9082–2006. The calculated results, NY, are shown in . It can be seen that the results calculated using the YB 9082–2006 method were more conservative than those calculated using the proposed method, and the deviations from the test values were within 10%–20%.
Table 7. Comparison of Nc and Nt values for specimens.
4. Numerical simulation analysis
4.1. Materials
4.1.1. Concrete
The concrete damage plasticity (CDP) model is widely adopted in finite element simulations of the nonlinear mechanical behaviors of concrete structures under low confining pressures. The calculation method of concrete damage indices proposed by Sidoroff (Citation1981), which applies the principle of energy equivalence, is utilized in this model. The expression for this calculation method is as follows:
where d represents the concrete damage factor, σ denotes the concrete strain, ε represents the corresponding strain, and Ec represents the concrete elastic modulus. Based on previous research results (Lu et al. Citation2023; Zhang et al. Citation2008), the relevant parameter values of the CDP model are shown in , and this model was employed as the material model for concrete in this work.
Table 8. Parameters in concrete damage plasticity (CDP) model.
The recommended tensile stress–strain relationship and compressive stress–strain relationship of concrete in GB 5Citation0010–2020 (2020), which are widely adopted by Chinese scholars, were adopted here. According to GB 5Citation0010–2020 (2020), the uniaxial tensile and compressive stress–strain formulas of concrete are shown respectively as follows:
where ft is the uniaxial tensile strength of concrete, αt is the parameter of the descending section of the uniaxial tensile curve of concrete, εtu is the peak tensile strain of the concrete uniaxial tensile constitutive equation, εt is the tensile strain of the concrete uniaxial tensile constitutive equation, αa is the parameter of the rising section of the concrete uniaxial compression constitutive curve, αd is the parameter of the descending section of the concrete uniaxial compression constitutive curve, fc is the uniaxial compressive strength of concrete, εc is the peak compression strain of the concrete uniaxial compression constitutive equation, and εt is the compressive strain of the uniaxial compressive constitutive equation.
4.1.2. Steel
In this work, the steel stress–strain relationship suggested in GB 5Citation0010–2020 (2020) was employed as the constitutive relationship for the steel tubes and rebars. The steel utilized in this study employed the ideal elastoplastic model, as steel that experiences large deformations is no longer suitable for bearing loads once its strain reaches 0.02–0.03 (Shen et al. Citation2018) when yielding. Initially, the stress–strain relationship of steel varied linearly, and upon reaching its yield stress, the stress remained constant, while the strain continued to increase. This stress–strain relationship is expressed as follows:
where σ represents the steel stress, ε denotes the corresponding strain, Es represents the steel elastic modulus, and fy represents the steel yield stress.
4.2. Interactions and boundary conditions
The “embed in” constraint was utilized to embed the reinforcement cage into the precast layer, assuming no relative slip between the reinforcement cage and the precast concrete. Furthermore, since relative slip could be ignored, “tie” constraints were applied to the contact surface between the precast and post-cast concrete layers, as well as at the contact surface between the post-cast concrete layer and the steel tube. Additionally, “tie” constraints were also implemented at the contact surface between the end plates and column ends.
Reference points RP1 and RP2 were set at the eccentric positions of the upper and lower end plates, respectively. To ensure that the simulation conditions were consistent with the tests, RP1 was set to be articulated (U1 = 0, U2 = 0, R1 = 0, R3 = 0), and RP2 was also set to be articulated (U1 = 0, U2 = 0, U3 = 0, R1 = 0, R3 = 0). To improve the convergence of the model calculations, the displacement load was implemented by setting the Z-direction displacement of RP1 to U3 = −10 mm, as illustrated in .
Figure 10. Establishment of ABAQUS model.
4.3. Element types and mesh size
An eight-node reduced integral solid element (C3D8R element) was used for modeling the steel tube and concrete, while the rebars were meshed using two-node linear truss elements (T3D2 elements). To reduce the computational time and minimize the effect of the end plates on the simulation results, the end plate used four-node shell elements (S4R element). The element types are shown in .
The mesh size is a critical parameter that significantly influences the result accuracy. It is commonly understood that using a large mesh size may lead to reduced calculation accuracy, while a smaller mesh size can yield a higher accuracy, albeit at the expense of longer computation times. Striking a balance between accuracy and computational efficiency is crucial for choosing an appropriate mesh size for numerical simulations. In this paper, the SPSTDC-100-150 column mentioned in was selected as an example model to discuss the effect of the mesh size, as shown in . The results showed notable distinctions in the bearing capacity and load-decreasing segments between models with mesh sizes of 80 and 50 mm, as opposed to models with mesh sizes of 20 and 10 mm. The curves of the models with mesh sizes of 20 and 10 mm exhibited remarkable similarity, suggesting that their accuracies were comparable. However, it should be highlighted that the computational time for the model with a mesh size of 10 mm was significantly higher than those of the models with other mesh sizes. Consequently, a mesh size of 20 mm was chosen for the model in this study.
Figure 11. Mesh convergence analysis.
4.4. Verification of numerical simulation model
4.4.1. Failure characteristics
The visualization module in ABAQUS could not directly display cracks of the concrete. Typically, the development of cracks can be determined by using the equivalent plastic strain (PEEQ) contour map of the concrete. The darker areas in the PEEQ cloud map indicate a higher plastic strain of the concrete, which can reflect the failure location of the concrete. shows a comparison between the PEEQ cloud maps and the actual failure of the SPSTDC-80-130 and SPSTDC-100-150 columns obtained by the tests. As shown in , the simulation results exhibited a high degree of agreement with the observed failure morphologies of the specimens, indicating good consistency between the established model and tests.
Figure 12. Comparison between equivalent plastic strain (PEEQ) cloud maps and the actual failure states of specimens.
4.4.2. Load–lateral deflection curves
shows the comparison of the load–lateral deflection curves between each specimen and the corresponding numerical simulation model results. As shown in , although some differences existed between the simulation and test curves, the overall trends were largely consistent. All the curves can be divided into two major stages: upward and downward. For the simulation curves, the slopes of its rising segment were generally slightly larger than those of the test curves while the slopes of its falling segment were generally slightly smaller than those of the test curves. Moreover, the positions of the peak loads aligned well with test results, indicating good agreement between the simulations and tests.
Figure 13. Load–lateral deflection curve comparison.
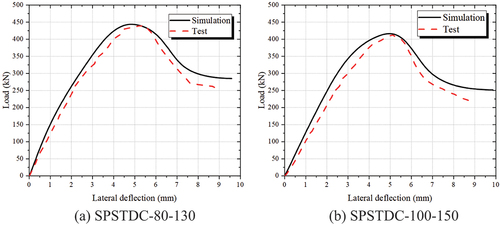
presents the comparison of test bearing capacity (Nt) and simulated bearing capacity (Ns) values for the SPSTDC-80-130 and SPSTDC-100-150 columns. The values of Nt/Ns for these two specimens are 0.99 and 0.98, respectively. The results reveal that the differences between the Nt and Ns values were less than 10%, with an average deviation of 0.015 and a coefficient of variation of 0.007. This indicated that the established model was reliable for investigating the eccentric mechanical behaviors of SPSTDC columns.
Table 9. Comparison of test and simulated bearing capacity values.
4.5. Establishment of N–M correlation curve
Based on the verified finite element model, SPSTDC columns with different eccentricity values could be studied quickly and effectively. For this model, it was determined that the eccentricity value (eb) corresponding to the limit state of the tensile failure mode was 417 mm. The corresponding value of e0 was 413 mm. Subsequently, 20 different eccentricity values (e0 = 0, 10, 15, 20, 25, 35, 40, 45, 50, 55, 60, 80, 100, 130, 160, 200, 219, 280, 360, and 413 mm) were selected in the range of 0–eb. The SPSTDC columns with these e values exhibited the three failure modes discussed above. The corresponding bearing capacity (Ns) values determined by numerical simulations were obtained.
Each Ns can be multiplied by the corresponding e value to obtain the corresponding moment bearing capacity Ms. Subsequently, the Ns–Ms curve, which can more fully demonstrate the eccentric compression performances of SPSTDC columns, was drawn, as shown in . It is noteworthy that this Ns–Ms curve is suitable for the eccentricity range of 0–eb (eb = 417 mm, e0 = 413 mm). Therefore, the starting point of the ordinate in is the ordinate of point D (92 kN), which is the corresponding bearing capacity for eb = 417 mm.
Figure 14. Ns–Ms curve.
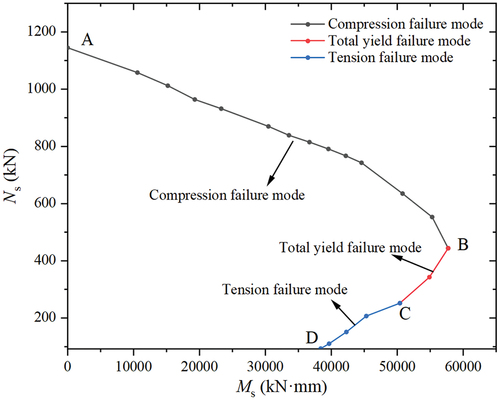
In , segment AB represents the compression failure mode, segment BC represents the total yield failure mode, and segment CD represents the tensile failure mode. As shown in , within the range of the compression failure mode, the ultimate vertical force value Ns of the SPSTDC columns decreased with the increase in the ultimate bending moment value Ms. However, within the range of the total yield failure mode and tensile failure mode, Ns increased with the increase in Ms.
4.6. N–M correlation curve comparison with the concrete-filled steel tube column
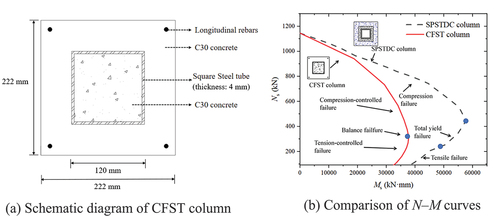
In a previous study, a type of CFST column had a cross-sectional form similar to that of the SPSTDC column (An and Han Citation2014). In contrast to SPSTDC columns, its steel tube contained concrete inside, and the concrete was poured at the construction site. Both the steel tube and the concrete outside were prefabricated in the factory. To compare the mechanical properties of these two columns, the cross-sectional dimensions of the CFST column were designed as depicted in (), which ensured equivalent material contents in both the CFST and SPSTDC columns. Subsequently, the Ns–Ms curves of these two types of columns were obtained by numerical simulations, as shown in (). It can be seen that the shapes of these two curves were very similar, though only two failure modes of the CFST columns are referred to (compression-controlled failure and tension-controlled failure). Furthermore, the area of the graph enclosed by the N–M curve and the coordinate axis for the CFST column was smaller than that for the SPSTDC column. When the N value was the same, the M value corresponding to the CFST columns was smaller, indicating that the corresponding eccentricity value was smaller.
Figure 15. N-M correlation curve comparison with CFST column.
4.7. Analysis of influence parameters of eccentric compression bearing capacity
To further study the failure mechanism of the SPSTDC columns under eccentric loads, extended influence parameter analysis based on the verified ABAQUS model was carried out. The influence parameters considered include the eccentricity, strength grades of the precast and post-cast concrete, steel ratio, and strength of the steel tube.
4.7.1. Eccentricity
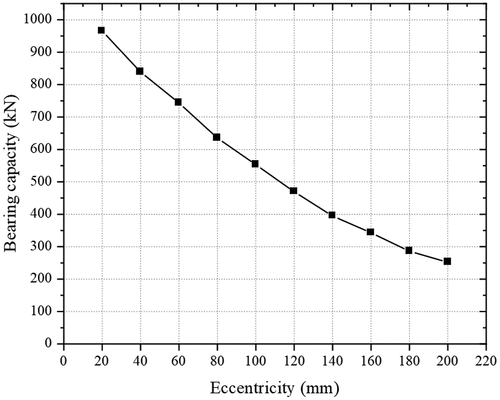
The eccentricity could significantly affect the eccentric compression bearing capacity of the SPSTDC column, Nu. As depicted in , the bearing capacity–eccentricity curve indicates that the bearing capacity decreased as eccentricity increased, primarily due to the reduction of the concrete compression area. It is also noteworthy that the degree of decrease gradually decreased as the eccentricity increased.
Figure 16. Bearing capacity–eccentricity curve.
4.7.2. Strengths of precast and post-cast concrete
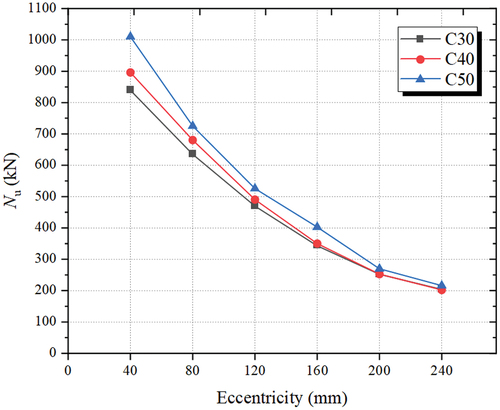
The bearing capacities of SPSTDC columns with different precast concrete strengths were studied by using six different e values as examples, and the results are shown in . It is evident that Nu increased with the increase in the precast concrete strength for all examples. In addition, for the SPSTDC column with e = 40 mm, the Nu value increased by 20.39% (from 839 to 1010 kN) when the strength grade of the precast concrete increased from C30 to C50. For the SPSTDC columns with e = 160 and 240 mm, the Nu values increased by 17.49% and 5.56%, respectively, with the same increase in precast concrete strength. This tendency implied that the effect of the precast concrete strength on Nu diminished with increasing eccentricity. The main reason was the reduction of the effective compressive area of the precast concrete.
Figure 17. Bearing capacity–precast concrete strength curve.
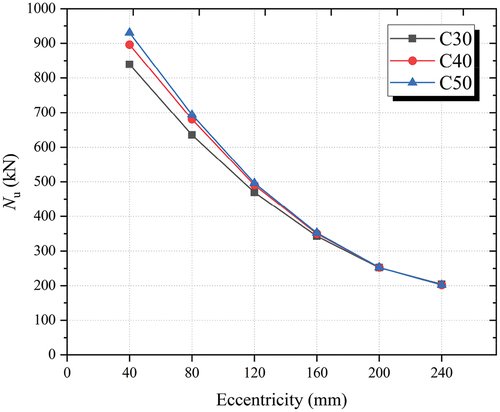
With the same effect as that of the precast concrete strength, the increase in the post-cast concrete strength could increase the Nu values of the SPSTDC columns, especially for columns with small eccentricities, as shown in . However, it is worth noting that the strength of the post-cast concrete had a smaller influence on Nu than the precast concrete. With the SPSTDC column with e = 80 mm as an example, when the strength grade of the post-cast concrete increased from C30 to C50, the Nu value increased by 9.29% (from 635 to 694 kN). In contrast, the Nu value increased by 15.17% when the strength grade of the precast concrete increased from C30 to C50.
Figure 18. Bearing capacity–post-cast concrete strength curve.
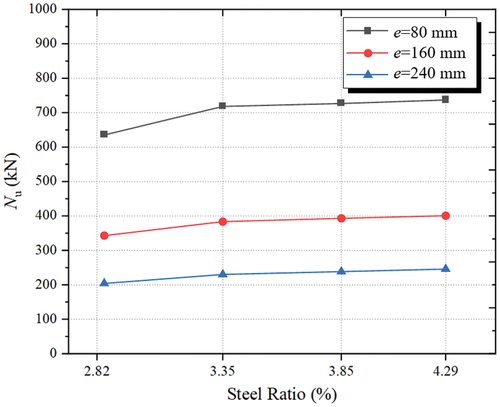
4.7.3. Steel ratio αa
The steel ratio is defined αa = Aa/A ×100%, where Aa is the cross-sectional area of the steel tube, and A is the cross-sectional area of the SPSTDC column. The eccentric compression bearing capacities of SPSTDC columns with different αa values were studied by using three different e values as examples. The results are shown in . It is evident from the figure that Nu increased with the increase in the αa value for all examples. In addition, for the SPSTDC column with e = 80 mm, the Nu value increased by 16.06% (from 635 to 737 kN) when the αa value increased from 2.85% to 4.28%. For the SPSTDC columns with e = 160 and 240 mm, the Nu value increased by 16.91% and 20.59%, respectively, with the same increase in the αa value. This trend suggested that the effect of the αa value on Nu increased with increasing eccentricity.
Figure 19. Bearing capacity–αa curve.
4.7.4. Strength of steel tube
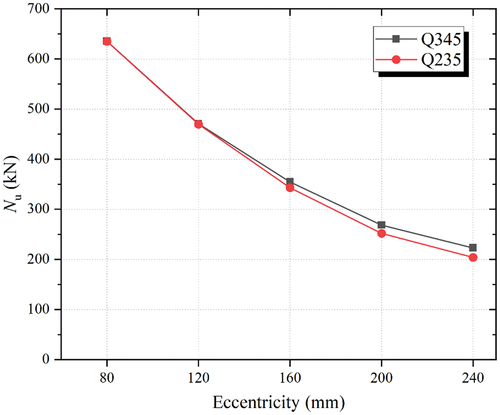
The values of the bearing capacity Nu of SPSTDC columns with two different steel tube strengths (Q235 and Q345) were studied for five different e values (80, 120, 160, 200, and 240 mm) as examples. The results are shown in . It is evident that the Nu values of the SPSTDC columns with varying steel tube strengths were very close, indicating that the steel tube strength had little effect on Nu. Furthermore, it is noteworthy that the influence of the steel tube strength on Nu increased slowly with the increase in the e value.
Figure 20. Bearing capacity–steel tube strength curve.
4.8. Ductility analysis
The ductility of an SPSTDC column can be characterized by the horizontal lateral deflection under a load. Based on the verified ABAQUS model, the parameter influence on the ductility was also analyzed. Due to space limitations, only the relevant results regarding the eccentricity and steel ratio αa are presented here.
4.8.1. Eccentricity
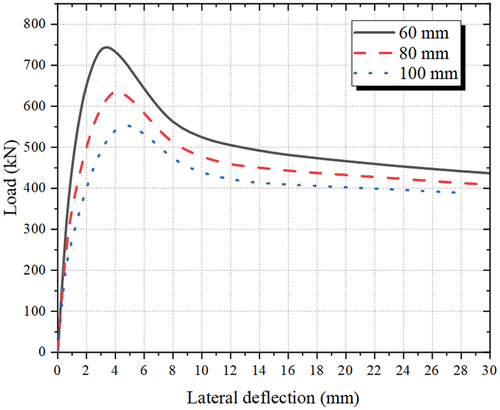
The eccentricity had a significant impact on the horizontal lateral deflections of the SPSTDC columns. For the mid-height section of the SPSTDC column, horizontal lateral deflections during loading corresponding to different eccentricities (60, 80, and 100 mm) are shown in . It is evident that with increasing eccentricity, the horizontal lateral deflection corresponding to the peak load (bearing capacity, Nu) increased. This was because the area of the tension zone in the normal section gradually increased with the increase in the eccentricity, resulting in high ductility of the steel tube.
Figure 21. Impact of the eccentricity on the horizontal lateral deflection of the mid-height section.
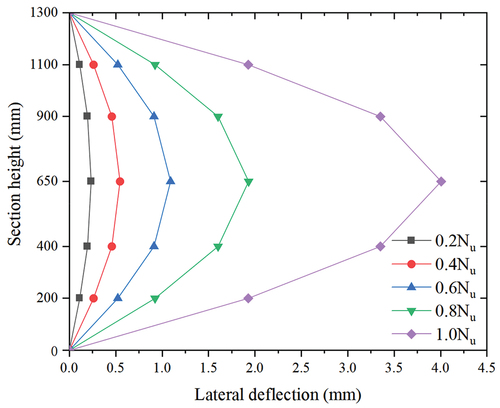
Furthermore, the horizontal lateral deflections of sections at different heights (200, 400, 650, 900, and 1100 mm) were studied by using an example with e = 80 mm. Lateral deflection–section height curves during loading were obtained, as shown in . It can be seen that in the initial stage of loading (load increased from zero to 0.6Nu), the lateral deflection of each section changed little with the increase in the load. When the load increased from 0.6Nu to 1.0Nu, the increase in the lateral deflection accelerated significantly. Furthermore, the horizontal lateral displacement of the mid-height section remained the largest compared to those of other sections. Therefore, the mid-height section can be seen as the most dangerous section for calculating the eccentric compression bearing capacity.
Figure 22. Horizontal lateral deflection–section height curves during loading.
4.8.2. Steel ratio αa
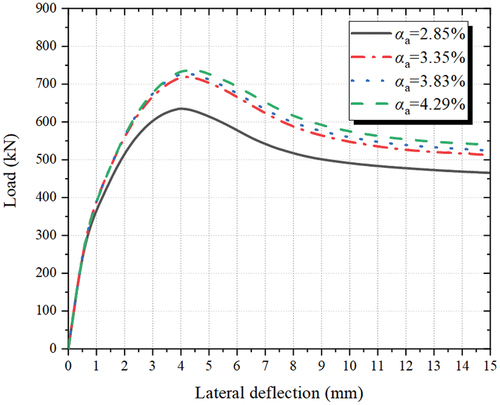
The value of αa also had a significant impact on the horizontal lateral deflection. For the mid-height section of the SPSTDC column, horizontal lateral deflections during loading corresponding to different αa values (2.85%, 3.35%, 3.83%, and 4.29%) are shown in . It can be observed that as the αa value increased, the horizontal lateral deflection corresponding to Nu also increased, indicating an enhanced deformation capacity and ductility of the column.
Figure 23. Lateral displacement–load curve corresponding to different αa values.
4.9. Stiffness analysis
The lateral stiffness was quantitatively studied using the calculation method proposed by James and Barry, (Citation2013). The lateral deflection–load curve can be divided into four parts, as shown in : Part A (0%–25% Nu), Part B (25%–50% Nu), Part C (50%–75% Nu), and Part D (75%–100% Nu). The stiffness of each part can be calculated by the slope of the connection line. For example, for Part B, the stiffness BB can be obtained as follows:
Figure 24. Division of lateral deflection–load curve.
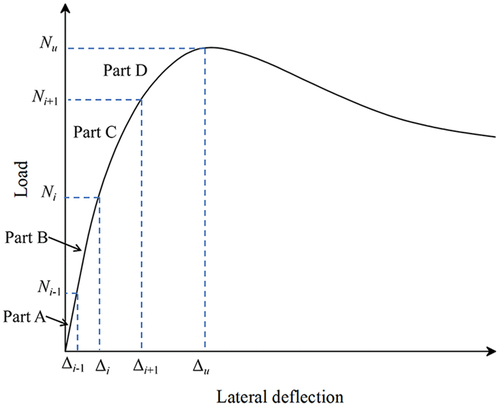
where BB is the lateral stiffness of Part B, Δi-1 and Δi are the lateral deflection values of the points shown in , and Ni-1 and Ni are the load values of the corresponding points.
The stiffness values of each part for different precast concrete strengths, post-cast concrete strengths, steel ratios, and steel tube strengths were obtained, as shown in . The lateral stiffness of each part increased with the increase in concrete strength, steel strength, and steel ratio. When the strength of the precast concrete increased from C30 to C50, Part C exhibited the most substantial increase in stiffness (reaching up to 6.84%), while Part A exhibited the lowest increase in stiffness (only reaching 2.85%). Furthermore, the increase in concrete strength in the post-cast layer resulted in a 5.25% increase in the stiffness of Part C, which was slightly less than the effect of the concrete strength of the precast layer. As the strength ratio increased, the lateral stiffness also increased the most in Part C, reaching 4.17%, and the least in Part A, reaching 3.39%. In addition, the steel tube strength had little effect on the improvement of the lateral stiffness for each part.
Figure 25. Lateral stiffness.
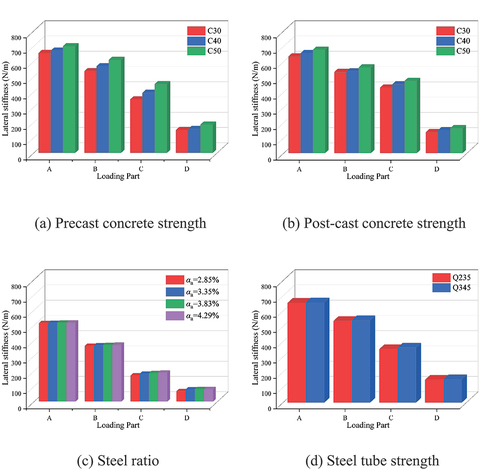
Based on the above results, it is evident that the strength of the precast concrete had the greatest impact on the lateral stiffness, whereas the steel tube strength had the least impact on the lateral stiffness. Furthermore, it can be seen that the lateral stiffness of Part C was most affected by the parameters under consideration. This phenomenon can be attributed to the specimen reaching an elastic–plastic state in Part C, where the mechanical behavior was noticeably influenced by the material properties.
5. Conclusions
In this paper, the SPSTDC column, a column that is prepared via prefabricated assembly, was introduced as a new kind of SRC column. The eccentric compression mechanical behavior of the SPSTDC column was studied in detail by theoretical analysis, experiments, and numerical simulations. Typical eccentric compression failure modes and the corresponding bearing capacity calculation method were discussed based on theoretical analysis. The model of the SPSTDC column was established by ABAQUS, and its rationality was verified through comparisons with test results. Subsequently, the N–M curves were plotted. Based on the established model, the effects of the eccentricity, concrete strength grade, steel ratio, and steel tube strength on the eccentric compressive bearing capacity were explored. The following main conclusions can be drawn:
Three possible failure modes of the SPSTDC columns were identified based on the different core features, namely compression failure, total yield failure, and tension failure.
Calculation methods of the eccentric compression bearing capacity (Nu) for each failure mode were established based on the limit balance principle. The calculation accuracy was verified by comparisons with experimental results. The discrepancies between the calculated values Nc and the experimental values Nt were small, with an average ratio of 0.96. Nu decreased with the increase in the eccentricity, and the degree of reduction gradually decreased. Nu increased with the precast concrete strength, and its effect on Nu diminished with increasing eccentricity. However, the post-cast concrete strength had a smaller effect on Nu than the precast concrete. Nu increased with the increase in the steel ratio αa value. The steel tube strength had little influence on Nu, but its impact gradually increased as the e value increased.
The N–M correlation curve of the SPSTDC column can be divided into three segments, corresponding to the compression failure mode, total yield failure mode, and tension failure mode. For the compression failure mode, the ultimate vertical load value (Ns) decreased with the increase in the ultimate bending moment value (Ms). For the total yield failure mode and the tensile failure mode, the value of Ns increased with the increase in Ms. The N–M curves of the CFST and SPSTDC columns were very similar, while the M values corresponding to the CFST columns were smaller than those of the SPSTDC columns when the N values were the same.
The ductility of the SPSTDC columns can be characterized by the horizontal lateral deflection under a load. The eccentricity also had a significant impact on the horizontal lateral deflections of the SPSTDC columns. With the increase in the eccentricity, the horizontal lateral deflection corresponding to the peak load (Nu) increased. Lateral deflection–section height curves during loading showed that in the initial stage of loading (when the load increased from zero to 0.6Nu), the lateral deflection of each section changed little with the increase in the load. When the load increased from 0.6Nu to 1.0Nu, the increase in the lateral deflection accelerated significantly. Furthermore, the horizontal lateral displacement of the mid-height section remained the largest compared with those of other sections.
The lateral stiffness was characterized by the lateral deflection–load curve, which was divided into four parts. The lateral stiffness in each part increased with the increase in the concrete strength, steel strength, and steel ratio. The most notable change was observed in Part C (50%–75% Nu). The impact of the precast concrete strength was the most significant (for example, when the precast concrete strength increased from C30 to C50, the stiffness increases of Part C reached up to 6.84%), while the influence of the steel tube strength was the weakest.
In summary, the research results of this paper provide technical support and a basis for the application of SPSTDC columns as vertical load-bearing components of structures, which can further promote the development of prefabricated concrete and SRC structure technology. In the future, a more detailed study on the swelling effects of post-cast concrete and the ductility of the SPSTDC columns will be conducted. Furthermore, the quantitative mechanical properties of SPSTDC columns and other types of SRC columns will be compared in more detail in future research.
Acknowledgements
The authors gratefully acknowledge the financial support provided by the National Natural Science Foundation of China, grant number 51608311 and Program for Changjiang Scholars and Innovative Research Team in the University of China, grant number IRT13075.
Disclosure statement
No potential conflict of interest was reported by the author(s).
Additional information
Funding
Notes on contributors
Shunyao Wang
Shunyao Wang, Postgraduate, Research filed: steel-reinforced-concrete structure.
Yilin Wang
Yilin Wang, Ph.D., A. Professor, Research filed: steel-reinforced-concrete structure.
Dapeng Sheng
Dapeng Sheng, Postgraduate, Research filed: steel-reinforced-concrete structure.
Yu Wang
Yu Wang, Postgraduate, Research filed: steel-reinforced-concrete structure.
Jiaqi Wen
Jiaqi Wen, Postgraduate, Research filed: steel-reinforced-concrete structure.
References
- ACI. 2014. Building Code Requirements for Structural Concrete and Commentary (ACI 318M-2014). Farmington Hills, MI: American Concrete Institute.
- Ahmed, M., Q. Q. Liang, V. I. Patel, and M. N. Hadi. 2019. “Behavior of Eccentrically Loaded Double Circular Steel Tubular Short Columns Filled with Concrete.” Engineering Structures 201:109790. https://doi.org/10.1016/j.engstruct.2019.109790.
- AISC. 2010. Specification for Structural Steel Buildings. American Institute for Steel Construction. Chicago, IL: American Institute for Steel Construction.
- An, Y. F., and L. H. Han. 2014. “Behaviour of Concrete-Encased CFST Columns Under Combined Compression and Bending.” Journal of Constructional Steel Research 101:314–330. https://doi.org/10.1016/j.jcsr.2014.06.002.
- Cao, B., L. Zhu, X. Jiang, and C. Wang. 2022. “An Investigation of Compression Bearing Capacity of Concrete-Filled Rectangular Stainless Steel Tubular Columns Under Axial Load and Eccentric Axial Load.” Sustainability 14 (14): 8946. https://doi.org/10.3390/SU14148946.
- Chen, Z., H. Liao, J. Zhou, and P. Ye. 2022. “Eccentric Compression Behavior of Reinforced Recycled Aggregate Concrete Columns After Exposure to Elevated Temperatures: Experimental and Numerical Study.” Structures. 202243:959–976. https://doi.org/10.1016/J.ISTRUC.2022.07.018.
- China Academy of Building Research. 2010. Standard for Evaluation of Concrete Strength, China Architecture & Building Press, Beijing, China. GB/T50107–2010.
- China Academy of Building Research. 2016. “Code for Design of Composites”. [JGJ 138-2016in Chinese] In Chinese National Standard, 43–52. Beijing: China Architecture and Building Press.
- CN. 1978. Design Guide for Reinforced Concrete Structure: CN 3-78, 3–78. Moscow: Ministry of Electric Power Construction of the Soviet Union.
- Euro code 4. 2004. Design of Composite Steel and Concrete Structures, Part 1.1: General Rules and Rules for Building: BS EN 1994-1-1: Euro Code 4. London: European Committee for Standardization.
- GB 50010-2020. 2020. Code for Design of Concrete Structures. In Chinese. BeijingBeijing, China: China Architecture & Building Press.
- GB/T 228.1-2021. 2021. Metallic Materials-Tensile Testing Part 1: Method of Test at Room Temperature. 2021In Chinese. Beijing, China: China standard press.
- James, M., and J. Barry. 2013. “Mechanics of Materials”. Stamford, American: Cengage Learning.
- Lai, B., J. Y. Liew, and S. Li 2018. “Finite Element Analysis of Concrete-Encased Steel Composite Columns with Off-Center Steel Section.” In Proceedings of the 12th International Conference on Advances in Steel-Concrete Composite Structures. ASCCS 2018 (pp. 297–303). Editorial Universitat Politècnica de València. https://doi.org/10.4995/ASCCS2018.2018.7005.
- Li, G. C., B. W. Chen, Z. J. Yang, Y. P. Liu, and Y. H. Feng. 2021. “Experimental and Numerical Behavior of Eccentrically Loaded Square Concrete-Filled Steel Tubular Long Columns Made of High-Strength Steel and Concrete.” Thin-Walled Structures 159:107289. https://doi.org/10.1016/J.TWS.2020.107289.
- Lu, Z., B. Wu, H. Sakata, J. Huang, and M. Zhang. 2023. “Mechanical Performance of Prefabricated Concrete Beam-Column Joints with Double-Grouted Sleeve Connectors: A Numerical and Theoretical Study.” Structures. 202356:104870. https://doi.org/10.1016/J.ISTRUC.2023.07.060.
- MCC Construction Research Institute et al. 2007. Technical Specification of Steel-Reinforced Concrete Structures YB9082-2006. In Chinese National Standard, BeijingBeijing: Metallurgical Industry Press. In Chinese
- Naghipour, M., M. Ahmadi, and M. Nematzadeh. 2022. “Effect of Concrete Confinement Level on Load-Bearing Capacity of Steel-Reinforced Concrete (SRC) Columns Under Eccentric Loading: Experiment and FEA Model.” Structures 25:8–23. 2020. https://doi.org/10.1016/J.ISTRUC.2021.10.094.
- Pour, A. K., A. Shirkhani, N. S. Hamzehkolaei, Y. Zhuge, and E. Farsangi. 2023. “Performance Evaluation of Composite Concrete-Filled Steel Tube Columns by Steel Fibers and Different Cross-Section Shapes: Experimental and Numerical Investigations.” Journal of Constructional Steel Research. 2023200:107656. https://doi.org/10.1016/J.JCSR.2022.107656.
- Ren, Q., J. Ding, Q. Wang, and H. Lou. 2021. “Behavior of Slender Square Hollow Steel-Reinforced Concrete Columns Under Eccentric Compression.” Journal of Building Engineering 43:103133. https://doi.org/10.1016/J.JOBE.2021.103133.
- Shen, Z., Y. Chen, Y. Chen, and X. Zhao. 2018. “Basic Principle of Steel Structure”. 2018in Chinese. Beijing, China: China Architecture & Building Press.
- Shi, Y., W. Xian, W. D. Wang, and H. W. Li. 2020. “Mechanical Behaviour of Circular Steel-Reinforced Concrete-Filled Steel Tubular Members Under Pure Bending Loads.” Structures. 202025:8–23. https://doi.org/10.1016/j.istruc.2020.02.017.
- Sidoroff, F. 1981. “Description of Anisotropic Damage Application to Elasticity Physical Non-Linearities in Structural Analysis: Symposium Senlis, edited byJ. Hult, 237–244. France: Springer.
- Wang, J., Y. Duan, W. Sun, and X. Yi. 2021. “An Investigation of Bearing Capacity of High-Strength SRC Columns Under Eccentric Axial Load.” Buildings 11 (12): 639. https://doi.org/10.3390/BUILDINGS11120639.
- Wang, R., L. H. Han, D. Lam, and T. Sheehan. 2018. “Behaviour of Octagonal Steel-Reinforced Concrete Box Columns Under Compressive Load.” Magazine of Concrete Research 70 (16): 838–855. https://doi.org/10.1680/jmacr.16.00246.
- Wang, L. K., S. Nagarajaiah, W. X. Shi, and Y. Zhou. 2022. “Seismic Performance Improvement of Base-Isolated Structures Using a Semi-Active Tuned Mass Damper.” Engineering Structures 271:114963. https://doi.org/10.1016/J.ENGSTRUCT.2022.114963.
- Wang, L. K., W. X. Shi, and Y. Zhou. 2019. “Study on Self-Adjustable Variable Pendulum Tuned Mass Damper.” The Structural Design of Tall & Special Buildings 28 (1): e1561. https://doi.org/10.1002/tal.1561.
- Wang, L. K., W. X. Shi, and Y. Zhou. 2022. “Adaptive-Passive Tuned Mass Damper for Structural Aseismic Protection Including Soil–Structure Interaction.” Soil Dynamics and Earthquake Engineering 158:107298. https://doi.org/10.1016/j.soildyn.2022.107298.
- Wang, S., Y. Wang, D. Sheng, and Y. Wang. 2022. “Study on New Prefabricated Reinforced Concrete Structure Technology Based on Fault-Tolerant Design.” Buildings 12 (6): 814. https://doi.org/10.3390/BUILDINGS12060814.
- Wang, F., B. Young, and L. Gardner. 2021. “Testing and Numerical Modelling of Circular CFDST Cross-Sections with Stainless Steel Outer Tubes in Bending.” Engineering Structures 247:113170. https://doi.org/10.1016/J.ENGSTRUCT.2021.113170.
- Wang, L. K., Y. Zhou, S. Nagarajaiah, and W. X. Shi. 2023. “Bi-Directional Semi-Active Tuned Mass Damper for Torsional Asymmetric Structural Seismic Response Control.” Engineering Structures 294:116744. https://doi.org/10.1016/J.ENGSTRUCT.2023.116744.
- Yang, Y., Y. Chen, W. Zhang, and S. Feng. 2019. “Behavior of Partially Precast Steel Reinforced Concrete Columns Under Eccentric Loading.” Engineering Structures 197:109429. https://doi.org/10.1016/j.engstruct.2019.109429.
- Zhang, J., Q. Wang, S. Hu, and C. Wang. 2008. “Parameters Verification of Concrete Damaged Plastic Model of ABAQUS.” Building Structure 8:127–130. https://doi.org/10.19701/j.jzjg.2008.08.036.
- Zhang, H., L. K. Wang, and W. X. Shi. 2023. “Seismic Control of Adaptive Variable Stiffness Intelligent Structures Using Fuzzy Control Strategy Combined with LSTM.” Journal of Building Engineering 78:107549. https://doi.org/10.1016/J.JOBE.2023.107549.
- Zhang, Y., H. Zhao, R. Wang, and P. Chen. 2023. “Study on Nu-Mu Correlation Curves of Concrete Filled Double Skin Steel Tubular (CFDST) Beam-Columns with External Stainless-Steel Tube.” Engineering Mechanics 2:124–134. In Chinese. https://doi.org/10.6052/j.issn.1000-4750.2021.08.0637.
- Zhou, X., B. Yan, and J. Liu. 2015. “Behavior of Square Tubed Steel Reinforced-Concrete (SRC) Columns Under Eccentric Compression.” Thin-Walled Structures 91:129–138. https://doi.org/10.1016/j.tws.2015.01.022.
- Zhu, X. H. 2015. Behavior of Hollow Steel Reinforced Concrete Columns Under Eccentric Compression. In Chinese. Xi’an: Xi’an University of Architecture and Technology.