
 ?Mathematical formulae have been encoded as MathML and are displayed in this HTML version using MathJax in order to improve their display. Uncheck the box to turn MathJax off. This feature requires Javascript. Click on a formula to zoom.
ABSTRACT
Amidst today’s climate change-related environmental risks, both new and experienced investors may face uncertainty and lack of direction when preparing for investments, particularly in large-scale urban development projects. Therefore, guidance in construction investment, especially during the planning stage, becomes crucial to enhance the likelihood of success in coastal urban development projects and promote sustainable development. This study offers a valuable tool that integrates quantitative approaches like the “Balanced Scorecard” (BSC), “Analytical Network Process” (ANP), fuzzy theory, and “Decision Making Trial and Evaluation Laboratory” (DEMATEL) to create a strategic performance management framework focused on sustainable development. The model emphasizes the significance of investing in human resources, IT systems, and enterprise culture to foster business growth and development in urban coastal projects. Additionally, the study underscores the importance of internal control over project time, technology, quality, legal compliance, and resources, which serve as the driving forces behind operational processes. Furthermore, effective and flexible management of financial, social, and environmental activities is vital to ensure enterprise success while adhering to environmental, health, and safety requirements.
1. Introduction
According to the United Nations Agency for Sustainable Urban and Human Settlement Development, climate change will significantly impact coastal cities, particularly in densely populated coastal areas, especially in Asia, specifically Southeast Asia. This creates a contradiction as these regions are expected to experience a population boom and economic growth while also being vulnerable to climate change effects, including rising temperatures, sea levels, and increased natural disasters (Duraiappah et al., Citation2015; Randall et al., Citation2022). The natural landscape and coastal ecosystems are being utilized to convert abandoned coastal areas into resorts, hotels, and urban developments, driving economic growth in coastal cities. These projects are primarily undertaken by private investment companies and involve substantial capital investment. However, given the nature-sensitive locations of these projects, careful investment analysis and a long-term perspective are crucial, considering the challenges posed by climate change (Block & Paredis, Citation2013; Garcia, Citation2008; Marshall, Citation2004; Wheelen, Citation2012)
To ensure success in coastal urban projects, it is crucial to include sustainable development goals in strategic planning, project evaluation, and performance measurement to mitigate the impact of climate change. Project success can be determined by evaluating its own achievements or by assessing the outcomes it aims to accomplish. While traditional measures such as time, quality, cost, and safety remain prevalent in gauging project success, there has been a growing trend towards adopting multidimensional measures that consider sustainable development criteria as a key component (Cantele & Zardini, Citation2018; Castro et al., Citation2020; Gianni et al., Citation2017; Labuschagne et al., Citation2005; Nawaz & Koç, Citation2018; Singh et al., Citation2012)
Despite recent efforts by researchers to explore the sustainability aspects of project objectives, there is a limited implementation of sustainability measures and conventional project management criteria in the management of coastal projects. This has motivated the present study to propose an application model that combines sustainability goals with project management criteria to attain project success in coastal urban projects.
Multi-Criteria Decision Making (MCDM) is a potent instrument that can aid decision-makers in selecting options across a variety of interrelated matters. Upon evaluating the impact of such studies on the three dimensions of sustainable development, it appears that environmental considerations are receiving increasing attention, whereas social concerns have been largely overlooked. In terms of research, MCDM is primarily employed in strategic management. The exploration of issues pertaining to the economy has spurred interest in the investigation and implementation of MCDM in strategic management.
This study presents an integrated model called the BFAD framework to assist investment companies in strategically planning, evaluating, and monitoring urban coastal projects for sustainable development. To facilitate effective strategic planning for coastal urban development projects, this study suggests adopting the strategy map tool from the Balanced Scorecard method as the core of the planning model. Nonetheless, developing a logical strategy map poses a significant research challenge. Specifically, the study aims to address several detailed research questions, including whether the strategy map comprehensively incorporates the dimensions, objectives, and performance measures of coastal urban projects and whether the proposed strategic planning model is both logical and reliable. The primary objective of this study is to create a comprehensive strategic map for a coastal urban development project that incorporates sustainable development factors, ensuring its relevance, comprehensiveness, logic, and reliability. To achieve this aim, the study focuses on specific objectives: (1) Proposing and selecting strategic objectives and performance measures that align with sustainable development aspects suitable for coastal urban projects; (2) Developing a strategic map based on the “Balanced Scorecard” approach, integrating strategic objectives and selected performance measures; (3) Analyzing cause-and-effect relationships among strategic performance measures to ensure logical coherence; (4) Finalizing the strategy map and evaluating the model’s reliability.
The BFAD tool creates a strategic performance management framework by combining quantitative approaches with sustainability considerations, employing methods such as the Balanced Scorecard (BSC), Analytical Network Process (ANP), Fuzzy Logic, and Decision Making Trial and Evaluation Laboratory (DEMATEL). The tool starts with a relevant literature review to identify the most important criteria for operational criteria and strategic objectives. These strategic objectives and performance measures are structured around the strategic aspects of the “Balanced Scorecard”. Then, the collected survey data are analyzed using the “Fuzzy Logic” theory to limit subjectivity and increase data reliability before being entered into the ANP process to measure the relationship between objectives (project success criteria). Then, the DEMATEL method examines the overall relationships (indirect and direct) between them to create an Impact Relation Map (IRM). Organizations can use the IRM as a strategic map to measure, assess, and manage their performance to achieve project success in the presence of climate change risks.
This study demonstrates the integration of BSC, Fuzzy, ANP, and DEMATEL methods, aiming to surpass the limitations observed in previous studies. Several advantages distinguish this research. Firstly, strategic measures are formulated in a rational and scientific manner through the utilization of the BSC method. Secondly, the use of ANP ensures consistency in input data. Thirdly, by applying DEMATEL, the study facilitates the identification of causal relationships within strategic frameworks, setting it apart from other MCDM models in its ability to explain such relationships among performance criteria. This advantage enables decision-makers to gain better insights into the strategic activities that deserve their focus.
2. Literature review
2.1. Systematic review on coastal urban management strategies
This comprehensive overview encapsulates the key revelations derived from a meticulous exploration of the scientific literature concerning strategies aimed at the management of urban areas situated along coastlines. Commencing with a comprehensive bibliometric assessment, encompassing a spectrum of 832 documents encompassing articles, conference papers, and book chapters spanning the years 1980 through 2023, the study then delves into a thorough scientometric inquiry. The intricate bibliographic details of this scientific corpus were meticulously pinpointed and extracted from Scopus, a preeminent database in the realm of academic publication records. To curate the reference database germane to the aforementioned subjects, a well-defined set of search terms (“coastal AND urban AND management AND strategies”) was strategically deployed across title, abstract, and keyword searches. Within the temporal ambit stretching from 1980 to the present, a discernible evolution in the publication landscape with a focus on strategies for managing coastal urban areas emerges. Notably, the years between 1980 and 1990 yielded a mere 08 documents. However, the visual representation strikingly demonstrates a remarkable ascending trajectory primarily during the final decade of the 20th century. Taken together, this analysis accentuates an unmistakable upswing in research activity during the 21st century. It’s noteworthy that the cumulative tally of publications spanning from 2001 to 2010 (130 documents) is overshadowed by the volume of works disseminated in the second decade of the 21st century (650 documents). Performing a meta-analysis on the keywords found within the scientific publications can provide insights into the current trends and focal points. Illustrating this, visually presents the interconnections among keywords linked to publications regarding strategies for managing coastal urban areas. The graph exclusively depicts keywords that are present in a minimum of 15 publications from the dataset, encompassing 153 items out of the total 7178 terms encompassed by the dataset. Similar to before, the dimensions of the nodes, their colors, and the connecting lines all correspond to the quantity of keywords, the associations between them, and the strength of connections in the network, respectively. The scrutiny of the identified clusters reveals the classification of research themes into eight distinct categories, as outlined in .
Figure 1. Network visualization of keywords on coastal urban management strategies.
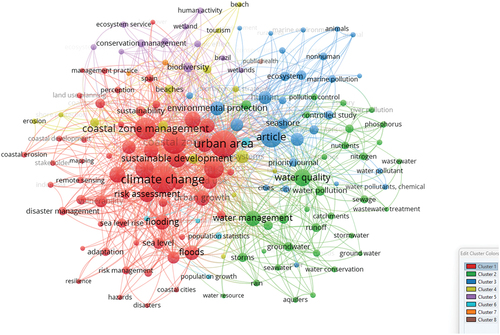
Table 1. Clustering of research categories on coastal urban management strategies.
This comprehensive literature review also conducted an observation through the density visualization analysis to investigate how the research topics have evolved between 1980 and 1990, 1991–2000, 2001–2010, and 2011–2023 ().
Figure 2. Density visualizations of keywords on coastal urban management strategies.
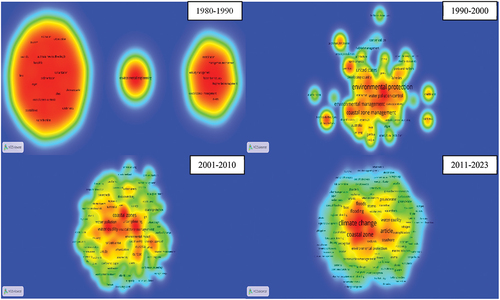
Over the period from 1980 to 2023, the literature on coastal urban management strategies has evolved significantly, reflecting the growing recognition of the complex challenges posed by urbanization and climate change in coastal regions. Initial studies in the 1980s primarily focused on conventional engineering solutions such as seawalls and breakwaters to mitigate coastal erosion and flooding. However, as the impacts of urbanization and climate change became more pronounced, scholars and practitioners shifted their attention towards integrated and sustainable approaches. From the 1990s onwards, there emerged a greater emphasis on ecosystem-based strategies, encompassing concepts like green infrastructure, wetland restoration, and natural coastal defenses. The late 20th century also witnessed a rise in participatory planning methods, incorporating local communities’ input in decision-making processes. In the 21st century, the literature expanded to include innovative solutions such as nature-based adaptation, risk assessment models, and resilient urban design, integrating both ecological and socio-economic considerations. Overall, the trajectory of literature in this field demonstrates a transition from purely engineering interventions to holistic, collaborative, and adaptive strategies that acknowledge the intricate interplay between coastal urban development and environmental sustainability.
2.2. Application of multi-criteria decision making for strategic management
The focus of this study is to examine the utilization of multi-criteria decision analysis in the strategic management of coastal urban development projects by reviewing relevant research studies. The findings of the survey illustrate the versatility of MCDM methods, as they have been applied in a diverse range of research contexts. Additionally, the study highlights the surge in popularity of these methods, garnering attention from the global research community.
The core objective of the data collection strategy is conducting a thorough search. For this study, the search was carried out using search engines such as Science Direct, SpringerLink, and Google Scholar. The search terms employed were “multi-criteria decision analysis (MCDM)”, “strategic management”, “coastal urban project”, and “sustainable development”. Boolean operators such as AND and OR were utilized to create an effective search algorithm that could retrieve all articles relevant to MCDM and applicable to programming language in relation to strategic planning for coastal urban projects. The study’s time frame covers a decade from 2012 to 2022. A data reduction procedure was then performed on each document, excluding studies that did not establish a link between MCDM methods and strategic management concerning sustainable development. Only research articles and peer-reviewed papers from international conferences were kept, and other document types such as review articles, book chapters, books, reports, and dissertations were not considered.
As is commonly understood, the strategic management process comprises several stages, such as analysing the internal and external environment of the object for strategic planning, formulating strategies, implementing them, and evaluating strategic controls. This study features analytical discussions on the utilisation of MCDM in the strategic management of coastal urban construction projects across these stages. presents the distribution of MCDM application in specific phases of the strategic management process, as reported in notable studies.
Table 2. Distribution of MCDM applications in strategic management phases.
The use of MCDM methods is highly adaptable throughout the strategic management process. During the initial stage, when analyzing and evaluating factors of the strategic planning environment, the AHP/ANP method and its hybrid variants with other techniques are widely used and have proven to be effective. In the strategy formulation stage, the Balanced Scorecard method has garnered significant attention from researchers due to its practicality. For assessment, control, and strategy selection, the TOPSIS method has been the most frequently utilized. Nonetheless, other MCDM methods have also been explored and found to be applicable in various case studies. A significant and possibly the most crucial contribution of this review is highlighting the considerable dearth in the usage of MCDM research in the strategic management of coastal urban development projects. This underscores the urgent requirement for focused and robust studies catering to this project type.
2.3. The integration of BSC, fuzzy, ANP, and DEMATEL for decision making
Previous research has employed a strategy mapping approach to aid decision-makers, as evidenced by the work of Hsu et al. (Citation2011). They utilized the Balanced Scorecard (BSC), Delphi method, Analytic Network Process (ANP), and fuzzy logic to create a sustainable framework for evaluating the sustainable strategic performance of Taiwanese semiconductor companies. Within their framework, the authors suggested 25 performance metrics grouped across four BSC dimensions. These metrics were evaluated using ANP, which considered their relative importance. Similarly, Lee et al. (Citation2011) employed DEMATEL to analyze factor interdependencies, followed by ANP for factor calculation and ranking. However, both studies did not uncover the cause-and-effect connections between performance criteria, which posed challenges for decision-makers in identifying high-priority strategic actions. In contrast, the BFAD model introduced in our study goes beyond merely offering a strategy map. It also elucidates relationships and causal links between criteria, empowering decision-makers to discern and prioritize strategic objectives more effectively.
Wu (Citation2012) employed DEMATEL to establish causal links among the key performance indicators (KPIs) within the BSC-based strategy map aimed at banking institutions. However, an essential limitation of DEMATEL, which concerns ensuring consistency in input data, was left unaddressed, thereby constraining the dependability of the outcomes it yielded. In the subsequent years, researchers such as Shafiee et al. (Citation2014), Shaik and Abdul-Kader (Citation2014), Büyüközkan and Güleryüz (Citation2016), and Costa et al. (Citation2019) have not managed to overcome this particular vulnerability of DEMATEL in the realm of strategic management. Conversely, Quezada et al. (Citation2018) and Balsara et al. (Citation2019) have brought valuable contributions to improving the reliability of DEMATEL by utilizing ANP to validate data consistency and to estimate the direct influence between factors in a matrix. Nevertheless, their focus did not extend to the logical aspect of measures within the ANP and DEMATEL matrices, an area where the effectiveness of the BSC method has been proven. When comparing the BFAD model against other strategic planning and performance management models, it becomes evident that the BFAD model holds a superior position in providing decision-makers with a lucid comprehension of the strategic activities that warrant attention. This superiority stems from its ability to uncover causal relationships between performance criteria, a facet that sets it apart.
The objective of this research is to overcome the constraints observed in prior investigations by amalgamating the BSC, Fuzzy, ANP, and DEMATEL methodologies. This approach offers various benefits, including the application of a systematic method for formulating strategic metrics through the BSC approach, maintaining data consistency through ANP, and uncovering causal connections within strategic frameworks via DEMATEL.
3. Research methodology
This section aims to introduce the research methodology employed in this study. The methodological framework should explain the research development process to demonstrate the scientific significance as well as describe in detail of technical specifications to practice the framework (Ozarisoy & Altan, Citation2022a, Citation2022b). It begins by the development process of BFAD model. Following this, the selection of strategic measures is presented. After that, a step-by-step development in detail of BFAD model analysis is explained. The case study’s geographical context is then introduced.
3.1. Development of BFAD model
The BFAD framework recommends that the strategic mapping of a project go through the following four main phases. First, the project’s guiding criteria are identified through a comprehensive literature review of strategic objectives. Then, these strategic objectives and criteria are structured according to the strategic aspects of the “Balanced Scorecard” using the BSC methodology. In the second phase, the ANP method is applied to check the consistency of the data and calculate the weights of the matrices to compare pairs of criteria. The third phase combines Fuzzy logic and ANP methods to analyze the direct relationship between criteria. The final phase is the application of DEMATEL meta-analyze the indirect relationship and the logical cause-effect relationship in the strategy map. shows the work that needs to be done according to the BFAD framework.
Figure 3. The BFAD framework.
3.2. Proposing the strategic goals and performance metrics
In this study, the BFAD framework is applied to quantitatively analyse strategic relationships that influence the success of coastal urban projects (Huynh et al., Citation2020). According to Huynh et al. (Citation2020), thirteen key performance indicators (KPIs) are classified into four strategic aspects: “Learning and Growth”, “Sustainable Development”, “Internal Processes”, and “Stakeholder Satisfaction”. To achieve success in these areas, organisations should focus on three main areas: “Human resource”, “Culture”, and “System”. The “Human resource” area covers the technical, personal, and communication skills of project staff and managers. The “System” area includes intangible resources, such as information resources, databases, and software/tools, that projects should use to achieve their goals. The “Culture” area encompasses teamwork, organizational culture, and alignment. Additionally, the “Internal Processes” aspect measures the critical deliverables of the project using five strategic metrics, including “Time”, “Quality”, “Technology”, “Resources”, and “Legal Compliance”. The “Sustainable Development” perspective uses four strategic metrics, including “Health and Safety”, “Financial Performance”, “Predictability”, and “Environment”, and to evaluate the project’s environmental impact, management objectives, public health, and safety. Finally, the “Stakeholder Satisfaction” perspective quantifies the stakeholder satisfaction, including end-users, involved in the project phases. presents the list of performance measures within strategic perspective of coastal urban projects.
Table 3. The list of performance measures within strategic perspective of coastal urban projects.
3.3. Methodological analysis of BFAD model
3.3.1. Analytical network process (ANP)
The ANP technique is utilized to establish direct relationships between strategic objectives within the BSC framework. ANP aids in evaluating the coherence of survey data through the consistency coefficient test. Additionally, ANP proves effective in integrating interconnected information across criteria.
The Analytical Network Process (ANP) extends from the Analytical Hierarchy Process (AHP), both developed by Professor Saaty (Citation2000). AHP models problems hierarchically, where nodes at each level can represent selection criteria or alternatives. AHP is commonly used to gauge the relative importance of nodes within a criterion level compared to nodes at the prior level through pairwise comparisons. Nodes are paired and compared using Saaty’s 9-level fundamental scale, ranging from 1 (equally important) to 9 (extremely important). Comparison results are input into the Comparison Matrix, and the relative weight of each node at a level concerning the given node of the previous level is extracted as the eigenvector of the matrix. In simpler terms, the equation EquationEquation 1(1)
(1) provides the relative weights of each element node at a hierarchy level
With represents comparison matrix,
signifies the weight,
enotes the maximum eigenvalue of matrix
The AHP/ANP method enables the assessment of the appropriateness of responses from individuals or groups who have completed the comparison matrix. The consistency ratio (CR) is calculated using the equation EquationEquation 2(2)
(2)
With is the matrix size,
is the random index that presented by Saaty (Citation2000)
Should the , it implies that the response outcomes uphold consistency. Evaluating consistency stands out as a pivotal aspect of this approach, as it relies on judgments from respondents. A limitation of AHP lies in its applicability, restricted to scenarios where the decision problem can be structured hierarchically. However, this limitation is circumvented by the Analytical Network Process (ANP), which allows for problems to be modeled as response networks while incorporating interdependencies into the framework.
An analytical network model is constructed with nodes grouped into clusters based on specific criteria that align with the problem’s nature. ANP, similar to AHP, employs pairwise comparisons among network nodes. Within this study, nodes signify the core strategic objectives serving as criteria for project success assessment, clusters represent the perspectives within the Balanced Scorecard (BSC) and their associations. The links connecting nodes portray causal relationships between strategic objectives.
Broadly speaking, the ANP process encompasses the subsequent stages:
Step 1: Translate the problem into a grid.
Step 2: Conduct pairwise comparisons among nodes (similar to AHP). These comparisons are carried out for all nodes within each cluster in relation to other nodes in the network. This step generates weight vectors.
Step 3: Input the weight vectors into a matrix (known as a supermatrix)
Step 4: Derive the matrix’s limit from step 3; the outcome provides the weight attributed to each node within each cluster.
3.3.2. Fuzzy theory
Fuzzy theory is applied in this study to deal with ambiguity, subjectivity in the preferences or opinions of decision makers. Fuzzy logic is known as a tool for MCDM problems because it proposes a rigorous framework for solving different types of problems and provides a practical and efficient solution to complex systems. To implement fuzzy logic, it is important to understand its principles and concepts and learn how it can be implemented in a decision-making problem. Fuzzy logic was developed in the mid-1960s by Professor Lotfi Zadeh, who realized that the nature of boolean logic is not suitable for real-world problems because it treats everything as 0 or 1. Therefore, to address this shortcoming, he explained the concept of fuzzy logic which instead of seeing everything as completely true or false, which allows for a degree of truth to be partially true or partially false at the same time.
After AHP was introduced in 1970, many fuzzifications of this method were proposed. Buckley (Citation1985) initiated the trapezoidal fuzzy numbers to represent the decision maker’s preferences and the fuzzy geometric mean method to obtain the weights from Saaty’s pairwise comparison matrix. Later, many other methods to derive fuzzy weights from fuzzy pairwise comparison matrices were introduced.
To handle the ambiguity, subjectivity in the preferences or opinions of decision makers, Saaty’s scales are dimmed. Triangular fuzzy numbers (TFNs) are commonly used. A triangular fuzzy number is a fuzzy number whose membership function is uniquely determined by a set of three significant values using the equation EquationEquation 3
(3)
(3) .
The real numbers l, m, and u will be called the lower, middle, and upper values of the triangular fuzzy number, respectively. In Buckley’s, (Citation1985), the 9-point Saaty scale was applied in the ANP method when performing pairwise comparisons. present the application of triangular fuzzy numbers on the 9-point Saaty scale used in this study. In addition, to investigate the level of impact between factors in the same cluster (cluster), this study applies the DEMATEL method based on survey data on a 5-point scale. describe the triangular fuzzy number of the 5-point scale (Acuña-Carvajal et al., Citation2019)
Table 4. Triangular fuzzy numbers of the 9-point Saaty scale (Buckley, Citation1985).
Table 5. Triangular fuzzy numbers of the 5-point DEMATEL scale (Acuña-Carvajal et al., Citation2019).
3.3.3. Combination of fuzzy and ANP methods to analyse direct relationships
The ANP model has four clusters arranged according to the four levels from bottom to top of the strategy map, as done by Kaplan and Norton, (Citation2004). Here, the bottom (level-4) cluster is about the “Learning and Growth” aspect, whereas the top (level-1) cluster is about the “Stakeholder Satisfaction” perspective. The level-3 and level-2 are about “Internal Processes” and “Sustainable Development”, respectively. This structure represents that “Stakeholders Satisfaction” is the most crucial goal of coastal urban projects.
After checking the pairwise comparison for consistency and calculating the criteria weights, the “Fuzzy logic” method was applied to convert the data from crisp numbers to fuzzy numbers and find the pairwise comparison matrices. In this study, the fuzzy weights are calculated and the weighted pairwise comparison matrices are defuzzified using the geometric mean method (Buckley, Citation1985).
Regarding to the BFAD framework, the combination process of Fuzzy and ANP to analyse the direct relationships consists of four steps as follows.
Step 1 is to summarize the triangular fuzzy numbers of the pairwise comparison matrices. In this step, the geometric fuzzy mean need to be calculated, using the equation EquationEquation 4(4)
(4) .
Step 2 is to calculate the triangular fuzzy weights of the elements in the pairwise comparison matrices.
After determining the mean of the triangular fuzzy number for each criterion, the equation EquationEquation 5(5)
(5) , equation EquationEquation 6
(6)
(6) , and equation EquationEquation 7
(7)
(7) of Buckley (Citation1985) are used to calculate the triangular fuzzy weights of the criteria in each pairwise comparison matrix.
Step 3 is to defuzzify and normalise the weights.
In this study, the defuzzification is applied using equation EquationEquation 8(8)
(8) of Buckley (Citation1985).
Next, the weights of the criteria must be normalized using equation EquationEquation 9(9)
(9)
Step 4 is to calculate the priority weighted of the overall matrix.
According to Saaty and Vargas (Citation2006), to create the weighted ANP overall matrix structured as , the unweighted ANP overall matrix () must be calculated with a critical value. The calculation of the critical value is done using the Superdecisions software. According to Saaty (Citation2000), Saaty and Vargas (Citation2006) and, the weighted overall matrix () is determined using the equation EquationEquation 10(10)
(10) .
Figure 4. The ANP network structure.
With is the priority weight of the node
in the cluster
when influencing the node
in the cluster
;
is the number of nodes in the cluster
that are directly related to the node
in the cluster
;
is the value of the node
in the cluster
in the unweighted overall matrix.
The vector of priority weight of criteria in each strategic aspect is the critical value of the overall matrix (Saaty, Citation2000; Saaty & Vargas, Citation2006). In this study, the Superdecisions software is used to calculate the limit for the overall matrix.
Step 5 is to normalise the weighted ANP overall matrix.
The weighted overall matrix is normalised by multiplying it by the coefficient calculated according to equation EquationEquation 11(11)
(11) (Quezada et al., Citation2018). shows the normalization results of the weighted ANP overall matrix.
Figure 5. The unweighted ANP overall matrix.
Within represents the direct relationship of the node
to the node
,
and
is noted for the number of criteria in the matrix.
3.3.4. Conversion of the ANP sum matrix included in the normalized numbers to the DEMATEL scale
Interpolation converts the normalised weighted ANP overall matrix into the DEMATEL scale. In result, the DEMATEL initial matrix is formed. In order to develop the strategy map, it is necessary to calculate the both direct and indirect relationships between the criteria in the overall matrix and identify where the meaningful relationships lie. The DEMATEL method has a scale from 0 to 4 (0 = no effect, 1 = low influence, 2 = moderate influence, 3 = high influence, and 4 = very high influence). The interpolation method was applied from the study of Quezada et al. (Citation2018) to convert from the scale (0–1) in the normalised weighted ANP overall matrix to the scale (0–4) of the DEMATEL method by equation EquationEquation 12(12)
(12) .
Where, is the importance (in the DEMATEL scale) of the node
in the cluster
in influencing the node
in the cluster
,
,
and
and is the largest and smallest element value in the normalized weighted ANP overall matrix.
3.3.5. Application of the Fuzzy DEMATEL method to find out the intrinsic relationship between the criteria in the same strategic aspect
This section presents the application of the DEMATEL method to develop the strategy map. In the study, triangular fuzzy numbers are combined with the DEMATEL method to determine the intrinsic relationship between the criteria of the same strategic aspect. The application process of the Fuzzy DEMATEL method to discover the intrinsic relationships includes six following steps.
Step 1: Expert survey on the degree of intrinsic effect between criteria in each strategic dimension.
Step 2: Fuzzy survey data. Application of a triangular fuzzy number with 5 points to transform the experts’ survey data on the interrelationships of criteria in the same strategic aspect.
Step 3: Summarizing the fuzzy DEMATEL results of all experts. The mean method is applied to aggregate all experts’ fuzzified DEMATEL survey data results.
Step 4: Defuzzification. In this study, defuzzification is applied using the mean method according to EquationEquation (5)(5)
(5) .
Step 5: Construction of the initial influence matrix. The initial influence matrix was constructed by combining the conversion results into a scale (0–4) of the normalised weighted ANP overall matrix () with the defuzzified DEMATEL matrices of criteria in the same strategic cluster. The initial influence matrix is presented in .
Figure 6. The weighted ANP overall matrix.
Figure 7. The normalized and weighted ANP overall matrix.
Step 6: The overall influence matrix (direct and indirect relationships). The overall influence matrix () is a matrix that shows both direct and indirect relationships. Before creating the total influence matrix, the original influence matrix must be normalised using equations EquationEquation 13(13)
(13) and EquationEquation 14
(14)
(14) (Quezada et al., Citation2018). The overall influence matrix was obtained using equation EquationEquation 15
(15)
(15) .
Figure 8. The normalized weighted ANP overall matrix in the DEMATEL scale.
Figure 9. The initial influence matrix.
Figure 10. The overall influence matrix.
Where reflect the value of the direct relationship between the criterion
and the criterion
is the initial influence matrix;
is the normalized matrix of the matrix
;
is the normalization coefficient that determined by equation EquationEq 11
(11)
(11) ;
is the identity matrix
3.3.6. Identify cause-and-effect relationships
To determine which criterion is a cause and which criterion is an effect (i.e., influenced by another criterion), the coefficients and
using equations EquationEquation 16
(16)
(16) and EquationEquation 17
(17)
(17) should be determined (Acuña-Carvajal et al., Citation2019; Fontela, 1974).
3.4. Data collection
Gathering input from decision-makers aims to assess the relative importance of the criteria outlined in . For the application of the DEMATEL method, the weight matrix, serving as the input matrix, needs to be computed. Given that data collection involves conducting personal interviews with experts, it’s imperative to have a meticulously structured and clear questionnaire in place. The questionnaire consists of four main sections, encompassing an introduction to the research objective and author details, an elucidation of the conceptual strategy maps, a description of the scale employed, and a practical example illustrating how to provide responses to the inquiries.
The questionnaire aims to assess how criteria interrelate, even when situated within the same aspect of the BSC, to achieve the BSC perspectives. The ANP technique employs a 9-point scale, akin to the AHP approach, for comparing the significance of A and B (where 1 implies both are equally important, 3 suggests A is somewhat less important than B, 5 indicates A is somewhat more important than B, 7 implies A is significantly more important than B, 9 signifies A is extremely more important than B, and 2, 4, 6, 8 represent intermediate judgments between these levels) (Saaty & Vargas, Citation2006). Meanwhile, the DEMATEL method employs a 0 to 4 scale, where 0 signifies no impact, 1 indicates relatively low impact, 2 denotes low impact, 3 signifies high impact, and 4 represents very high impact (Si et al., Citation2018)
Regarding the interview section, the questionnaire encompassed ten inquiries focused on elucidating the interrelationship of criteria, aiming to aid respondents in achieving the desired BSC perspectives. Additionally, three questions were included to probe for influences between the criteria, even when they belong to the same cluster. An illustrative survey question employed to gauge the importance of strategic criteria is as follows: “In your view, do the advancements in human resources, automation, database, system enhancements, and cultural development contribute to attaining the optimal time-related objective? If they do, kindly rate the importance of these objectives relative to the time-related goal.”
3.5. Case study
The study collected data by conducting direct interviews with 26 experts who possess extensive experience in coastal urban projects in Da Nang city, Vietnam. Da Nang city is a key urban center of Central Vietnam, with many beautiful beaches: Nam-O Beach, Man-Quang, My-Khe, Non-Nuoc… One of them was voted by Forbes magazine as one of the most beautiful beaches on the planet. Da Nang city is developing very strongly both in terms of urban space and socio-economic, but is also being strongly affected by climate change (large-scale flooding; increasing salinity; drought; drought). prolonged drought, etc.). Although the city pays great attention to urban planning and management, there are many studies to assess adaptive capacity and vulnerability to climate change, these contents are still general at the city level meet specific action requirements in response and resilience to climate change. In addition, in the dynamic economic development of the city, besides many successful projects that bring an innovative urban face to the city, there are still a few unsuccessful projects from small to large scale large tissue. For these reasons, Da Nang city has been selected as a case study to implement integrated model building in strategic planning for the success of coastal urban development projects.
summarises the critical information of these experts. An expert survey is an effective tool for complex mass evaluation. In addition, it allows researchers to investigate issues that can be difficult to study in mass surveys. In addition, expert investigations can often be done quickly and costly more widely public opinion surveys. The effect achieved the highest when each group of experts consisted of less than ten people (Maestas, Citation2018). From the information on the experts invited to comprises it is clear that the reliability of the quality of the respondents is guaranteed. The experts are individuals who hold management positions, have participated in project evaluation committees or are in the role of making investment decisions, and have many years of professional experience.
Table 6. Information of experts interviewed.
The study collected data from 26 experts. For each expert, data were entered into pairwise comparison matrix tables of the criteria of “Learning and Growth”, “Internal Processes”, “Sustainable Development”, and “Stakeholder Satisfaction” aspects.
4. Results
4.1. Identification of cause-effect relationships
Before developing the ANP overall matrix, the normalised and weighted pairwise comparison matrices according to the opinions of 26 experts are need to be aggregated. The mean method is used to perform the aggregation. According to the ANP network structure (), the results of the normalised and weighted vectors of the criteria in each pairwise comparison matrix were entered into the normalised ANP overall matrix (without assigning priority weights). describes the unweighted ANP overall matrix. Since there are 13 strategic criteria, the overall matrix is a 13 × 13 matrix.
The results of the priority weighting in the overall matrix are shown in . Since the “Stakeholder Satisfaction” aspect has only one criterion (SS – “Stakeholder Satisfaction”), there is no priority weighting of the SS criterion.
Table 7. Priority weights of the criteria.
Using equation EquationEquation 10(10)
(10) , the weighted ANP overall matrix is determined and presented in . For example, the value of element T with column F in is determined by multiplying the value of element T with column F in by the priority weight of F and multiplying by the number of nodes in cluster 3.
shows the results of determining the “Cause” and “Effect” criteria. After determining the coefficients and
of each criterion, the value
of 13 criteria shows that the criteria belonging to “Learning and Growth” and “Internal Processes” are “Cause”, and the criteria belonging to “Sustainable Development” and “Satisfaction” have the character of “Effect”. The value
describes the extent of the influence of each criterion.
Table 8. Cause-effect relationships.
4.2. Building the impact relationship map (IRM)
The Impact Relation Map (IRM) is a visual product of applying research models to propose strategies for planning the success of coastal urban projects. The IRM was designed based on the overall influence matrix, including direct and indirect relationships. Two questions need to be answered to develop the IRM: (1) How is the cause-effect relationship expressed? (2) To determine which relationships should be included in the IRM, the first question to ask is which ones are deemed significant. The second question is how to calculate the threshold value that determines the significance of a relationship. In several previous studies that are related to this matter, the mean of all the items in the overall influence matrix has been used as the threshold value (Acuña-Carvajal et al., Citation2019; Fontela and Gabus, Citation1974). For this study, a threshold value of 0.20 was used to determine which relationships are important and should be included in the IRM strategy map (). Only relationships with values above 0.20 are displayed. To plot the IRM strategy map, the relative values of the 13 criteria are presented in a scatter plot, where the horizontal axis represents the coefficient and the vertical axis is the coefficient
. The horizontal axis describes the salient importance of the criteria, i.e., the further to the right, the more important the criterion is considered to be than the others. On the vertical axis, positive values indicate “Cause” criteria, while negative values reflect “effect” criteria. In the IRM strategy map, arrows indicate the direction of influence between criteria and link the “Cause” criterion to the “effect” criterion. Note that the IRM strategy map reflects only important cause-effect relationships. The dashed arrows describe the supposedly important relationships between the “Cause” criteria or between the “effect” criteria.
Figure 11. The IRM strategy map.
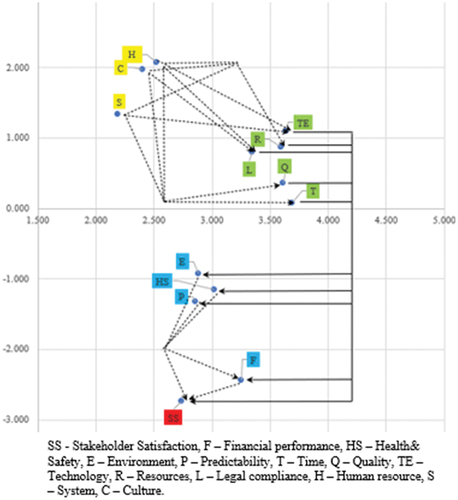
In summary, the IRM diagram in illustrates that achieving the 8 criteria within the “Learning and Growth” and “Internal Processes” perspectives can have a substantial impact on the 4 sustainability criteria in the “Sustainable Development” perspective, ultimately contributing to the objective of satisfying stakeholders. Furthermore, the IRM highlights the interrelationships between these 8 “Cause” objectives and the 5 “Effect” criteria.
Overall, the “Internal Processes” perspective includes five causes, namely “Time”, “Quality”, “Technology”, “Resources”, and “Legal Compliance”, which are impacted by three factors from the “Learning and Growth” perspective, which are “Human Resource”, “Culture” (referring to organizational culture), and “System”. Specifically, all 3 causes, “Human resource”, “Culture”, and “System”, were found to have strong effects on “Time”, “Quality”, and “Resources”. The remaining dashed arrows in the upper part of show that “Human resource” and “System” have a significant impact on “Technology”, while “Legal compliance” is strongly influenced by 2 causes, “Human resource” and “Culture”. The IRM strategy map reveals the connections between the 5 “Effect” criteria, with the lower part displaying dashed arrows indicating the importance of meeting the 4 “Sustainable Development” criteria, namely “Financial performance,” “Health & Safety,” “Environment,” and “Predictability,” in enhancing stakeholder satisfaction.
5. Discussions
5.1. The prominence of performance criteria
Several insights can be derived from these observations. Therefore, to enhance the legal operational efficiency of coastal projects, emphasis should be placed on improving the performance of human resource and organizational culture-related criteria (such as human resource training, creating and monitoring organizational culture). Moreover, for improving the performance of technology in the project, greater investment is required in human resources and IT systems/automation.
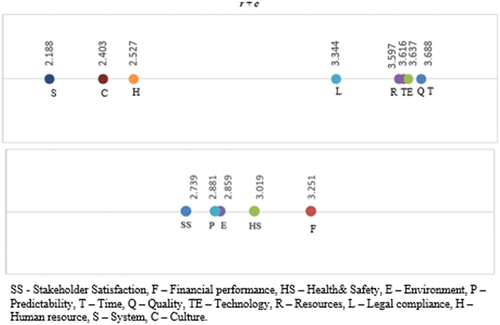
Apart from the aforementioned insights on the direction of influence of performance indicators, the IRM also highlights the significance of the relationships (reflected by the values on the x-axis) between the “Cause” and “Effect” measures. Accordingly, “Financial performance” is the most important, followed by “Health & Safety”, “Environment”, “Predictability” and “Stakeholder Satisfaction”. According to , even though “Stakeholder Satisfaction” is not the top priority criterion, it is influenced by a majority of the other criteria, implying that it can be regarded as the most significant outcome. Among the causes, the 5 causes linked to “Internal Processes” are more prominent than the 3 causes from “Learning and Growth”. Notably, in coastal urban projects, “Time” is considered the most crucial factor requiring attention, followed by “Quality”, “Technology”, “Resources”, and “Legal compliance”, all of which stem from the “Internal Processes” aspect.
Figure 12. The prominence of performance measures.
5.2. Analysis of strategic relationships of coastal urban projects
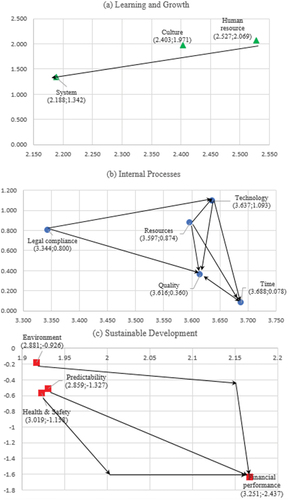
To provide a more extensive analysis, presents a detailed perspective of the relationships within each BSC perspective. In (a), (b), and (c) sections of , the interplay between the criteria in “Learning and Growth,” “Internal Processes,” and “Sustainable Development” is illustrated. This study highlights the substantial impact of the “Human resource” criterion on the “System” criterion through the arrow connecting “H” and “S” in section (a) of . Additionally, “Human resource,” with the most notable value on the X-axis among the three causes of “Learning and Growth,” is considered the most significant or primary cause for the advancement of coastal urban projects. On the other hand, the arrows in part (b) of indicate exciting interactions among the “Internal Process” perspective. For example, not only is “Time” influenced by all 4 remaining “Internal Process” factors, but it is also that “Time” influences the achievement of projects’ “Quality”. This observation is in complete agreement with previous conclusions in the term of project management. The part (c) of provides a depiction of the connections among the four sustainability dimensions. Despite having the highest value on the x-axis, “Financial performance” remains the primary focus for the sustainable development of coastal urban projects. However, the direction of the arrow indicates that “Financial performance” can only be attained if the criteria “Environment,” “Health & Safety,” and “Predictability” are fulfilled.
Figure 13. Impact relationship in each strategic dimension.
5.3. Managerial implications of BFAD model
This study introduces a performance management framework aimed at assisting organizations to invest in coastal urban projects while facing the growing impacts of climate change. The framework includes key project management indicators and sustainability considerations that are incorporated into a strategic map structured by the BSC methodology. This approach covers the learning and growth, internal processes, sustainable development, and stakeholder satisfaction perspectives. Furthermore, this study highlights the importance of learning and growth as the foundation for business progress through the use of case studies. Operational processes are driven by internal control over project time, technology, quality, legal compliance, resources, and related factors. Effective and flexible management of financial, social, and environmental activities is necessary to ensure success with high predictability, while also meeting environmental, health, and safety requirements. Overall, the strategy map produced by the BFAD framework helps decision makers identify the most important strategic goals for achieving better performance targets, which organizational factors are essential for growth and development, and how to achieve stakeholder satisfaction.
The strategy map proposed in this study has important management implications, serving as a decision support system for coastal urban projects to make strategic decisions, carry out strategic activities, and monitor organizational activities in project management. It is essential to quantify and evaluate the strategic objectives/performance measures after each operational cycle, whether it is a month, quarter, or year, to determine the leading and lagging indicators. Choosing the right leading and lagging indicators is critical in assessing and monitoring the status of project goals, as it helps managers make informed decisions for better project performance improvement. Monthly strategy meetings can also benefit from this strategy framework by determining the value of strategic goals for developing project scorecards.
Overall, the study has yielded significant and insightful findings that can inform the management of coastal urban projects. Firstly, investing in learning and development is crucial for achieving business growth and development in the context of urban coastal projects. Secondly, internal control of project time, technology, quality, legal compliance, resources, and other related factors drives operational processes. Thirdly, effective and flexible management of financial, social, and environmental activities is essential for ensuring the success of the enterprise, while meeting requirements related to environment, health, and safety. Fourthly, the strategy map proposed by the integrated model in this study is a valuable tool that can guide strategic actions and monitor project management processes in coastal areas. Fifthly, it is recommended that strategic objectives and performance measures be quantified and evaluated after each operating cycle (month, quarter, year) to identify leading and declining areas and enable corrective actions to improve project performance. Lastly, the study suggests that the proposed strategic framework can be used during monthly strategy meetings to score strategic objectives and develop project scorecards.
6. Conclusions
The model introduced in this study seeks to address two critical aspects that have remained insufficiently tackled in previous research endeavors. Firstly, it aims to bridge the gap between sustainable development objectives and the conventional goals of efficient project management for urban projects situated in coastal regions. Secondly, it aims to rectify the limitations of existing tools that offer primarily qualitative and generic suggestions for managing coastal projects, lacking precise quantification at the project level as well as a coherent link between technical requisites for coastal areas and sustainable development aims.
The BFAD model, as outlined in this study, integrates principles of sustainable development, organizational considerations, and internal metrics to facilitate the effective management of projects within coastal cities. A distinctive attribute of this model is its capacity to elucidate the cause-and-effect connections among performance criteria. This advantage equips decision-makers with an enhanced comprehension of which strategic activities demand prioritization.
This study introduces a quantitative methodology that combines the BSC, Fuzzy, ANP, and DEMATEL techniques to create impact relationship diagrams tailored to coastal projects. Within this framework, the ANP methodology is employed to ascertain direct associations among strategic objectives framed from the BSC perspective. The ANP approach not only evaluates the consistency of survey data but also seamlessly incorporates interconnected information between these objectives. Additionally, the application of the DEMATEL method assists in the identification of both direct and indirect relationships, quantifying the mutual influence of strategic objectives. The quantification of these relationships emerges as a potent tool that empowers project managers and decision-makers to pinpoint areas demanding heightened attention for the enhancement of project performance and the successful realization of strategic objectives.
The research pinpointed eight criteria originating from the “Learning and Growth” as well as “Internal Processes” perspectives, exerting significant influence on the four sustainability criteria rooted in the “Sustainable Development” perspective. This, in turn, cascades into an impact on the overarching objective of “Stakeholder Satisfaction.” Moreover, the factors “Human resources,” “Culture,” and “System” exhibited noteworthy impacts on “Time,” “Quality,” and “Resources,” while the influence of “Human resource” and “System” particularly resonated with “Technology.” Notably, the study unearthed a strong interdependence between “Legal compliance” and two factors, namely “Human resource” and “Culture.”
Hence, the study’s recommendations are twofold: For an enhanced project performance in terms of legal compliance, coastal urban projects should channel their efforts toward refining aspects related to human resources and culture. This includes areas such as human resources, training, fostering an organizational culture, and diligent monitoring. Moreover, to elevate technical performance, a heightened emphasis on the role of human resources and the extent of automation within the IT system is advised.
6.1. Limitations
The proposed BFAD model introduced in this study presents several distinct advantages when juxtaposed with other existing models used for strategic planning and performance management. A comprehensive comparison highlights these benefits. Nonetheless, two potential limitations warrant consideration: Firstly, the approach employed within this study presents a notable drawback in terms of time-intensiveness, particularly in cases where ANP is incorporated. The process entails a substantial number of pairwise comparisons, which can consume a significant amount of time. Furthermore, akin to various empirical studies, the precision of outcomes hinges heavily upon the accuracy of the response data gathered from participants. Although the survey itself might introduce data inconsistencies, such discrepancies are effectively assessed through the ANP methodology. The data validation process also compels managers to engage in reflective discussions, thereby cultivating a deeper comprehension of strategic intricacies and fostering improvements in project implementation. Embracing the entirety of this study’s process can not only foster improved communication among project stakeholders but also enhance the realization of long-term developmental objectives. Secondly, the challenge of relying on human resource assessment data emerges as a potential concern. Addressing this issue could potentially involve modern techniques such as machine learning, which have the capacity to enhance data reliability and mitigate this particular concern
6.2. Recommendation and future work
While this study has contributed valuable insights, several limitations remain that can guide future research endeavors aimed at enhancing the precision and scope of research findings. Firstly, a comprehensive sensitivity analysis should be undertaken to quantify the impact of various research inputs, including survey data and the number of participating experts, on the eventual research outcomes. Such an analysis would provide a deeper understanding of the robustness of the findings and the potential variability stemming from different inputs. To bolster the model’s credibility, a comparative study that juxtaposes the results of this study against outcomes derived from other methodologies, including traditional ones like AHP, fuzzy AHP, and DEMATEL/Gray-DEMATEL, is imperative. Such a study would shed light on the model’s strengths and potential areas for further refinement. Moreover, extending beyond comparative validation, a study that aligns the model’s results with real-world application outcomes can enhance its practical utility. This empirical alignment would not only aid in refining the model but also increase its effectiveness in practical contexts. It’s also noteworthy that certain fuzzy weight values exhibit significant discrepancies, leading to imprecision in defuzzification. Hence, a promising avenue for future research involves devising strategies to mitigate and address these discrepancies, thereby enhancing the overall accuracy and reliability of the model’s outcomes. Addressing these limitations will contribute to advancing the field and fortifying the practical relevance of the research findings.
Abbreviations
| AHP | = | Analytic Hierarchy Process |
| ANP | = | Analytic Network Process |
| BSC | = | Balanced Scorecard |
| C | = | Culture |
| DEMATEL | = | Decision Making Trial and Evaluation Laboratory |
| E | = | Environment |
| F | = | Financial performance |
| H | = | Human resource |
| HS | = | Health & Safety |
| IRM | = | Impact Relation Map |
| KPI | = | Key Performance Indicator |
| L | = | Legal compliance |
| MCDM | = | Multi-Criteria Decision Method |
| P | = | Predictability |
| Q | = | Quality |
| R – Resources | = | |
| S | = | System |
| SS | = | Stakeholder Satisfaction |
| T | = | Time |
| TE | = | Technology |
CRedi’T authorship contribution statement
Truc Thi-Minh Huynh: Conceptualization, Methodology, Visualization, Formal analysis, Writing – original draft, Writing – review and editing, Funding acquisition. Long Le-Hoai: Investigation, Data curation, Resources/software, Validation. Anh-Duc Pham: Conceptualization, Methodology, Formal analysis, Writing – review and editing, Supervision.
Acknowledgements
This research is funded by Funds for Science and Technology Development of the University of Danang under project number B2019-DN02-65.
Disclosure statement
No potential conflict of interest was reported by the author(s).
Additional information
Funding
Notes on contributors
Truc Thi-Minh Huynh
Dr. Truc Thi Minh Huynh is a lecturer in Faculty of Project Management, The University of Danang - University of Science and Techonology, Danang City, Vietnam. Her research interest focuses on performance management, business and strategy management, and sustainable development in construction industry.
Long Le-Hoai
Dr. Long Le-Hoai is Vice-Dean of Faculty of Civil Engineering, Ho Chi Minh University of Technology (HCMUT), Vietnam National University - Ho Chi Minh City, Vietnam. His research interest currently emphasizes on construction project management and the adoption of construction project in the context of climate change.
Anh-Duc Pham
Dr. Anh-Duc Pham is an associate professor and the Dean of Faculty of Project Management, The University of Danang - University of Science and Techonology, Danang City, Vietnam. His main research focuses on applications of Artificial Intelligence & Machine Learning in Construction Engineering and Management, IT related to Data Analytics & Intelligence, Professional Skills & Project Management, Financial Analysis, and sustainable development in the construction industry.
References
- Acuña-Carvajal, F., L. Pinto-Tarazona, H. López-Ospina, R. Barros-Castro, L. Quezada, and K. Palacio. 2019. “An Integrated Method to Plan, Structure and Validate a Business Strategy Using Fuzzy DEMATEL and the Balanced Scorecard.” Expert Systems with Applications 122:351–368. https://doi.org/10.1016/j.eswa.2019.01.030.
- Alizadeh, R., L. Soltanisehat, P. D. Lund, and H. Zamanisabzi. 2020. “Improving Renewable Energy Policy Planning and Decision-Making Through a Hybrid MCDM Method.” Energy Policy 137:111174. https://doi.org/10.1016/j.enpol.2019.111174.
- Arsic, S., D. Nikolic, and Ž. Živković. 2017. “Hybrid SWOT - ANP - FANP Model for Prioritization Strategies of Sustainable Development of Ecotourism in National Park Djerdap, Serbia.” Forest Policy and Economics 80:11–26. https://doi.org/10.1016/j.forpol.2017.02.003.
- Balkovskaya, D., and L. Filneva. 2016. “The Use of the Balanced Scorecard in Bank Strategic Management.” International Journal of Business Excellence 9 (1): 48–67. https://doi.org/10.1504/IJBEX.2016.073375.
- Balsara, S., P. K. Jain, and A. Ramesh. 2019. “An Integrated Approach Using AHP and DEMATEL for Evaluating Climate Change Mitigation Strategies of the Indian Cement Manufacturing Industry.” Environmental Pollution 252:863–878. https://doi.org/10.1016/j.envpol.2019.05.059.
- Block, T., and E. Paredis. 2013. “Urban Development Projects Catalyst for Sustainable Transformations: The Need for Entrepreneurial Political Leadership.” Journal of Cleaner Production 50:181–188. https://doi.org/10.1016/j.jclepro.2012.11.021.
- Buckley, J. J. 1985. “Fuzzy Hierarchical Analysis.” Fuzzy Sets and Systems 17 (3): 233–247. https://doi.org/10.1016/0165-0114(85)90090-9.
- Büyüközkan, G., and S. Güleryüz. 2016. “An Integrated DEMATEL-ANP Approach for Renewable Energy Resources Selection in Turkey.” International Journal of Production Economics 182:435–448. https://doi.org/10.1016/j.ijpe.2016.09.015.
- Cantele, S., and A. Zardini. 2018. “Is Sustainability a Competitive Advantage for Small Businesses? An Empirical Analysis of Possible Mediators in the Sustainability–Financial Performance Relationship.” Journal of Cleaner Production 182:166–176. https://doi.org/10.1016/j.jclepro.2018.02.016.
- Castro, A., G. Pacheco, and J. Neila. 2020. “Holistic Approach to the Sustainable Commercial Property Business: Analysis of the Main Existing Sustainability Certifications.” International Journal of Strategic Property Management 24:1–18. https://doi.org/10.3846/ijspm.2020.12174.
- Chen, Z., D. Chen, M. P. Kwan, B. Chen, B. Gao, Y. Zhuang, R. Li, and B. Xu. 2019. “The Control of Anthropogenic Emissions Contributed to 80 % of the Decrease in PM2.5 Concentrations in Beijing from 2013 to 2017.” Atmospheric Chemistry & Physics 19 (21): 13519–13533. https://doi.org/10.5194/acp-19-13519-2019.
- Costa, F., L. Lispi, A. P. Staudacher, M. Rossini, K. Kundu, and F. D. Cifone. 2019. “How to Foster Sustainable Continuous Improvement: A Cause-Effect Relations Map of Lean Soft Practices.” Operations Research Perspectives 6:100091. https://doi.org/10.1016/j.orp.2018.100091.
- Duraiappah, A. K., C. Scherkenbach, X. Bai, C. Griffith, H. Kremer, A. Lampis, D. McEvoy, et al. 2015. Coastal Zones and Urbanization: Summary for Decision-Makers. UN University – International Human Dimensions Programme (UNUIHDP), Issue.
- Dushenko, M., C. Bjorbaek, and K. Steger-Jensen. 2018. “Application of a Sustainability Model for Assessing the Relocation of a Container Terminal: A Case Study of Kristiansand Port.” Sustainability 11 (1): 87. https://doi.org/10.3390/su11010087.
- Erdil, A., and H. Erbıyık. 2015. “Selection Strategy via Analytic Hierarchy Process: An Application for a Small Enterprise in Milk Sector.” Procedia - Social & Behavioral Sciences 195:2618–2628. https://doi.org/10.1016/j.sbspro.2015.06.463.
- Fontela, E., and A. Gabus. 1974. DEMATEL: Innovative Methods. Battelle Geneva Research Institute.
- Garcia, M. 2008. “Framing Strategic Urban Projects: Learning from Current Experiences in European Urban Regions, Salet, W. and Gualini.” International Journal of Urban and Regional Research 32 (3): 751–753. https://doi.org/10.4324/9780203966129.
- García-Melón, M., R. Poveda-Bautista, M. Del Valle, and J. L. 2015. “Using the Strategic Relative Alignment Index for the Selection of Portfolio Projects Application to a Public Venezuelan Power Corporation.” International Journal of Production Economics 170:54–66. https://doi.org/10.1016/j.ijpe.2015.08.023.
- Ghasemzadeh, F., M. Pishdar, and J. Antucheviciene. 2017. “Prioritization of Petroleum Supply chains’ Disruption Management Strategies Using Combined Framework of BSC Approach, Fuzzy AHP and Fuzzy Choquet Integral Operator.” Journal of Business Economics and Management 18 (5): 897–919. https://doi.org/10.3846/16111699.2017.1380075.
- Ghavami, S. M. 2020. “A Web Service Based Advanced Traveller Information System for Itinerary Planning in an Uncertain Multimodal Network.” Geocarto International 35 (14): 1553–1569. https://doi.org/10.1080/10106049.2019.1583773.
- Ghavami, S. M., J. Maleki, and T. Arentze. 2019. “A Multi-Agent Assisted Approach for Spatial Group Decision Support Systems: A Case Study of Disaster Management Practice.” International Journal of Disaster Risk Reduction 38:101223. https://doi.org/10.1016/j.ijdrr.2019.101223.
- Gianni, M., K. Gotzamani, and G. Tsiotras. 2017. “Multiple Perspectives on Integrated Management Systems and Corporate Sustainability Performance.” Journal of Cleaner Production 168:1297–1311. https://doi.org/10.1016/j.jclepro.2017.09.061.
- Gigović, L., D. Pamučar, D. Lukić, and S. Marković. 2016. “GIS-Fuzzy DEMATEL MCDA Model for the Evaluation of the Sites for Ecotourism Development: A Case Study of “Dunavski ključ” Region, Serbia.” Land Use Policy 58:348–365. https://doi.org/10.1016/j.landusepol.2016.07.030.
- Grošelj, P., and L. Zadnik Stirn. 2015. “The Environmental Management Problem of Pohorje, Slovenia: A New Group Approach within ANP - SWOT Framework.” Journal of Environmental Management 161:106–112. https://doi.org/10.1016/j.jenvman.2015.06.038.
- Harmain, G., and S. Parvez. 2018. Building Taxonomy for Obtaining Strategic Partnerships with Original Equipment Manufacturers of a Firm.
- Henríquez-Antipa, L. A., and F. Cárcamo. 2019. “Stakeholder’s Multidimensional Perceptions on Policy Implementation Gaps Regarding the Current Status of Chilean Small-Scale Seaweed Aquaculture.” Marine Policy 103:138–147. https://doi.org/10.1016/j.marpol.2019.02.042.
- Hosseini Nasab, H., and A. S. Milani. 2012. “An Improvement of Quantitative Strategic Planning Matrix Using Multiple Criteria Decision Making and Fuzzy Numbers.” Applied Soft Computing 12 (8): 2246–2253. https://doi.org/10.1016/j.asoc.2012.03.010.
- Hsu, C.-W., A. H. Hu, C.-Y. Chiou, and T.-C. Chen. 2011. “Using the FDM and ANP to Construct a Sustainability Balanced Scorecard for the Semiconductor Industry.” Expert Systems with Applications 38 (10): 12891–12899. https://doi.org/10.1016/j.eswa.2011.04.082.
- Huynh, T. T.-M., C. N. Dang, L. Le-Hoai, A.-D. Pham, and T. D. Nguyen. 2020. “Proposing a Strategy Map for Coastal Urban Project Success Using the Balanced Scorecard Method.” Engineering, Construction & Architectural Management 27 (10): 2993–3030. https://doi.org/10.1108/ECAM-11-2018-0527.
- Kaplan, R. S., and D. P. Norton. 2004. Strategy Maps: Converting Intangible Assets into Tangible Outcomes. Boston, MA: Harvard Business School Press.
- Khalili, N., and S. Duecker. 2013. “Application of Multi-Criteria Decision Analysis in Design of Sustainable Environmental Management System Framework.” Journal of Cleaner Production 47:188–198. https://doi.org/10.1016/j.jclepro.2012.10.044.
- Kim, H. Y., and J. H. Hwang. 2018. “Combining GIS with AHP for Facility Site Selection: A Case Study in Cheongju, South Korea.” Journal of Engineering and Applied Sciences 13:7933–7939. https://doi.org/10.3923/jeasci.2018.7933.7939.
- Labuschagne, C., A. C. Brent, and R. P. G. van Erck. 2005. “Assessing the Sustainability Performances of Industries.” Journal of Cleaner Production 13 (4): 373–385. https://doi.org/10.1016/j.jclepro.2003.10.007.
- Lee, W.-S., A. Y. Huang, Y.-Y. Chang, and C.-M. Cheng. 2011. “Analysis of Decision Making Factors for Equity Investment by DEMATEL and Analytic Network Process.” Expert Systems with Applications 38 (7): 8375–8383. https://doi.org/10.1016/j.eswa.2011.01.027.
- Maestas, C. 2018. “583Expert Surveys as a Measurement Tool: Challenges and New Frontiers.” In The Oxford Handbook of Polling and Survey Methods, edited by L. R. Atkeson and R. M. Alvarez, 0. Oxford University Press. https://doi.org/10.1093/oxfordhb/9780190213299.013.13.
- Mani Murali, R., M. Ankita, and P. Vethamony. 2018. “A New Insight to Vulnerability of Central Odisha Coast, India Using Analytical Hierarchical Process (AHP) Based Approach.” Journal of Coastal Conservation 22 (4): 799–819. https://doi.org/10.1007/s11852-018-0610-4.
- Marshall, R. 2004. Waterfronts in Post-Industrial Cities.
- Mukeshimana, M. C., Z.-Y. Zhao, and J. P. Nshimiyimana. 2021. “Evaluating Strategies for Renewable Energy Development in Rwanda: An Integrated SWOT – ISM Analysis.” Renewable Energy 176:402–414. https://doi.org/10.1016/j.renene.2021.05.104.
- Nawaz, W., and M. Koç. 2018. “Development of a Systematic Framework for Sustainability Management of Organizations.” Journal of Cleaner Production 171:1255–1274. https://doi.org/10.1016/j.jclepro.2017.10.011.
- Ozarisoy, B., and H. Altan. 2022a. “Bridging the Energy Performance Gap of Social Housing Stock in South-Eastern Mediterranean Europe: Climate Change and Mitigation.” Energy and Buildings 258:111687. https://doi.org/10.1016/j.enbuild.2021.111687.
- Ozarisoy, B., and H. Altan. 2022b. “Significance of Occupancy Patterns and Habitual Household Adaptive Behaviour on Home-Energy Performance of Post-War Social-Housing Estate in the South-Eastern Mediterranean Climate: Energy Policy Design.” Energy 244:122904. https://doi.org/10.1016/j.energy.2021.122904.
- Padash, A., and A. R. Ghatari. 2020. “Toward an Innovative Green Strategic Formulation Methodology: Empowerment of Corporate Social, Health, Safety and Environment.” Journal of Cleaner Production 261:121075. https://doi.org/10.1016/j.jclepro.2020.121075.
- Pourebrahim, S., and S. Amoushahi. 2017. “Land Quality Management for Ecotourism Development; Case of Mahallat District.” Annual Research & Review in Biology 16 (1): 1–11. https://doi.org/10.9734/ARRB/2017/35229.
- Quezada, L. E., H. A. López-Ospina, P. I. Palominos, and A. M. Oddershede. 2018. “Identifying Causal Relationships in Strategy Maps Using ANP and DEMATEL.” Computers & Industrial Engineering 118:170–179. https://doi.org/10.1016/j.cie.2018.02.020.
- Rahimnia, F., and N. Kargozar. 2016. “Objectives Priority in University Strategy Map for Resource Allocation.” Benchmarking: An International Journal 23 (2): 371–387. https://doi.org/10.1108/BIJ-09-2013-0094.
- Randall, M., J. Montgomery, and A. Lewis. 2022. “Robust Temporal Optimisation for a Crop Planning Problem Under Climate Change Uncertainty.” Operations Research Perspectives 9:100219. https://doi.org/10.1016/j.orp.2021.100219.
- Saaty, T. L. 2000. Fundamentals of Decision Making and Priority Theory with AHP.
- Saaty, T. L., and L. G. Vargas. 2006. Decision Making with Analytic Network Process: Economic, Political, Social and Technological Applications with Benefits, Opportunities, Costs, and Risks. Springer.
- Scholten, L., N. Schuwirth, P. Reichert, and J. Lienert. 2015. “Tackling Uncertainty in Multi-Criteria Decision Analysis – an Application to Water Supply Infrastructure Planning.” European Journal of Operational Research 242 (1): 243–260. https://doi.org/10.1016/j.ejor.2014.09.044.
- Şevkli, M., A. Oztekin, Ö. Uysal, N. G. Torlak, A. Turkyilmaz, and D. Delen. 2012. “Development of a Fuzzy ANP Based SWOT Analysis for the Airline Industry in Turkey.” Expert Systems with Applications 39:14–24. https://doi.org/10.1016/j.eswa.2011.06.047.
- Shafiee, M., F. Hosseinzadeh Lotfi, and H. Saleh. 2014. “Supply Chain Performance Evaluation with Data Envelopment Analysis and Balanced Scorecard Approach.” Applied Mathematical Modelling 38 (21): 5092–5112. https://doi.org/10.1016/j.apm.2014.03.023.
- Shahba, S., R. Arjmandi, M. Monavari, and J. Ghodusi. 2017. “Application of Multi-Attribute Decision-Making Methods in SWOT Analysis of Mine Waste Management (Case Study: Sirjan’s Golgohar Iron Mine, Iran).” Resources Policy 51:67–76. https://doi.org/10.1016/j.resourpol.2016.11.002.
- Shaik, M. N., and W. Abdul-Kader. 2014. “Comprehensive Performance Measurement and Causal-Effect Decision Making Model for Reverse Logistics Enterprise.” Computers & Industrial Engineering 68:87–103. https://doi.org/10.1016/j.cie.2013.12.008.
- Singh, R. K., H. R. Murty, S. K. Gupta, and A. K. Dikshit. 2012. “An Overview of Sustainability Assessment Methodologies.” Ecological Indicators 15 (1): 281–299. https://doi.org/10.1016/j.ecolind.2011.01.007.
- Si, S.-L., X.-Y. You, H.-C. Liu, and P. Zhang. 2018. “DEMATEL Technique: A Systematic Review of the State-Of-The-Art Literature on Methodologies and Applications.” Mathematical Problems in Engineering 2018:3696457. https://doi.org/10.1155/2018/3696457.
- Tan, W.-K., and C.-Y. Kuo. 2014. “Prioritization of Facilitation Strategies of Park and Recreation Agencies Through DEMATEL Analysis.” Asia Pacific Journal of Tourism Research 19 (8): 859–875. https://doi.org/10.1080/10941665.2013.812570.
- Verdecho, M.-J., F. Alarcón, D. Pérez Perales, J. Alfaro, and R. Rodríguez-Rodríguez. 2021. “A Methodology to Select Suppliers to Increase Sustainability within Supply Chains.” Central European Journal of Operations Research 29 (4): 1231–1251. https://doi.org/10.1007/s10100-019-00668-3.
- Wheelen, H. 2012. Strategic Management and Business Policy: Toward Global Sustainability. Pearson Education, Inc. https://doi.org/10.1016/j.eswa.2019.01.030.
- Wu, H.-Y. 2012. “Constructing a Strategy Map for Banking Institutions with Key Performance Indicators of the Balanced Scorecard.” Evaluation and Program Planning 35 (3): 303–320. https://doi.org/10.1016/j.evalprogplan.2011.11.009.
- Yavuz, F., and T. Baycan. 2014. “Application of Combined Analytic Hierarchy Process (AHP) and SWOT for Integrated Watershed Management.” International Journal of the Analytic Hierarchy Process 6 (1). https://doi.org/10.13033/ijahp.v6i1.194.
- Yazdani Chamzini, A., S. Shariati, S. Haji Yakhchali, and E. Zavadskas. 2014. “Proposing a New Methodology for Prioritising the Investment Strategies in the Private Sector of Iran.” Economic Research-Ekonomska Istraživanja 27 (1): 320–345. https://doi.org/10.1080/1331677X.2014.947150.
- Zavadskas, E. K., Z. Turskis, and V. Bagočius. 2015. “Multi-Criteria Selection of a Deep-Water Port in the Eastern Baltic Sea.” Applied Soft Computing 26:180–192. https://doi.org/10.1016/j.asoc.2014.09.019.