
 ?Mathematical formulae have been encoded as MathML and are displayed in this HTML version using MathJax in order to improve their display. Uncheck the box to turn MathJax off. This feature requires Javascript. Click on a formula to zoom.
ABSTRACT
Previous research has shown that elected officials are more responsive to the opinions of high-income citizens than to those of middle and working-class citizens in the United States. This is often explained by the fact that economic elites make campaign contributions to political elites, leading to decision-making that aligns with the preferences of the affluent. This paper examines the opinion-policy link in Swedish politics, where campaign contributions are relatively low. Despite this, the study finds that high-income citizens still receive the most policy responsiveness. Three alternative possible explanations are discussed. Do high-income citizens receive more responsiveness because (a) they are better able to put issues on the political agenda, (b) because they are easier to satisfy and prefer ‘cheaper’ symbolic policy reforms, while low-income citizens prefer more costly policies or (c) because the status quo bias works to the advantage of high-income citizens?
Several studies have shown that elected officials appear to be more responsive to wealthy citizens than to middle- and low-income citizens (Bartels, Citation2009; Elsässer et al., Citation2020; Gilens, Citation2005, Citation2012; Gilens & Page, Citation2014; Lupu & Warner, Citation2022a; Schakel et al., Citation2020), i.e., policies supported by the wealthy are more common than policies supported by the poor. However, we know little about the mechanisms driving this relationship. Gilens (Citation2005, Citation2012) speculates that unequal responsiveness in the United States may have its roots in economic inequality. High-income citizens make large campaign contributions, while low-income citizens have fewer connections to elected officials. According to this argument, large economic transactions between wealthy citizens and the political elite could create a bond that leads politicians to make decisions that are in line with the opinions of the affluent.
This paper examines the relationship between citizens' opinions and policy outcomes in Swedish politics. Sweden and the United States share many similarities as postindustrial Western democracies, but they differ significantly when it comes to inequality and political donations. While inequality has risen in many Western countries, it remains much lower in Sweden, and donations to political parties are much smaller in comparison. If unequal political responsiveness is a result of economic inequality, then we would expect to see greater equality in responsiveness in the Swedish context. This study aims to investigate whether this is the case.
The first part of the study shows that responsiveness is more strongly connected with the preferences of high-income citizens than low-income citizens, also in Sweden. Although it is not possible to directly compare the extent of inequality in responsiveness across countries, even the more egalitarian Swedish system is not free of unequal responsiveness. Thus, the study complements recent comparative studies that find income related responsiveness in terms of government spending (Peters & Ensink, Citation2015) and ideological congruence (Bernauer et al., Citation2015; Giger et al., Citation2012; Lupu & Warner, Citation2022a, Citation2022b; Rosset et al., Citation2013; Schakel & Hakhverdian, Citation2018). Moreover, single-country studies from the Netherlands (Schakel, Citation2021), Norway (Mathisen, Citation2022), Germany (Elsässer et al., Citation2020) and Spain (Lupu & Tirado Castro, Citation2022) show that responsiveness to the preferences of high-income citizens is also biased in Europe.
The second part of the paper focuses on three possible explanations for why unequal responsiveness is observed in the Swedish case. First, is responsiveness related to the importance of the issues? Do high-income citizens get what they want to a greater extent because they are better able to put their preferred policies on the political agenda? Second, do low-income citizens prefer more costly policies than high-income citizens? Is the reason for unequal responsiveness that high-income citizens prefer policies that are easier to implement? Third, do high-income citizens receive more support because the status quo is to their advantage?Footnote1
The remainder of the paper will proceed as follows. The next sections will describe the state of the research field and the study design. I will then present the results regarding the overall responsiveness of the system and responsiveness for different income groups. I will then assess the evidence for the three possible explanations ‘agenda setting’, ‘costly policies’, and ‘status quo bias’. The paper ends with a summary of the conclusions and a discussion of the implications of the findings.
The state of the research field
The classical approach to the study of responsiveness examines the relationship between the opinions of citizens and the opinions of their elected representatives or their legislative behavior (Achen, Citation1977; Holmberg, Citation1997; Miller & Stokes, Citation1963). The collective message of these studies is that, at least in the United States, there is a relatively strong relationship between general public opinion and the opinions and behavior of legislators. An alternative approach is to track changes in public opinion and changes in public policy (Erikson et al., Citation2002; Monroe, Citation1979, Citation1998; Page & Shapiro, Citation1983; Soroka & Wlezien, Citation2010; Stimson et al., Citation1995). These studies have shown that while there is a relatively strong bias toward the status quo, policy outcomes and majority preferences often coincide. Comparative studies from Europe largely confirm that government is at least reasonably responsive to the public (Binzer Hobolt & Klemmemsen, Citation2005; Binzer Hobolt & Klemmensen, Citation2008; Hakhverdian, Citation2010; Rasmussen et al., Citation2019). Other studies have shown both that opinions influence policy and that public opinion is responsive to policy changes (Soroka & Wlezien, Citation2005, Citation2010; Wlezien, Citation1995; Wlezien & Soroka, Citation2007). The parallel literature on welfare states argues that public opinion plays a central role in explaining the persistence of welfare states (Brooks & Manza, Citation2006, Citation2008).
The aforementioned studies focus on responsiveness across the entire citizenry.Footnote2 What is interesting, however, is whether a policy is responsive to the opinions of citizens of particular socioeconomic status. A comparison of citizen opinions and data on the voting behavior of U.S. senators votes, Bartels (Citation2009) shows that elected officials are more responsive to high-income citizens.Footnote3 And in several studies, Gilens (Citation2005, Citation2012) and Gilens and Page (Citation2014) show that while the overall relationship between public opinion and policy is ‘moderately strong’ policy has a particularly close relationship with the preferences of high-income citizens when there is a disagreement between high- and low-income citizens on policy proposals.
Gilens' results, however, are contested. Soroka and Wlezien (Citation2008) study government spending and argue that the policy preferences of high-income and low-income citizens rarely differ, and thus there can be no reason for a strong bias in the government's response to different groups. Others have argued that the advantage to high-income citizens, at least relative to middle-income, is small and in some cases approaches zero (Ura & Ellis, Citation2008). In addition, Gilens' methods and analyses have been criticized by several authors who argue that his results are overstated (Bashir, Citation2015; Branham et al., Citation2017; Enns, Citation2015). While these conclusions might depend on model specifications to some degree, a reanalysis of Gilens data by Bowman (Citation2020) shows that most model specifications show that there is income bias in responsiveness.Footnote4 Other critics suggest that examining changes in policies can produce misleading results about who is represented (Elkjær, Citation2020; Elkjaer & Iversen, Citation2020). According to them, the Gilens approach does not pick up ‘differences in information about short-term fiscal policies.’ When looking at levels of spending rather than policy changes, Elkjaer and Iversen (Citation2020) find that policies are better aligned with the middle class than the rich and the poor. Moreover, they suggest that unequal responsiveness is a reflection of asymmetries in information about fiscal policy between different income groups rather than a structural bias (Elkjær, Citation2020; Elkjaer & Iversen, Citation2020).
As mentioned in the introduction, recent studies from Europe using the same approach as Gilens (Elsässer et al., Citation2020; Lupu & Tirado Castro, Citation2022; Mathisen et al., Citation2021; Mathisen, Citation2022; Persson, Citation2021; Schakel, Citation2021; Schakel & Hakhverdian, Citation2018) show that there is also biased responsiveness to the preferences of high-income citizens in Europe.Footnote5 In Sweden, previous studies have mainly examined opinion congruence (but not inequality between different income groups or policy implementation as outcomes). Holmberg (Citation1997) and Esaiasson and Holmberg (Citation1996) conclude that the opinions of voters and citizens are congruent over time and that the trends of opinion changes among voters and MPs are very similar. However, the changes seem to be due to changes among elites rather than citizens.Footnote6
One might expect responsiveness to be relatively high and unbiased in the Swedish context. First, voter turnout is relatively high – previous research has shown that politicians are more likely to respond to voters than to non-voters (Griffin & Newman, Citation2005). Second, the Swedish system is highly proportional, and research has shown that proportional systems better represent the public as a whole (Powell, Citation2000).Footnote7 And third, the level of economic equality is relatively high. The links between the wealthy and politicians are probably not as strong in Sweden, and the labor movement provides an alternative route to political influence that has no equivalent in the United States. However, previous comparative research has shown that institutional factors have limited influence on the degree of responsiveness (Rasmussen et al., Citation2019; Rosset & Kurella, Citation2021; Toshkov et al., Citation2020).
This paper aims to advance the discussion regarding the mechanisms explaining unequal responsiveness by looking at three possible explanations, that have been discussed in the literature but have rarely been properly tested. The first explanation is agenda setting, i.e., whether high-income citizens get what they want to a greater extent because they are better able to put their preferred policies on the political agenda. The second explanation is whether citizens prefer more costly policies than high-income citizens. Is the reason for unequal responsiveness that high-income citizens prefer policies that are easier to implement? And thirdly, do high-income citizens receive more support because the status quo is to their advantage? Status quo bias has been discussed extensively in the previous literature but has not been put forward as a direct explanation as to why citizens receive less responsiveness.
There is a need for a final note regarding conceptualization. In this paper I make a distinction between ‘congruence’ and ‘responsiveness’ (Bartels (Citation2021). The term ‘congruence’ refers to the extent to which actual policy changes are congruent with public support. The term responsiveness refers to the influence of opinions among different groups. Since the policy change variable is dichotomous, the distinction is subtle. Empirically congruence is calculated by looking at to what extent policy support in different income groups is congruent with policy changes, while responsiveness is studied with regression analyzes of the influence of policy support in different groups on policy changes.
Study design: data on public opinion connected to policy outcomes
Following the work of Gilens (Citation2012), I use survey questions that ask about policy support for specific policy proposals. The opinion data come from the Swedish National Election Studies (SNES) and the Society, Opinion, and Media (SOM) Institute. Both are non-commercial and publicly funded data collections. I examined all the old datasets (from 1956 to 2010) looking for questions about policy proposals at the national level. The criterion for including a question in the dataset is that it refers to a specific possible policy change in Swedish politics, e.g., closing all nuclear power plants, joining the EMU, raising the retirement age, or increasing income tax. Questions that were too vague and too broad were excluded, as it was not possible to give clear answers on whether these had been implemented. After excluding such questions, this gives us 933 unique measures of public opinion on policy proposals in different years (some questions asked in multiple years resulting in 257 unique questions). Examples include the introduction of a six-hour working day, the phasing out of nuclear energy, joining the North Atlantic Treaty Organisation, and the banning of pornography.Footnote8
For each of these questions, the level of support among the public as a whole and various subgroups was calculated (i.e., the percentage of those who said they supported the proposal). When responses were coded on scales, the proportion on the positive side of the scale was calculated. This measure is used in the analyzes as the independent variable. In addition, to construct the dependent variable, for each of these policy proposals, it was evaluated whether policies were changed in the direction of the proposal the same year as the question was asked or whether it was implemented at each succeeding year through 2014. I coded the data so that the implementation variable is coded 1 if the policy changes and 0 if it does not. This means, for example, that the implementation variable takes the value 0 for the proposal to join the EMU for the years when Sweden was not part of EMU and the value 1 after Sweden joined. For the variable on raising the retirement age, it takes the value 0 if the retirement age was not raised and 1 if it was raised, for the proposal on raising taxes it takes the value 0 if taxes were not raised and 1 if they were raised in the respective time windows. Since these evaluations are performed each year after the question was asked, we can look at responsiveness from both a short- and long-term perspective.
To assess whether a particular policy proposal was implemented, different sources are used depending on the nature of the policy. A team of research assistants coded the outcomes. Some survey questions relate specifically to policy decisions, and for these, we looked at transcripts from the national parliament. Other questions focus on the implementation of proposals. For these questions, we looked at the relevant sources for the topic. These might be, for example, budgets, administrative files, or documents relating to the closure of nuclear power stations or the construction of an infrastructure project. In addition, for many proposals that were never implemented, there is simply no source or documentation (as these policy changes were non-events). Thus, the unit of observation is a policy proposal (i.e., a survey question) posed to the public in a given year. The main independent variables are the level of support across groups and the main dependent variables are the implementation levels across years.Footnote9
How responsive is the Swedish political system?
Let us start the analyzes by evaluating to what extent the opinions of different groups of citizens are reflected in implemented policies. I use a congruence measure suggested by Bartels (Citation2021):
If a policy change was adopted, the extent of congruence for any given subgroup is measured by the proportion of that subgroup that favored the policy change, regardless of whether it is more or less than half; if the policy remained unchanged, the extent of congruence is simply the proportion that opposed the policy change.
Using the survey data, I predict support for policies at different income levels.Footnote10 The congruence measure was calculated for all citizens and the low-, middle, and high-income citizens respectively.
shows the congruence levels over 10 years after a survey question about a proposal was asked. Among low-income citizens, the mean level of congruence fluctuates around 47 to 48 percent, while it is usually about one to two percentage points higher for middle-income citizens. The congruence levels for high-income citizens are around 53 and 54 percent. There is thus a congruence gap of about six percent between low- and high-income citizens. However, overall, the level of policy change is quite low; 13 percent of the proposed changes were implemented during the tenure of the current government. The reader might ask how the congruence level may be about 50 percent while the level of implementation is only 13 percent. That is because the congruence measure takes into account both changes and non-changes (and to what extent citizens agree with those changes). Hence, it measures both to what extent citizens are congruent with being made as well as to what extent they are congruent with changes not being made. While the levels of congruence for high-income citizens are somewhat higher than for low-income citizens, both have congruence levels of around 50 percent. Whether this should be seen as a glass half full or half empty can of course be debated. On the one hand, policies are not unrelated to preferences, but on the other hand, one could from a theoretical standpoint expect policies to be congruent with preferences significantly more than half of the time.
Table 1. Mean levels of policy congruence.
While the analyzes of congruence provide an answer to the question ‘Who got what they wanted?’, it is equally important to study responsiveness and the question ‘Whose opinions mattered?’ To do the latter, I regress the dichotomous dependent variable ‘policy change’ on variables measuring support among the low-, middle- and high-income citizens using OLS regression models with heteroscedastic-consistent standard errors. shows the regression coefficients from a series of separate bivariate regressions with support levels at the 10th, 50th, and 90th percentiles as independent variables. Over time, the estimate for the 90th percentile becomes more positive and significant, while the estimates for the 10th and 50th percentiles are close to zero in all years. The policy support variable is scaled from zero to ten, meaning that a ten percent increase in support by the 90th percentile is associated with an increased likelihood of policy change of about one to three percentage points, depending on the time frame used.Footnote11 shows the results of the multivariate models. Under control for each other, only the high-income citizens' preferences matter positively for policy change; coefficients for the 10th percentile are even negative and significant for some years, and the coefficients for the 50th percentile are close to zero and insignificant, while the coefficients for the 90th percentile are significant. However, it should be noted that given the relatively high correlation between the income groups, and due to possible common measurement error, it is hard to separate these effects and especially to determine what is coincidental representation (when one group is getting represented because they agree with another group whose preferences are truly represented) and true representation of preferences (cf. Enns, Citation2015; Gilens, Citation2005).
Table 2. The relationship between opinions and policies, bivariate OLS slopes.
Table 3. The relationship between opinions and policies, multivariate OLS slopes.
The fact that responsiveness is measured every year after the question is asked brings the important finding that responsiveness increases over time. Other work in this area has mostly relied on fixed time-frames (such as four-year windows) and thus may have overlooked an increasing influence of the affluent over time.Footnote12
Are high-income citizens better at putting their preferred issues on the political agenda?
Let us now turn to the question of what may account for this bias. Perhaps elected officials do want to represent all citizens, but what low-income citizens want may not even be discussed in the political debate. It is well known in political science research that the step that determines what gets on the agenda can be as important as the actual policy decisions (Baumgartner et al., Citation2006; Baumgartner & Jones, Citation2010; Kingdon, Citation1984). However, Kingdon suggests that the step from agenda to decision is a big one that requires different political streams such as national mood and political acceptable solutions to coincide to make change happen.
Few studies to date have looked at agenda-setting in the context of unequal responsiveness. One exception is Flavin and Franko (Citation2017), which uses data on the introduction of bills in U.S. states to show ‘that state legislators are less likely to act on an issue when it is prioritized by low-income citizens as compared to affluent citizens’ (p. 659). They, therefore, suggest that: ‘political inequality is infused earlier in the policy-making process at the agenda-setting stage’ (p. 659). Another important contribution by Rigby and Wright (Citation2013) shows that party positions are influenced by the preferences of high-income citizens, while the preferences of low-income citizens are largely overlooked. An interesting example looking at comparative data is a recent paper by Weber (Citation2020) where he studies election platforms in 42 countries and finds that ‘marginalized groups’ related to income, gender and education get ignored when it comes to a large majority of issues.
One problem with the type of data used in this study is that it includes both salient issues that were central to the Swedish political debate and other issues that may have been more peripheral. To test this I constructed a measure of whether an issue was on the institutional agenda; whether or not an issue was discussed in a parliamentary debate in the year in which the question was asked. The minutes of the Swedish Riksdag is available online, but the period studied includes more than 7,000 protocols which makes manually reading them a very time-consuming task. One could search for the wording of the policy proposals, but this is not without problems. While some proposals have unique keywords such as ‘join the EU’, many other proposals are difficult to find. For example, a search for ‘aid’ would yield results of debates on foreign aid to developing countries and financial aid in the form of social benefits.
To obtain the best possible estimates without reading all 7,459 documents, supervised machine learning with multi-labeling classification was used. A training dataset was created with about 10 percent of the material (771 transcripts) classified as to whether the topics were discussed or not. The algorithm worked its way through the remaining 6,688 transcripts. One way to evaluate the labeling of the transcripts is to look at the Hamming loss, which indicates how often a transcript was mislabeled on average (it ranges from 0 to 1, and the closer to 0, the better). The labeling resulted in a Hamming loss of 0.011.
I constructed a binary variable indicating whether each specific topic was debated at least once in a parliamentary debate in the year the question was asked in the survey. Fifty-one percent of the topics were classified as having been debated in Parliament in the year the question was asked. provides results from a congruence measure similar to the previously shown on policy congruence, but this one uses the variable indicating whether an issue was discussed in parliament (instead of implementation) resulting in a measure of how congruent groups were with what was discussed in parliament. The results are strikingly similar across income groups; policy support for the issues discussed (or not discussed) in parliament was about the same in all income groups. Hence, the results show no clear evidence that the proposals preferred by high-income citizens were discussed more in parliament than the proposals preferred by low-income citizens.
Table 4. Mean levels of policy agenda congruence.
A series of regressions were estimated in which the binary variable indicating that an issue was debated in Parliament was regressed on support in the high, middle, and low-income groups for different periods. The coefficients from these regressions are shown in . Whether the time between public opinion measures and parliamentary discussion is short (one year) or longer (up to ten years), the effect of support in the three income groups on parliamentary discussion is indistinguishable from zero. Thus, judging from these data, the high-income groups do not appear to be any better at getting their preferred proposals on the parliamentary agenda.
Table 5. The relationship between opinions and discussion in parliament, bivariate OLS slopes.
Do the low-income citizens prefer more costly policy proposals?
A second possible explanation is that low-income citizens demand more costly changes, while high-income citizens are more likely to support symbolic issues that do not have large economic costs. In other words, it might be ‘cheaper’ to satisfy high-income citizens than low-income citizens. Research has suggested that voters place more value on symbolic policy reforms than on concrete reforms that balance costs and benefits (cf. Achen & Bartels, Citation2017; Mendelberg, Citation2018). While we know that low-income citizens prefer more government spending and redistribution (Erikson, Citation2015), there is no clear evidence from previous research that certain income groups should prefer symbolic reforms more than others.
To assess the importance of symbolic versus costly policies, all policy issues were hand-coded as either cost-neutral (this includes symbolic changes like gay marriage, regulation of commercials on TV, or allowing euthanasia), costly to the government (e.g., more vacation days or higher welfare benefits), or economically beneficial to the government (e.g., reducing foreign aid). When the choice is unclear, the decision is based on what the immediate consequence would be for the government budget, proposals with unclear economic consequences are coded as ‘cost neutral’. It turns out that low-income citizens are more likely to support a policy change than high-income citizens on both costly and neutral issues, but also on issues that would benefit the government budget.
First of all, low-income citizens show higher mean levels of support for costly issue proposals (mean support 57 percent), compared to neutral (54 percent) and beneficial (49 percent). But the high-income citizens also show higher support for the costly proposals (50 percent mean support) compared to the neutral and beneficial ones (both 46 percent support). The low-income citizens are more supportive of the costly proposals than high-income citizens.
shows the congruence levels across the income groups for the three kinds of policy proposals. To save space, I show these coefficients only for four- and eight-year windows. Policy congruence is fairly high and around 55 and 56 percent for all estimates of beneficial policies with small differences across income groups. So it is not the case that the high-income citizens get congruence only because they receive more symbolic and ‘cheap’ policies that they like. The congruence levels for neutral and costly policies are lower, but here we see clear differences between the income groups and the high-income citizens have higher levels of policy congruence than the low- and middle-income citizens. And it is not the case that the politicians do not want to implement costly policies at all, indeed congruence is higher for the high-income citizens for these policies.Footnote13
Table 6. Mean levels of policy congruence for issues that are costly, neutral or beneficial for the state budget.
Does the status quo bias work to the advantage of the high-income citizens?
I have already mentioned two trends in the data that should now be explored in more detail: (a) the fact that there is a strong bias toward the status quo and (b) the fact that low-income citizens want a higher degree of policy change. Status quo bias is a recurring pattern in previous studies of political responsiveness both in the U.S. (Gilens, Citation2012) as well as in Europe (Rasmussen et al., Citation2021). In their work on the U.S. congress Baumgartner et al. (Citation2009) writes that the most consistent finding is that ‘defenders of the status quo usually get what they want: no change’ (p. 241).Footnote14 And in the study most explicitly dealing with status quo bias and responsiveness in the US, Enns et al. (Citation2014) conclude ‘that the status quo bias created by the design of American policy-making institutions has contributed to rising inequality’ and created ‘a situation in which inequality becomes difficult to reverse’ (p. 289, 301).
Status quo bias is a pattern that often occurs in many different areas of human life and it can be defined as the ‘non-rational or biased preference for the current way of doing things’ (Godefroid et al., Citation2022). Experimental studies on decision-making have shown that individuals ‘disproportionally stick with the status quo’ (Samuelson & Zeckhauser, Citation1988), even when it would be more rational to opt for change. Psychological theories suggest that individuals might avoid changes since they overestimate the resulting instability and predict more radical changes than what is warranted. People might also have a preference for sticking to a system that they have invested a lot of time and effort to understand and deal with. Status quo bias can operate both at the individual level by making individuals less likely to support political change (Bolsen et al., Citation2014) and at the collective level where different actors can block each other's positions and thereby hinder change. Godefroid et al. (Citation2022) writes that: ‘Status quo effects are likely to be of significance in the domain of negotiated public policy outcomes. The presence of multiple interests creates a different pressure for sticking with the status quo.’ (p. 46).
Turning again to the Swedish case, it is obvious that policy changes are also hard to enact in a parliamentary system such as Sweden's. The proportional representation system facilitates the representation of many parties in parliament, so majority governments are rare. Coalition building is almost always necessary and few parties can implement their party programs without compromising with other parties. This means that, in general, a policy proposal will most likely not lead to a change in policy. In addition, the winning margins for governments have often been small, and situations, where one party is strong enough to dominate the political scene, are rare. Empirical studies confirm veto player theory and show that the government's ability to introduce reforms can be decreased under certain circumstances (Angelova et al., Citation2018).Footnote15 Combine this finding with the fact that high-income citizens are more likely to be satisfied with the current state of affairs, while low-income citizens want more policy change, and it becomes clear why responsiveness is skewed towards the preferences of the high-income citizens. Let us now consider this in more detail.
In essence, the argument is that the advantaged groups in society have the most to gain from the absence of policy change. Thus, they can use their negative power to hinder policy changes and thus keep a situation that they benefit from. This can be done either by forming coalitions against policy changes, trying to influence strategic actors or delaying the policy-making process. Overall, the tendency towards status quo bias in political decision-making can benefit high-income citizens by allowing them to maintain their current advantages and prevent any changes that might jeopardize their position.
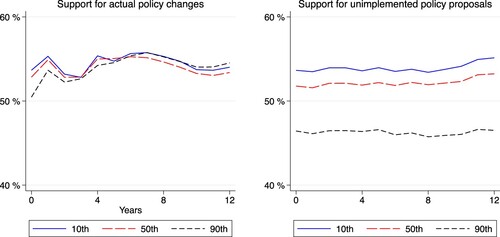
Support for policy change is higher among low-income citizens than among high-income citizens. At the 10th income percentile, average support for policy change is 54 percent, while at the 90th income percentile, average support is 47 percent. Looking at the sample as a whole, the average support is 51 percent.
The illustrations in show the level of support for policy change across income groups split between implemented (left) and unimplemented (right) policies. As it turns out, there is not much difference in the popularity of implemented policies across income groups. The big difference is that there are many more policy proposals that low-income citizens would like to see implemented but never become realized. Of the policy proposals that were not implemented within the same government term, mean support was 54 percent among low-income citizens and 46 percent among high-income citizens; an 8 percentage point difference in support for the unimplemented proposals when comparing low- and high-income citizens. Thus, the biases found in responsiveness can largely be explained by the failure to translate the preferences of low-income citizens into policies, rather than implemented policies being biased in favor of high-income citizens. Thus, the status quo bias in the system works to the disadvantage of low-income citizens who want more change.
Figure 1. Mean policy support among income groups for proposals that were implemented or not implemented.
Even though the status quo seems to be a technical and rather apolitical tendency, it can also be interpreted more politically. High-income citizens may have more ‘negative power’ that allows them to stop policy proposals they do not want to see implemented. This could perhaps be done by lobbying campaigns or attempts to try to dominate the public debate.
Low-income groups want more fundamental reforms and more redistribution in society. Some examples here are introducing a six-hour workday, making unemployment insurance more generous, stopping the export of weapons, and closing down nuclear power. These are a few main examples of proposals that the low-income citizens were more supportive of than high-income citizens, that were never implemented.
Conclusions
How can it be the case that the rich dominate the poor even in an egalitarian welfare state such as Sweden where many resources have been redistributed to increase the lives of the working and middle classes? Most of our data come from the period 1990 to 2010, when the welfare state was already established and downsizing started to be an issue. Despite that Sweden has a reputation of being a generous welfare state, many important decisions have gone the way the affluent prefer during the last few decades; Sweden joined the EU, kept nuclear power, de-regulated the financial markets, allowed private companies to run schools and provide health care, etc. Hence, rather than an era of welfare state expansion, the 1990s and early 2000s was an era of new-public management, privatization of public goods and de-regularization of markets. These are policies that, in general, high-income citizens preferred to a larger extent than low-income citizens. At the same time, there has been a relative consensus around some core parts of the welfare state, from both left and right. In the dataset, we can see that low-income citizens often were supportive of an expansion of welfare during the latest decades. But instead of an expansion the status quo most often prevailed.
A few words need to be said about the size of the differences in congruence; is a gap of six percentage points really important? Obviously, it does not mean that the rich always ‘rule’ and get everything they want while the poor never get things their way. Given that preferences are highly correlated such a situation would not be possible. Since these admittedly relatively moderate differences might add up over time, the total consequences might be substantial, especially if they over time alter the status quo in the direction of the preferences of the advantaged. While low-income citizens receive lower congruence levels than high-income citizens, their preferences also get represented to a certain degree. However, it is hard to say how much of that is ‘coincidental representation’ due to the fact the preferences between income groups are correlated (cf. Enns, Citation2015).
However, much less research has focused on trying to explain biased responsiveness. This paper contributes to the discussion by exploring three possible explanations: (a) that low-income citizens fail to get their preferred policies on the institutional agenda, (b) that they demand costly policy changes while high-income citizens prefer more symbolic policy reforms, and (c) that the status quo bias works to the advantage of high-income citizens. These are theoretically important potential explanations that we have so far understood only to a very limited extent. This paper adds to the literature by suggesting that, at least in Sweden, the preferences of high-income citizens are better represented, not because the poor do not put their preferred policies on the institutional agenda or because the high-income citizens receive congruence on only symbolic issues and non-costly issues. Kingdon (Citation1984) emphasizes that the step from the agenda to an actual decision is a large one that requires that several factors are working together to promote change. That leads us to the final explanation which indicates that policy changes are relatively rare events. It is mainly the bias toward the status quo that prevents low-income citizens from getting the policies they want. This could be because advantaged citizens have more ‘negative power,’ that is, the ability to prevent the passage of policies they do not support.
While we now have several studies from the US and Western Europe that shows unequal responsiveness, it is hard to say how far the suggested mechanism travel. On the one hand, we have studies from the US suggesting that the status quo bias works to the advantage of the rich there as well (Enns et al., Citation2014). But on the other hand, we do not know what role factors like campaign contributions, the media landscape, and union density play in other countries where they look very different. A reasonable speculation is that the status quo bias might attenuate the upper-class bias produced by other factors.
Supplemental Material
Download PDF (110.8 KB)Acknowledgments
I am grateful for detailed and helpful comments from Mel Atkinson, Larry Bartels, Alex Branham, Love Christensen, Peter Enns, Martin Gilens, Mikael Gilljam, Eric Guntermann, Hanna Lierse, Johannes Lindvall, Miguel Pereira, Jonas Pontusson, Stefan Svallfors, Chris Wlezien and Huang-Ting Yan. I thank Christian Björkdahl, Mattias Ottervik, Klara Lindahl, Simon Lundin and Pär Åberg for excellent research assistance. I also thank participants at presentations at the Institute for Future Studies in Stockholm, McGill University, the University of Copenhagen, the Université de Genève and the University of Gothenburg, as well participants at DVPW in Frankfurt 2018, EPSA in Vienna 2018, MPSA in Chicago 2019 and APSA in Washington D.C in 2019.
Disclosure statement
No potential conflicts of interest was reported by the author.
Additional information
Funding
Notes on contributors
Mikael Persson
Mikael Persson is Professor at the Department of Political Science at the University of Gothenburg, Sweden.
Notes
1 This should not be seen as an exhaustive list of explanations, there might certainly be others as well, such as the role of interest groups and lobbyists, which other studies have focused on. Neither are the explanations necessarily mutually exclusive (perhaps in particular the explanations about status quo bias and costly policies may overlap).
2 Some studies look at geographic differences in responsiveness. For example, Lax and Phillips (Citation2012) examines responsiveness in democratic states and shows that there is a ‘democratic deficit’ at the state level.
3 In a study that looks more closely at biased responsiveness at the U.S. state level, Flavin (Citation2012) finds a stronger influence on the opinions of high-income than low-income citizens on some important issues. In a case study of U.S. foreign policy, (Jacobs & Page, Citation2005) finds that high-status citizens have a strong influence on policy, while low-income citizens have a weaker influence. Moreover, (Griffin & Newman, Citation2007) find that policy outcomes also depend on ethnicity. In looking at opinion congruence, they find that elected officials are more responsive to the preferences of whites than Latinos.
4 See also the responses of Gilens (Citation2015, Citation2016).
5 Other researchers have attempted to go beyond the relationship between income and responsiveness and examine other aspects of the question. Homola (Citation2019) and Reher (Citation2018) show that responsiveness is stronger among men than women, Adams and Ezrow (Citation2009) show that people follow opinion leaders rather than party platforms, Boonen et al. (Citation2017) show that people who are highly politically sophisticated and partisan have beliefs that are more congruent with politicians. Moreover, a strand of recent US studies turn to the influence of parties and the main message from these studies is that Republicans tend to represent the high-income citizens and that democrats do the reversed (Brunner et al., Citation2013). Lax et al. (Citation2019) show that ‘the poor get what they want more often from Democrats’ while ‘the rich get what they want more often from Republicans’ and ‘partisanship induces, shapes, and constrains affluent influence’ (p. 917). Rhodes and Schaffner (Citation2017) offer similar conclusions from their study based on several different datasets; the Republicans represent primarily the rich while the Democrats represent income groups in a way that is flat or negative. In yet another study, which incorporates interest groups into the analysis, Grossmann et al. (Citation2021) shows that Republicans are aligned with business interests and the rich peoples' preferences. In this paper, I am not looking at different party positions, but only implemented policies -- which makes it hard to make similar analyzes. While it would be possible to compare responsiveness in Sweden under the left and right governments, there is not much variation to work with; the Social democrats dominated politics in the post-war era and the three periods with center-right governments all coincided with deep economic crises which makes a straight comparison under similar circumstances impossible.
6 See Guntermann and Persson (Citation2021) for a study of issue voting and responsiveness in Sweden.
7 For a counterargument, however, see Rogowski and Kayser (Citation2002).
8 One research assistant was responsible for working with the opinion data and two assistants were responsible for the implementation data. The two latter provided the coding to the principal investigators who made a careful evaluation of the coding of each question before finalizing the dataset. After the dataset was finalized, we conducted inter-coder reliability checks with three additional coders who received the same set of questions. The first one coded 207 observations with an agreement rate of 88 percent concerning the original coding with a Krippendorff's alpha of .72, the second one coded 202 observations with an agreement of 86 percent to the original coding and a Krippendorff's alpha of .65. Both these coders were Swedish political science PhD students with a good knowledge of Swedish political history. To evaluate what reliability would look like when the coding was done by someone without that knowledge we asked a third political science student from another European country to code 100 observations, this resulted in an overall level of agreement of .78 percent with a Krippendorff's alpha of .43. Hence, it is clear that the level of agreement varies by coder to some extent. It should thus be taken into account that it is hard to perfectly measure the dependent variable and some level of coder error is likely present in the dependent variable.
9 For more information on the data, see the Appendix, Section A.
10 See the Appendix for a methodological discussion of this question.
11 The correlation between support at the 90th and 10th percentiles is .82.
12 An important question is to what extent this collection of policy proposals resembles a random sample of the total population of issues. To begin with, there is no clear definition of the true population of issues (Burstein, Citation2006). For example, should it cover proposals that are ‘on the agenda’ among the public, in the media, or among political actors? And how should these agendas be defined? For the present study, I rely on the principal investigators' judgment of which policy proposals were relevant to ask about at different times. Still, in studies like this, there is a potential problem that issues that are not on the agenda or might be favored by certain socio-economic groups, might have been asked too often in the surveys thus biasing the results. I re-estimated the main models just presented, but only for issues discussed in parliament in the same years as they were asked in the surveys (52 percent of the issues). While this is not a representative sample either, the robustness check can tell whether the analyzes are driven by issues that were not on the political agenda. The results from these analyzes are very similar to the results presented in the main paper.
13 See the Appendix for regression analyzes of responsiveness to the costly, neutral, and beneficial issues.
14 This also shown in studies on lobbying (McKay, Citation2012)
15 However, not all theories of veto players would suggest that Sweden is a hard case for policy change (Immergut, Citation1990). This argument is limited to a few aspects of the political system.
References
- Achen, C. H. (1977). Measuring representation: Perils of the correlation coefficient. American Journal of Political Science, 21(4), 805–815. https://doi.org/10.2307/2110737
- Achen, C. H., & Bartels, L. M. (2017). Democracy for realists: Why elections do not produce responsive government. Princeton University Press.
- Adams, J., & Ezrow, L. (2009). Who do European parties represent? How Western European parties represent the policy preferences of opinion leaders. The Journal of Politics, 71(1), 206–223. https://doi.org/10.1017/S0022381608090130
- Angelova, M., Bäck, H., Müller, W. C., & Strobl, D. (2018). Veto player theory and reform making in Western Europe. European Journal of Political Research, 57(2), 282–307. https://doi.org/10.1111/ejpr.2018.57.issue-2
- Bartels, L. M. (2009). Unequal democracy: The political economy of the new gilded age. Princeton University Press.
- Bartels, L. M. (2021). Measuring political inequality. [Unpublished paper].
- Bashir, O. S. (2015). Testing inferences about American politics: A review of the ‘Oligarchy’ result. Research & Politics, 2(4). https://doi.org/10.1177/2053168015608896
- Baumgartner, F. R., Berry, J. M., Hojnacki, M., Leech, B. L., & Kimball, D. C. (2009). Lobbying and policy change: Who wins, who loses, and why. University of Chicago Press.
- Baumgartner, F. R., Green-Pedersen, C., & Jones, B. D. (2006). Comparative studies of policy agendas. Journal of European Public Policy, 13(7), 959–974. https://doi.org/10.1080/13501760600923805
- Baumgartner, F. R., & Jones, B. D. (2010). Agendas and instability in American politics. University of Chicago Press.
- Bernauer, J., Giger, N., & Rosset, J. (2015). Mind the gap: Do proportional electoral systems foster a more equal representation of women and men, poor and rich?. International Political Science Review, 36(1), 78–98. https://doi.org/10.1177/0192512113498830
- Binzer Hobolt, S., & Klemmemsen, R. (2005). Responsive government? Public opinion and government policy preferences in Britain and Denmark. Political Studies, 53(2), 379–402. https://doi.org/10.1111/j.1467-9248.2005.00534.x
- Binzer Hobolt, S., & Klemmensen, R. (2008). Government responsiveness and political competition in comparative perspective. Comparative Political Studies, 41(3), 309–337. https://doi.org/10.1177/0010414006297169
- Bolsen, T., Druckman, J. N., & Cook, F. L. (2014). How frames can undermine support for scientific adaptations: Politicization and the status-quo bias. Public Opinion Quarterly, 78(1), 1–26. https://doi.org/10.1093/poq/nft044
- Boonen, J., Pedersen, E. F., & Hooghe, M. (2017). The effect of political sophistication and party identification on voter–party congruence. A comparative analysis of 30 countries. Journal of Elections, Public Opinion and Parties, 27(3), 311–329. https://doi.org/10.1080/17457289.2016.1273226
- Bowman, J. (2020). Do the affluent override average Americans? Measuring policy disagreement and unequal influence. Social Science Quarterly, 101(3), 1018–1037. https://doi.org/10.1111/ssqu.v101.3
- Branham, J. A., Soroka, S. N., & Wlezien, C. (2017). When do the rich win?. Political Science Quarterly, 132(1), 43–62. https://doi.org/10.1002/polq.12577
- Brooks, C., & Manza, J. (2006). Why do welfare states persist?. The Journal of Politics, 68(4), 816–827. https://doi.org/10.1111/j.1468-2508.2006.00472.x
- Brooks, C., & Manza, J. (2008). Why welfare states persist: The importance of public opinion in democracies. University of Chicago Press.
- Brunner, E., Ross, S. L., & Washington, E. (2013). Does less income mean less representation?. American Economic Journal: Economic Policy, 5(2), 53–76. https://doi.org/10.1257/pol.5.2.53
- Burstein, P. (2006). Why estimates of the impact of public opinion on public Policy are too high: Empirical and theoretical implications. Social Forces, 84(4), 2273–2289. https://doi.org/10.1353/sof.2006.0083
- Elkjaer, M. A., & Iversen, T. (2020). The political representation of economic interests: Subversion of democracy or middle-class supremacy?. World Politics, 72(2), 254–290. https://doi.org/10.1017/S0043887119000224
- Elkjær, M. A. (2020). What drives unequal policy responsiveness? Assessing the role of informational asymmetries in economic policy-making. Comparative Political Studies, 53(14), 2213–2245. https://doi.org/10.1177/0010414020912282
- Elsässer, L., Hense, S., & Schäfer, A. (2020). Not just money: Unequal responsiveness in egalitarian democracies. Journal of European Public Policy, 1–19. https://doi.org/10.1080/13501763.2020.1801804
- Enns, P. K. (2015). Reconsidering the middle: A reply to martin gilens. Perspectives on Politics, 13(4), 1072–1074. https://doi.org/10.1017/S1537592715002339
- Enns, P. K., Kelly, N. J., Morgan, J., Volscho, T., & Witko, C. (2014). Conditional status quo bias and top income shares: How US political institutions have benefited the rich. The Journal of Politics, 76(2), 289–303. https://doi.org/10.1017/S0022381613001321
- Erikson, R. S. (2015). Income inequality and policy responsiveness. Annual Review of Political Science, 18, 111–29. https://doi.org/10.1146/polisci.2015.18.issue-1
- Erikson, R. S., MacKuen, M. B., & Stimson, J. A. (2002). The macro polity. Cambridge University Press.
- Esaiasson, P., & Holmberg, S. (1996). Representation from above: Members of parliament and representative democracy in Sweden. Dartmouth Publishing Company.
- Flavin, P. (2012). Income inequality and policy representation in the American states. American Politics Research, 40(1), 29–59. https://doi.org/10.1177/1532673X11416920
- Flavin, P., & Franko, W. W (2017). Government's unequal attentiveness to citizens' political priorities. Policy Studies Journal, 45(4), 659–687. https://doi.org/10.1111/psj.v45.4
- Giger, N., Rosset, J., & Bernauer, J. (2012). The poor political representation of the poor in a comparative perspective. Representation, 48(1), 47–61. https://doi.org/10.1080/00344893.2012.653238
- Gilens, M. (2005). Inequality and democratic responsiveness. Public Opinion Quarterly, 69(5), 778–796. https://doi.org/10.1093/poq/nfi058
- Gilens, M. (2012). Affluence and influence: Economic inequality and political power in America. Princeton University Press.
- Gilens, M. (2015). The insufficiency of ‘democracy by coincidence’: A response to Peter K. Enns. Perspectives on Politics, 13(4), 1065–1071. https://doi.org/10.1017/S1537592715002327
- Gilens, M. (2016). Simulating representation: The devil's in the detail. Research and Politics. https://doi.org/10.1177/2053168016654720
- Gilens, M., & Page, B. I. (2014). Testing theories of American politics: Elites, interest groups, and average citizens. Perspectives on Politics, 12(3), 564–581. https://doi.org/10.1017/S1537592714001595
- Godefroid, M.-E., Plattfaut, R., & Niehaves, B. (2022). How to measure the status quo bias? A review of current literature. Management Review Quarterly, 1–45. https://doi.org/10.1007/s11301-022-00283-8
- Griffin, J. D., & Newman, B. (2005). Are voters better represented?. The Journal of Politics, 67(4), 1206–1227. https://doi.org/10.1111/j.1468-2508.2005.00357.x
- Griffin, J. D., & Newman, B. (2007). The unequal representation of Latinos and Whites. The Journal of Politics, 69(4), 1032–1046. https://doi.org/10.1111/j.1468-2508.2007.00605.x
- Grossmann, M., Mahmood, Z., & Isaac, W. (2021). Political parties, interest groups, and unequal class influence in American policy. The Journal of Politics, 83(4), 1706–1720. https://doi.org/10.1086/711900
- Guntermann, E., & Persson, M. (2021). Issue voting and government responsiveness to policy preferences. Political Behavior, 1–24. https://doi.org/10.1007/s11109-021-09716-8
- Hakhverdian, A. (2010). Political representation and its mechanisms: A dynamic left–right approach for the United Kingdom, 1976–2006. British Journal of Political Science, 40(4), 835–856. https://doi.org/10.1017/S000712341000013X
- Holmberg, S. (1997). Dynamic opinion representation. Scandinavian Political Studies, 20(3), 265–283. https://doi.org/10.1111/scps.1997.20.issue-3
- Homola, J. (2019). Are parties equally responsive to women and men?. British Journal of Political Science, 49(3), 957–975. https://doi.org/10.1017/S0007123417000114
- Immergut, E. M. (1990). Institutions, veto points, and policy results: A comparative analysis of health care. Journal of Public Policy, 10(4), 391–416. https://doi.org/10.1017/S0143814X00006061
- Jacobs, L. R., & Page, B. I. (2005). Who influences US foreign policy?. American Political Science Review, 99(1), 107–123. https://doi.org/10.1017/S000305540505152X
- Kingdon, J. W. (1984). Agendas, alternatives, and public policies. Little, Brown Boston.
- Lax, J. R., & Phillips, J. H. (2012). The democratic deficit in the states. American Journal of Political Science, 56(1), 148–166. https://doi.org/10.1111/j.1540-5907.2011.00537.x
- Lax, J. R., Phillips, J. H., & Zelizer, A. (2019). The party or the purse? Unequal representation in the US senate. American Political Science Review, 113(4), 917–940. https://doi.org/10.1017/S0003055419000315
- Lupu, N., & Tirado Castro, A. (2022). Unequal policy responsiveness in Spain. Socio-Economic Review. https://doi.org/10.1093/ser/mwac040
- Lupu, N., & Warner, Z. (2022a). Affluence and congruence: Unequal representation around the world. The Journal of Politics, 84(1), 276–290. https://doi.org/10.1086/714930
- Lupu, N., & Warner, Z. (2022b). Why are the affluent better represented around the world?. European Journal of Political Research, 61, 67–85. https://doi.org/10.1111/1475-6765.12440
- Mathisen, R. B. (2022). Affluence and influence in a social democracy. American Political Science Review. https://doi.org/10.1017/S0003055422000739
- Mathisen, R., Schakel, W., Hense, S., Elsässer, L., Persson, M., & Pontusson, H. J. (2021). Unequal responsiveness and government partisanship in northwest Europe. Working paper.
- McKay, A. (2012). Negative lobbying and policy outcomes. American Politics Research, 40(1), 116–146. https://doi.org/10.1177/1532673X11413435
- Mendelberg, T. (2018). From the folk theory to symbolic politics: Toward a more realistic understanding of voter behavior. Critical Review, 30(1–2), 107–118. https://doi.org/10.1080/08913811.2018.1448515
- Miller, W. E., & Stokes, D. E. (1963). Constituency influence in congress. American Political Science Review, 57(1), 45–56. https://doi.org/10.2307/1952717
- Monroe, A. D. (1979). Consistency between public preferences and national policy decisions. American Politics Quarterly, 7(1), 3–19. https://doi.org/10.1177/1532673X7900700101
- Monroe, A. D. (1998). Public opinion and public policy, 1980–1993. Public Opinion Quarterly, 62(1), 6–28. https://doi.org/10.1086/297828
- Page, B. I., & Shapiro, R. Y. (1983). Effects of public opinion on policy. American Political Science Review, 77(1), 175–190. https://doi.org/10.2307/1956018
- Persson, M. (2021). From opinions to policies: Examining the links between citizens, representatives, and policy change. Electoral Studies, 74, 102413. https://doi.org/10.1016/j.electstud.2021.102413
- Peters, Y., & Ensink, S. J. (2015). Differential responsiveness in Europe: The effects of preference difference and electoral participation. West European Politics, 38(3), 577–600. https://doi.org/10.1080/01402382.2014.973260
- Powell, G. B. (2000). Elections as instruments of democracy: Majoritarian and proportional visions. Yale University Press.
- Rasmussen, A., Binderkrantz, A. S., & Klüver, H. (2021). Organised interests in the media and policy congruence: The contingent impact of the status quo. European Journal of Political Research, 60(4), 975–993. https://doi.org/10.1111/ejpr.v60.4
- Rasmussen, A., Reher, S., & Toshkov, D. (2019). The opinion-policy nexus in Europe and the role of political institutions. European Journal of Political Research, 58(2), 412–434. https://doi.org/10.1111/ejpr.2019.58.issue-2
- Reher, S. (2018). Gender and opinion–policy congruence in Europe. European Political Science Review, 10(4), 613–635. https://doi.org/10.1017/S1755773918000140
- Rhodes, J. H., & Schaffner, B. F. (2017). Testing models of unequal representation: Democratic populists and republican oligarchs?. Quarterly Journal of Political Science, 12(2), 185–204. https://doi.org/10.1561/100.00016077
- Rigby, E., & Wright, G. C. (2013). Political parties and representation of the poor in the American states. American Journal of Political Science, 57(3), 552–565. https://doi.org/10.1111/ajps.2013.57.issue-3
- Rogowski, R., & Kayser, M. A. (2002). Majoritarian electoral systems and consumer power: Price-level evidence from the OECD countries. American Journal of Political Science, 46(3), 526–539. https://doi.org/10.2307/3088397
- Rosset, J., Giger, N., & Bernauer, J. (2013). More money, fewer problems? Cross-level effects of economic deprivation on political representation. West European Politics, 36(4), 817–835. https://doi.org/10.1080/01402382.2013.783353
- Rosset, J., & Kurella, A.-S. (2021). The electoral roots of unequal representation. A spatial modelling approach to party systems and voting in Western Europe. European Journal of Political Research, 60, 785–806. https://doi.org/10.1111/1475-6765.12423
- Samuelson, W., & Zeckhauser, R. (1988). Status quo bias in decision making. Journal of Risk and Uncertainty, 1(1), 7–59. https://doi.org/10.1007/BF00055564
- Schakel, W. (2021). Unequal policy responsiveness in the Netherlands. Socio-Economic Review, 19(1), 37–57. https://doi.org/10.1093/ser/mwz018
- Schakel, W., Burgoon, B., & Hakhverdian, A. (2020). Real but unequal representation in welfare state reform. Politics & Society, 48(1), 131–163. https://doi.org/10.1177/0032329219897984
- Schakel, W., & Hakhverdian, A. (2018). Ideological congruence and socio-economic inequality. European Political Science Review, 10(3), 441–465. https://doi.org/10.1017/S1755773918000036
- Soroka, S. N., & Wlezien, C. (2005). Opinion and policy dynamics: Public preferences and public expenditure in the United Kingdom. British Journal of Political Science, 35(4), 665–689. https://doi.org/10.1017/S0007123405000347
- Soroka, S., & Wlezien, C. (2008). On the limits to inequality in representation. PS: Political Science & Politics, 41(2), 319–327. https://doi.org/10.1017/S1049096508080505
- Soroka, S. N., & Wlezien, C. (2010). Degrees of democracy: Politics, public opinion, and policy. Cambridge University Press.
- Stimson, J. A., MacKuen, M. B., & Erikson, R. S. (1995). Dynamic representation. American Political Science Review, 89(3), 543–565. https://doi.org/10.2307/2082973
- Toshkov, D., Mäder, L., & Rasmussen, A. (2020). Party government and policy responsiveness. Evidence from three parliamentary democracies. Journal of Public Policy, 40(2), 329–347. https://doi.org/10.1017/S0143814X18000417
- Ura, J. D., & Ellis, C. R. (2008). Income, preferences, and the dynamics of policy responsiveness. PS: Political Science & Politics, 41(4), 785–794. https://doi.org/10.1017/S104909650808102X
- Weber, T. (2020). Discreet inequality: How party agendas embrace privileged interests. Comparative Political Studies, 53(10–11), 1767–1797. https://doi.org/10.1177/0010414020912286
- Wlezien, C. (1995). The public as thermostat: Dynamics of preferences for spending. American Journal of Political Science, 39(4), 981–1000. https://doi.org/10.2307/2111666
- Wlezien, C. (2017). Public opinion and policy representation: On conceptualization, measurement, and interpretation. Policy Studies Journal, 45(4), 561–582. https://doi.org/10.1111/psj.v45.4
- Wlezien, C., & Soroka, S. N. (2007). The relationship between public opinion and policy. In R. J. Dalton & H.-D. Klingemann (Eds.), The Oxford handbook of political behavior (pp. 799–817). Oxford University Press.