
ABSTRACT
This article investigates NAIRU which stands for Non Accelerating Inflation Rate of Unemployment and its trend in three of the world gigantic economies to mention orderly USA, Japan and China. A Vector Autoregressive Regression model estimated to study the reaction of NAIRU to shocks imposed by labour productivity. Results indicate both productivity shocks and NAIRU fluctuations have counter effects.
I. Introduction
Equilibrium in unemployment leads us to the concept of NAIRU (Non Accelerating Inflation Rate of Unemployment) which in fact is the most important indicator in order to see the structural changes in labour market (Komijani and Mohebi Citation2013). There are some factors having influence on NAIRU among all labour productivity and is highlighted in researches carried out by economists. Mankiw and Ball (Citation2002) in their paper state that ‘In the future they should expand their scope to build and test models of inflation, unemployment and productivity’. Hatton (Citation2007) utilized long-run data of UK for examining whether a consistent relationship exists between productivity growth and unemployment. The results indicate that with faster productivity growth, NAIRU behaves in opposite direction.Footnote1 The most important factor that has been taken for analysis in most studies is how productivity treats. (Mohebi, Citation2017) Based on which in this article a VAR model is applied to yearly data to explain the effects of productivity shocks on NAIRU. The rest of this article is organized as follows: in the first part, the trend of NAIRU for three countries is depicted in front of productivity, the next part is devoted to the VAR estimation of the relationship between unemployment and labour productivity shocks, Section V belongs to Granger causality analysis and the last part concludes.
II. NAIRU and its trend
According to the plotted NAIRU in front of productivity, the trends and factors influencing them will be taken for analysis. As it is vivid from trend of USA based on the statistics of productivity, it can be categorized in four main periods. From 1982 till 1987 and from 1995 till 2000 productivity has increased and NAIRU behaved in opposite direction which technically means that it has pushed downward by the improvement in the labour productivity. Through 1988 till 1994 and from 2001 till 2007 productivity and NAIRU are varying in the same directions. In order to explain the behaviour of NAIRU in mentioned periods, groups of factors can be engaged such as: composition of the unemployed population and labour force, institutional factors as acting to match unemployed workers and job vacancies, business cycles and other structural shocks such as productivity growth and reallocation of unemployment across sectors and regions.(Eli’as 1991)
In china, NAIRU is falling in two periods (1990–1991 and 1996–2000) and its increasing trend is between years 1992 till 1995 and 2001 till 2006.(Brandt and Rawski, Citation2008) One cause of falling NAIRU during 1990–1991 is that government tightly restricted the dismissal of workers. In fact, government regulates some rules in which enterprises could dismiss no more than 1% of their employees each year and they should substitute workers fired from workplace that may cause lower NAIRU in this period.Footnote2 Before the mid-1990s, there was virtually no unemployment. In this sense, the country was fully employing its labour resources, but incurring large inefficiencies in the allocation of workers to specific activities. Aggressive economic restructuring with Chinese government long-delayed plans to diversify ownership of state-owned enterprises and allowing inefficient firms to reduce employment or go bankrupt led to the layoffs of at least 10 million workers by 1997 and 27 million workers from 1998 to 2004 mostly from the state sector which is probably the most influencing in boosting NAIRU through 2001 till 2006. All in all, the most important factor on which this article will be structured upon is the productivity growth far away from special regulation of this country.
Last plot is reflecting Japan in which six distinguishable periods can be recognized to put in order: 1984–1987, 1989 till 1992, 1993 till 1995, 1996 till 1999, 2000 till 2003 and 2007 till 2009. As it can be considered, NAIRU is low approximately in all nominated periods. A starting point in describing this phenomenon is that employment is roughly Social Security(Stiglitz, Citation1997). Benefits run out after a year for long-term workers and much quicker for those with shorter work histories. This helps to prevent the build-up of long-term unemployment. There has been, until recently, high rate of productivity growth as wonderful oiler of the wheels and it makes interesting to see whether Japanese unemployment remains high constantly, as productivity growth abates or vice versa (Micheal and Pannendberg Citation2002).
III. Estimation results
In this section, VAR model is applied to the data of NAIRU and productivity to estimate how they co-move under-studying countries. According to the estimations, VAR results are summarized country-wise:
China:
Productivity = −98.35614 – 27.20475 NAIRUt-1 + 27.20475 NAIRUt-2 + 1.473071 Productivityt-1–403,810 Productivityt-2
NAIRU = 0.337409 + 1.247171 NAIRUt-1–0.485144 NIARUt-2–0.000131 Productityt-1 + 0.000142 Productivityt-2
USA:
Productivity = 436.1384 + 19.11667 NAIRUt-1 + 109.6924 NAIRUt-2 + 1.243586 Productivityt-1–243,032 Productivityt-2
NAIRU = 0.795937 + 1.3855526 NAIRUt-1–0.555803 NIARUt-2 + 0.000218 Productityt-1–0.000224 Productivityt-2
Japan:
Productivity = 5384.347–278.7124 NAIRUt-1 + 151.6626 NAIRUt-2 + 0832774 Productivityt-1 + 0.103158 Productivityt-2
NAIRU = 0.992667 + 1.336980 NAIRUt-1–0.555321 NIARUt-2–0.000412 Productityt-1–0.000442 Productivityt-2
The coefficients of estimation that reflect productivity both in its first and second lag has negative effects on NAIRU. In the presence of productivity shocks in first period, the more recruitment of workers by employers taking place and the higher bargaining power cause the contracts to be binding in higher level of wages(Sheffrin and O’Sullivan, Citation2003). Better compensation of labourers incite the atmosphere of more efficiency in the firms and move productivity curve upward resulting in more decrease in unemployment in the next period. Extending the contract period when reconsidering workers’ recruitment is most wise option taken by the employers. Both expanding working periods and better compensation of labour prohibit NAIRU from more fluctuations in long-run and maintains its stable path.
IV. Granger causality analysis and impulse responses
In this section, we derived Granger causality analysis for the US and Japan. Results for China were not statistically meaningful. According to , when NAIRU is independent variable, the probability is equal to 0.6029 and considering productivity as dependent variable, probability is equal to 0.5096. Values indicate both coefficients are not significant and there is no causality relationship between two mentioned variables based on the US data. But in negligible glance it can be seen that the significance of the NAIRU influences on the productivity as independent variable is more and it can be told that NAIRU is Granger cause of productivity and its fluctuations as positive sign to employers increase their bargaining power and cause more unemployed and lower wages.
Table 1. Granger causality.
For Japan, economy results are more in behalf of Granger relationship than the US and both shocks in productivity and fluctuations in NAIRU will have counter effects on other variable. Due to stable economic policies regarding labour market and long-run safety of workers, minor shocks in productivity means a lot and it keeps unemployment in its lower rate. Oscillating NAIRU’s effect is not as significant as productivity shocks; thus, policies should be more oriented to productivity increase by offering more incentives.
V. Impulse responses application
In order to analyse the shocks hit to NAIRU, the moving average representation of the VAR is applied. This can be obtained by application of Wold’s decomposition theorem.(Haavelmo Citation1944) This theorem states that any zero mean, covariance stationary process can be represented as a moving average sum of deterministic constant (or a constant plus trend), which is a function of time t, and white noise processes which are temporal, cyclical deviations from the trend. Provided the Wold has zero mean covariance and the weights Ai1 of the error term et are square summable, we can formally represent the decomposition theorem as
Where ŋ represents a deterministic constant or a constant plus trend (for the vector xt), and is the white noise process which is considered to represent the temporal, cyclical deviation from trend. The coefficients of matrix
are called the impulse response coefficient associated with the innovations (shocks) et. They describe the propagation of the shocks through the model, and the final effect of the shocks on xt. Responses to an impulse in both productivity and NAIRU can be derived from –.
Figure 1. NAIRU verses productivity.
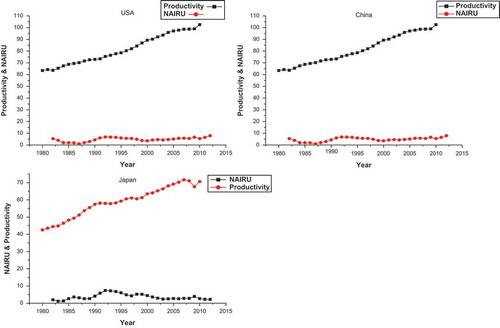
Figure 2. Impulse responses for China.
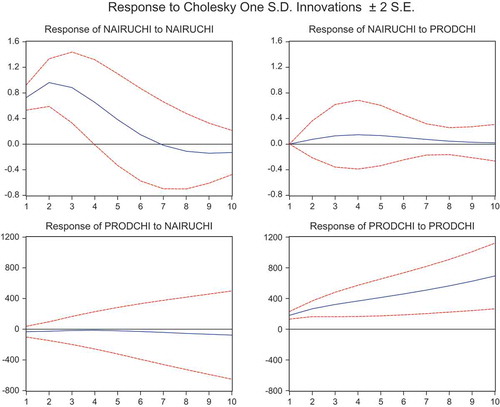
Figure 3. Impulse responses for the US economy.
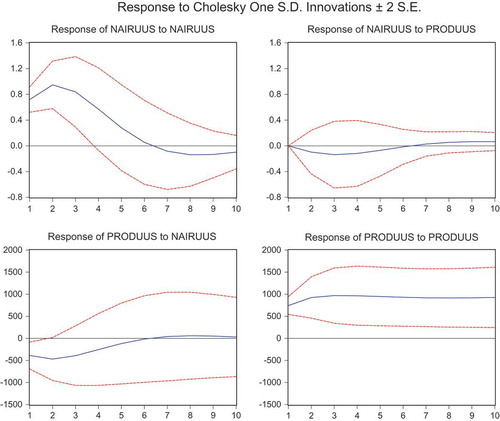
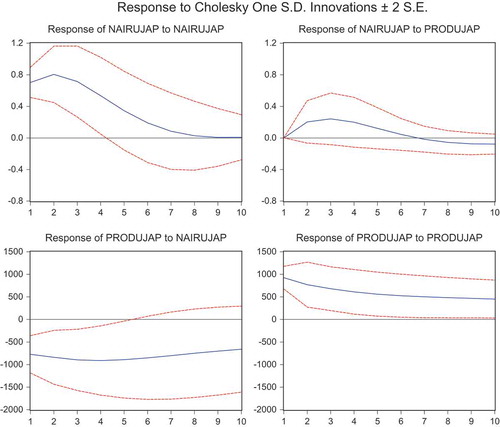
Figure 4. Impulse responses for Japan economy.
As can be seen, response of NAIRU to an impulse to NAIRU is significant and positive in the second period. A shock to unemployment cause positive response of it in up to two periods and increase to the pick of 12%. Increasing unemployment as sign to employers means more unemployed labour supply and more tightness in recruitment policies. The response of NAIRU to a shock in productivity is not significant in all periods. In second row, the responses of labour productivity to an impulse in both productivity and NAIRU are depicted. A 1% shock to NAIRU cause no statistically significant response of productivity in China. With a positive shock to productivity in all periods in future there is positive and significant increase in productivity as a shock will change the expectations of employer resulting in offering more incentives and more enhancement in productivity(Mehta Citation1991).
reflects impulse responses for the US economy. The impulses in productivity does not bring significant responses in the part of NAIRU but the response of productivity to 1% shock in NAIRU is negative and significant in the second period. As it can be seen, results of Granger causality are more supported with impulse responses. A 1% increase in NAIRU in next two periods will give a negative sign to labour as there is possibility of being unemployed and thus in response the level of productivity will move down.
In , impulse responses for Japan economy are reflected. As it can be derived from the plots, response of NAIRU to 1% shock in productivity is not significant. In opposite direction, 1% shock to NAIRU will has negative and significant response for about five periods. Increasing unemployment will bring uncertainty in labours’ view of the future and with constant wages they will be intrigued to lower their productivity mostly via disguised unemployment.
VI. Conclusion
The article is structured to study how productivity and NAIRU are inter-related and a shock in productivity will cause unemployment to which extend. Applying VAR to data of three gigantic economies in the world reflects positive productivity shocks will cause NAIRU as optimum unemployment level to decrease by better bargaining power of workers and more recruitment of firms in labour market. Other side of the analysis is NAIRU fluctuations and its negative effects on productivity. More oscillating NAIRU will bring uncertainty of decisions in labour market and thus household concludes to not supply labour both in terms of physical and disguised unemployment. Besides, minimum incentives offered by demand side (firms) is counter-productivity. The Granger causality analysis approves the results of VAR model and mostly is on behalf of productivity causing NAIRU as dependant variable to change. Policymakers, in order to control shocks and prevent moving of equilibrium unemployment, should regulate labour market in more stable manner and impose policies to guarantee labour safety in the long run.
Disclosure statement
No potential conflict of interest was reported by the authors.
Notes
1 J. Hatton, Timothy, ‘Can Productivity Growth Explain the NAIRU? Long-Run Evidence from Britain, 1871–1999’, Journal of Economica.
2 Forthcoming in Loren Brandt and Thomas Rawski, eds.,
China’s Great Economic Transformation (Cambridge University Press).
References
- Brandt, L., and T. Rawski. 2008. China’s Great Economic Transformation. Cambridge University Press.Oxford.
- Eli’as, J. V. 1993. The Role of Total Productivity on Economic Growth. Estudios de Economía. 20 (3)
- Haavelmo, T. 1944. “The Probability Approach in Econometrics.” Econometrica 12: iii. doi:10.2307/1906935.
- Hatton, J. T. 2007. “CAN Productivity Growth Explain NAIRU? Long-Run Evidence from Britain, 1871-1999.” Econometrica 74: 475–491.
- Komijani, A., and M. Mohebi. 2013. “NAIRU Fluctuations and Economic Growth: Evidences from Developing Countries.” European Journal of Scientific Research 98 (3): 310.
- Mehta, G. 1991. “Existence of a Continuous Utility Function with Path Monotonicity: The Wold Approach.” Economic Theory . 3: 387-392.
- Micheal., B., and M. Pannendberg. 2002. “Unemployment and Productivity Growth, An Empirical Analysis within the Augmented Solow Model.” Economic Modeling 19: 105–120. doi:10.1016/S0264-9993(00)00065-1.
- Mohebi, Mehdi. 2017. “Is Labour Productivity interpretive for fluctuations in NAIRU? Panel-VAR evidence from OECD countries”. International Journal of Contemporary Economics and Administrative Sciences. 7(1-2).
- Mankiw, G., and M. L. Ball. 2002. “NAIRU in Theory and Practice.” Journal of Economic Perspective. 16: 115-136.
- Sheffrin, M. S., and A. O’Sullivan. 2003. Economics: Principles and Tools, 712. Prentice Hall. New Jersey.
- Stiglitz, J. 1997. “Reflection of the Natural Rate Hypothesis.” Journal of Economic Perspective 11 (1): 3–10. doi:10.1257/jep.11.1.3.