
 ?Mathematical formulae have been encoded as MathML and are displayed in this HTML version using MathJax in order to improve their display. Uncheck the box to turn MathJax off. This feature requires Javascript. Click on a formula to zoom.
ABSTRACT
Using a fixed effects panel model on data for 110 countries over the period 2000–2011, we confirm previous findings that financial stability transparency increases the degree of financial stability in a country. However, our results also suggest that financial stability transparency is significantly negatively related to banks’ non-performing loans only with low institutional quality.
I. Introduction
Until recently, central bank transparency about financial stability only received scant attention, unlike central bank communication about monetary policy. However, some recent studies provide evidence that communication about financial stability may enhance financial stability. Born, Ehrmann, and Fratzscher (Citation2014) report that news reflected in Financial Stability Reports (FSRs) reduces market volatility. These effects are particularly strong if FSRs contain optimistic assessments of the risks to financial stability. Čihák et al. (Citation2012) report that high-quality FSRs are associated with higher financial stability, where quality is determined based on the clarity, the coverage of the key risk in the financial system, and the consistency of the FSRs. Finally, Horváth and Vaško (Citation2016) construct a Financial Stability Transparency index (FST-index) and show that this index is positively related to financial stability. This index is comprehensive and focuses not only on the coverage of financial stability reports but also on other communication channels, decision-making procedures and underlying legal aspects. In our view, the FST-index is the best available proxy for financial stability transparency and we therefore use it in our analysis.
We examine whether the relationship between the FST-index and financial stability (proxied by the non-performing loans ratio) is conditioned by institutional quality. Although institutional quality may have a direct impact on financial stability as reported by Das, Quintyn, and Chenard (Citation2004), some recent papers report that the effectiveness of policies aimed at maintaining financial stability is mediated by some proxy for institutional quality (cf. Anginer, Demirgüç-Kunt, and Mare Citation2018).
This paper examines whether the relationship between the FST-index provided by Horváth and Vaško (Citation2016) is conditioned by two widely used proxies for institutional quality, namely the Corruption Perception Index (CPI) provided by Transparency International and the Government Effectiveness (GE) index provided by the World Bank.
The rest of the paper is structured as follows. Section 2 explains the methodology and describes the data used. Section 3 presents the empirical results and section 4 concludes.
II. Method and data
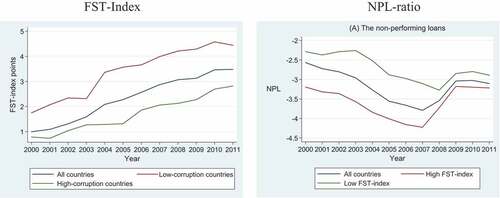
In line with several previous studies (including Horváth and Vaško Citation2016), the log of the ratio of banks’ non-performing loans to total gross loans is used as dependent variable. Data for the non-performing loans ratio comes from the Global Financial Development database of the World Bank. shows that the average non-performing loans ratio decreased in the run-up to the Global Financial Crisis and sharply increased thereafter. The trend for countries with low and high values of the FST-index seems identical, but the level of the non-performing loans ratio differs across these subgroups. also shows the FST index from Horváth and Vaško (Citation2016). The relatively low average of the FST-index reflects that our sample includes many non-OECD countries. The figure also shows that countries which have lower levels of corruption, i.e. a higher institutional quality, are more transparent.
Figure 1. Average non-performing loans ratio and FST-index, 2000–2011.
The following model is estimated:
where Finstabilityit represents Horváth and Vaško (Citation2016) indicator of financial stability transparency for country i in year t. β1 captures the relationship between financial stability transparency and financial stability and β2 shows the direct impact of the quality of institutions on financial stability, while β3 shows the combined impact of financial stability transparency and institutional quality. Cit is a set of country-specific control variables. Following Horváth and Vaško (Citation2016), we include the following country-specific controls in the model: gross domestic product per capita (GDPPC), the growth rate of GDP (GDPG), inflation measured in percentage change of the consumer price index (INFL), the real interest rate change in percentage (REALINT), domestic credit to GDP in percentage (CREDIT), the change of the nominal exchange rate against the U.S. Dollar in percentage (EXCH), stock market capitalization to GDP in percentage (MARKCAP) and financial openness (the sum of foreign assets and liabilities divided by GDP; FINOPEN). Furthermore, Bit is a set of bank-specific controls as proposed by Fazio et al. (Citation2018), namely the ratio of non-interest income to total income in percentage (NONINT) as a proxy for non-traditional activities of banks, banks’ overhead costs to assets ratio (COST) and banking concentration (measured as the total assets of the three largest banks in percentage; CONCEN). Finally, εit represents the error term.
Our measures for institutional quality have been obtained from Transparency International and the World Bank’s World Governance Indicators, respectively. The Corruption Perception Index (CPI) index ranks countries by their perceived levels of corruption (on a scale of 0 to 100, where 100 is very clean). The government effectiveness (GE) index captures perceptions of the quality of public services, i.e. the quality of the civil service and the degree of its independence from political pressures, the quality of policy formulation and implementation, and the credibility of the government’s commitment to such policies. Data for most country-specific control variables have been obtained from the World Bank’s World Development Indicators and Global Financial Development databases.Footnote1 Both proxies have been widely used in the literature as indicators of institutional quality (see, for instance, La Porta et al. Citation1999).
Finally, the non-interest to income ratio (NONINT), bank overhead costs to total cost ratio (COST), and the banking concentration measure (CONCEN) come from the Global Financial Development database.
shows summary statistics.
Table 1. Descriptive statistics of the variables (515 observations).
III. Estimation results
shows our estimation results for the model shown in Equationequation (1)(1)
(1) . Several conclusions can be drawn. First, in line with the results of Horváth and Vaško (Citation2016), our results show that financial stability transparency enhances financial stability as the coefficient on the FST-index is negative and significantly different from zero, except for the estimations shown in column (3). Second, also institutional quality seems to enhance financial stability. A higher score for the CPI index indicates less corruption and its coefficient is negative and significant. This finding is consistent with the results of Das, Quintyn, and Chenard (Citation2004). However, the coefficient on our second proxy for institutional quality, i.e. government effectiveness, is estimated rather imprecisely.
Table 2. The conditional effect of institutional quality on financial stability.
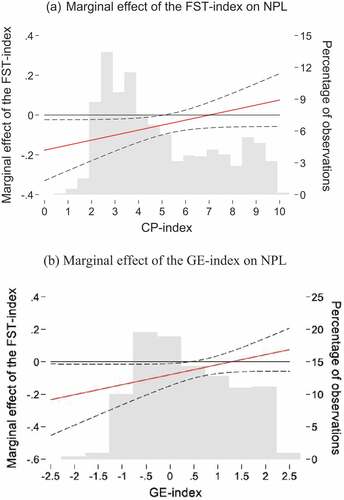
As shown by Brambor, Clark, and Golder (Citation2006), the conditional effect of the FSR-index on the NPL-ratio should not be assessed on the basis of the significance (or lack thereof) of the coefficient on the interaction term. therefore presents the marginal effect of financial stability transparency on our indicator of financial stability for different values of the CP-index, based on the estimates as shown in column (2) of . There is a statistically significant effect of the FST-index on financial stability when the upper and lower bounds of the confidence intervals are both below or above zero. shows a negative marginal effect of the FST-index, which is statistically significant between the range of 0.0 to 5.0 for the CP-index. In contrast, for high values of the CP-index, the marginal effect of the FST-index is statistically insignificant.
shows the marginal effect of financial stability transparency on our indicator of financial stability for different values of the GE-index based on the estimates as shown in column (4) of . The results are quite similar to the results of the marginal effects when the CP-index is used as a measure of the quality of institutions. The marginal effect of the FST-index is negative and significant only for low levels of the GE-index.
Figure 2. Marginal effect of the FST-index on NPL conditional on institutional quality.
IV. Conclusions
Our results suggest that the effect of financial stability transparency on financial stability is conditioned by institutional quality: only with low institutional quality (high level of corruption or low government efficiency) is financial stability transparency significantly negatively related to banks’ non-performing loans.
Disclosure statement
No potential conflict of interest was reported by the authors.
Notes
1 The nominal exchange rate change has been drawn from the IMF’s International Financial Statistics, the measure for financial openness comes from Lane and Milesi-Ferretti (Citation2007).
References
- Anginer, D., A. Demirgüç-Kunt, and D. S. Mare. 2018. “Bank Capital, Institutional Environment and Systemic Stability.” Journal of Financial Stability 37: 97–106. doi:10.1016/j.jfs.2018.06.001.
- Born, B., M. Ehrmann, and M. Fratzscher. 2014. “Central Bank Communication on Financial Stability.” The Economic Journal 124 (577): 701–734. doi:10.1111/ecoj.2014.124.issue-577.
- Brambor, T., W. R. Clark, and M. Golder. 2006. “Understanding Interaction Models: Improving Empirical Analyses.” Political Analysis 14 (1): 63–82. doi:10.1093/pan/mpi014.
- Čihák, M., S. Munoz, S. T. Sharifuddin, and K. Tintchev. 2012. “Financial Stability Reports: What Are They Good For?” IMF Working Paper 12–1. .
- Das, U. S., M. Quintyn, and K. Chenard. 2004. “Does Regulatory Governance Matter for Financial System Stability? an Empirical Analysis.” IMF Working Paper 04/89. doi:10.5089/9781451851311.001.
- Fazio, D. M., T. C. Silva, B. M. Tabak, and D. O. Cajueiro. 2018. “Inflation Targeting and Financial Stability: Does the Quality of Institutions Matter?” Economic Modelling 71: 1–15. doi:10.1016/j.econmod.2017.09.011.
- Horváth, R., and D. Vaško. 2016. “Central Bank Transparency and Financial Stability.” Journal of Financial Stability 22: 45–56. doi:10.1016/j.jfs.2015.12.003.
- La Porta, R., F. Lopez-de-Silanes, A. Shleifer, and R. W. Vishny. 1999. “The Quality of Government.” Journal of Law, Economics, and Organization 15 (1): 222–279. doi:10.1093/jleo/15.1.222.
- Lane, P. R., and G. M. Milesi-Ferretti. 2007. “The External Wealth of Nations Mark II: Revised and Extended Estimates of Foreign Assets and Liabilities, 1970–2004.” Journal of International Economics 73 (2): 223–250. doi:10.1016/j.jinteco.2007.02.003.
