
 ?Mathematical formulae have been encoded as MathML and are displayed in this HTML version using MathJax in order to improve their display. Uncheck the box to turn MathJax off. This feature requires Javascript. Click on a formula to zoom.
ABSTRACT
Battery electric vehicles (BEVs) have gained popularity in Norway, chiefly due to generous tax incentives. Using the synthetic control method, we study if BEVs’ popularity has complemented or substituted for conventional new car sales. Comparing Norway with weighed control units from a donor pool of 16 other European countries between 1990 and 2018 as a counterfactual, we find that conventional new car sales since 2011 have fallen steeply in the country. Analyses also indicate that total new car sales have decreased since 2011. We conclude that BEVs substitute for conventional cars and probably even subtract total new car sales. An implication is that tax revenue loss from BEVs is probably higher than previously estimated, and the fleet of cars in Norway is probably older than in the absence of BEVs’ generous tax incentives.
I. Introduction
Battery electric vehicles (BEVs) have gained popularity in Norway, chiefly due to generous tax incentives. illustrates the trend, and we observe that per capita new car sales of BEVs have taken off since 2011 as compared to conventional new car sales (the difference between the blue and orange line).Footnote1 But have BEVs complemented or substituted for conventional car sales in Norway? By using the synthetic control method, we study this research question. It estimates the magnitude of a unit exposed to an intervention by constructing weighted control units, unexposed to intervention, as a counterfactual (Abadie, Diamond, and Hainmueller Citation2010). The method has been used in numerous studies (e.g. Abadie, Diamond, and Hainmueller Citation2015; Billmeier and Nannicini Citation2013), and we apply it to compare Norway – where BEVs have been exposed to generous tax incentives – with weighed control units from a donor pool of 16 other European countries between 1990 and 2018.Footnote2 Granted, BEVs in other European countries than Norway have been exposed to tax incentives, but to a lesser extent and their relative sales are low (5.39% in the Netherlands in 2018, 2.19% in Denmark in 2015, 2.01% in Sweden in 2018, and all other estimates outside of Norway between 1990 and 2018 are below 2%).Footnote3
Figure 1. Total and total minus BEVs per capita new car sales in Norway
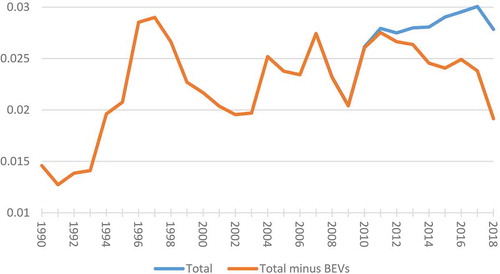
Besides being of academic interest, our study also has an economic interest because due to generous tax incentives concerning BEVs in Norway, and high taxation of conventional cars, BEVs’ popularity represents tax revenue loss, but we have no reasonable estimates of the amount. BEVs can be any vehicle that uses all power from batteries, but they are electric cars in our study. Conventional cars include internal combustion vehicles and hybrid vehicles (hydrogen cars are practically absent in Norway).
II. Methods
Per capita conventional new car sales in Norway in year t are =
+
.
is the effect that the new car sales of BEVs have had on conventional new car sales in Norway in year t, and
is per capita conventional new car sales in year t in Norway in the absence of new car sales of BEVs. That is,
is the counterfactual of per capita conventional new car sales in Norway if new car sales of BEVs were absent.
As the new car sales of BEVs took off in Norway in 2011 and were practically negligible before that, eventually finding that ≈
when t = 2011–2018, shows that BEVs have complemented conventional new car sales (i.e.
≈ 0 as the effect that BEVs have had on conventional new car sales in Norway in year t is practically absent). Eventually finding that
<
when t = 2011–2018 shows that BEVs have substituted for conventional new car sales in Norway (i.e.
< 0 as the effect that BEVs have had on conventional new car sales in Norway in year t is negative).
=
where
represent optimal country weights from our donor pool of 16 other European countries (than Norway), and
is a function of weighted country variables (outside of Norway), which we explain shortly. The best estimate of
is when it is as similar as possible with
when t =1990–2010, i.e. when the sales of BEVs in Norway were practically negligible (cf. Abadie, Diamond, and Hainmueller Citation2010).
To estimate , we use average country variables reported in the left column of (t =1990–2010, except for the latter variable, which we explain in the following).Footnote4 It is common, according to Kaul et al. (Citation2015), to use ‘the entire pre-treatment path of the outcome variable as predictors’ (p. 1), which in our study would imply including per capita conventional new car sales each year between 1990 and 2010 as a country variable to estimate
. However, Kaul et al. warn against it, and following their recommendation, we include per capita conventional new car sales in 2010, i.e. the last year before the new car sales of BEVs took off in Norway, as an additional country variable.
Table 1. Actual and synthetic predictor means and weights concerning per capita conventional new car sales (total cars minus BEVs)
III. Results
presents estimates by using synth and synth_runner (Abadie, Diamond, and Hainmueller Citation2014; Galiani and Quistorff Citation2017) in Stata 15 (Citation2017). The first graph in the left column shows per capita conventional new car sales (total minus BEVs) in the 17 countries and reports Norway in bold. Per capita sales in Norway are relatively low, probably due to the high taxation of conventional cars. Hence, the fleet of cars in Norway is relatively old.
Figure 2. Synth and synth_runner estimates
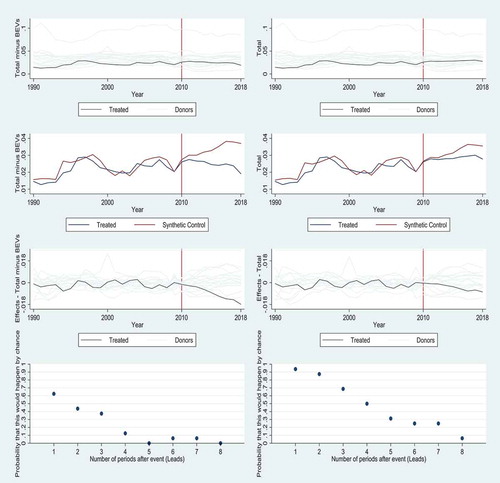
The second graph shows (the blue line labelled ‘Treated’) and
(the red line and labelled ‘Synthetic Control’).Footnote5 Between 1990–2010
≈
, but
<
from 2011. It shows that conventional new car sales since 2011 are lower than in the absence of sales of BEVs. Thus, since 2011, BEVs have substituted for new car sales in Norway. The third graph shows so-called placebo tests of relative deviations by carrying out similar estimates on each of the 17 countries, and we observe that Norway, in bold, since 2011, has a relatively strong decrease in per capita conventional new car sales. Standard significance testing is not plausible when using the synthetic control method, but we instead report in the fourth graph standardized p-values, elaborated by Abadie, Diamond, and Hainmueller (Citation2010). The graph shows that the p-value decreases and reaches roughly zero after five periods (in 2015).
So far, we have studied per capita sales of conventional cars (total cars minus BEVs), but in the right column of and in , we report similar estimates of per capita total car sales. We observe in the right column of that not only per capita conventional car sales have dropped in Norway, but also total car sales. Granted, the effect is less marked and robust as compared to conventional car sales, but according to the fourth graph, it approaches significance after eight periods (in 2018).
Table 2. Actual and synthetic predictor means and weights concerning per capita total new car sales (conventional cars plus BEVs)
IV. Conclusion
Since 2011, BEVs substitute for and probably even subtract conventional new car sales in Norway. A possible reason for the subtraction is that in a period of transition, customers become uncertain concerning whether to choose conventional or new technology (Rosenkoph and Tushman Citation1994). For 2018, the tax revenue loss due to BEVs is reported to be 13.6 billion NOK.Footnote6 However, since total new car sales probably would have been higher in the absence of BEVs, the tax revenue loss is also probably much higher. A further implication is that the fleet of cars in Norway is probably older than in the absence of BEVs’ generous tax incentives.
Correction Statement
This article has been republished with minor changes. These changes do not impact the academic content of the article.
Disclosure statement
No potential conflict of interest was reported by the authors.
Additional information
Funding
Notes
1 To estimate per capita new car sales of BEVs, we divide new car sales of BEVs (source: the European Alternative Fuels Observation) by the midyear estimate of total population (source: the World Bank). To estimate per capita conventional new car sales, we first take a difference between total new passenger car sales (source: the European Automobile Manufacturers Association) and new car sales of BEVs. Next, we divide the difference by the midyear estimate of the total population.
2 The 16 European countries are EU member states from before the extension to Eastern Europe (Austria, Belgium, Denmark, Finland, France, Germany, Greece, Ireland, Italy, Luxembourg, the Netherlands, Portugal, Spain, Sweden, and the UK), plus Switzerland.
3 For all countries, we estimate (per capita) new car sales of BEVs and conventional new car sales as we do for Norway (see Footnote 1).
4 We estimate the average change in the national currency (%) vs. the USD as a ratio of the national currency to the USD in a given year divided by the ratio of the national currency to the USD in the preceding year. OECD is a source of the variable. Also, OECD is a source of the variables average GDP per capita, average GDP per capita growth, and average short-term interest rates. The ILO estimate by the World Bank is a source of the variables average unemployment and the average change in unemployment.
5 We use the nested option to optimize the model fit of (Abadie, Diamond, and Hainmueller Citation2014), and reports the weight of each country variable, the minimized root mean squared prediction error (RMSPE), and the unit weights of included donor countries (Denmark and Greece). also shows variable estimates of Actual and Synthetic Norway, which deviate somewhat, but they are almost identical concerning the variable with the highest weight (per capita new car sales, 2010).
6 https://tv.nrk.no/serie/debatten/201911/NNFA51111219/avspiller.
References
- Abadie, A., A. Diamond, and J. Hainmueller. 2010. “Synthetic Control Methods for Comparative Case Studies: Estimating the Effect of California’s Tobacco Control Program.” Journal of the American Statistical Association 105 (490): 493–505. doi:10.1198/jasa.2009.ap08746.
- Abadie, A., A. Diamond, and J. Hainmueller. 2014. “SYNTH: Stata Module to Implement Synthetic Control Methods for Comparative Case Studies.” https://EconPapers.repec.org/RePEc:boc:bocode:s457334
- Abadie, A., A. Diamond, and J. Hainmueller. 2015. “Comparative Politics and the Synthetic Control Method.” American Journal of Political Science 59 (2): 495–510. doi:10.1111/ajps.12116.
- Billmeier, A., and T. Nannicini. 2013. “Assessing Economic Liberalization Episodes: A Synthetic Control Approach.” Review of Economics and Statistics 95 (3): 983–1001. doi:10.1162/REST_a_00324.
- Galiani, S., and B. Quistorff. 2017. “The Synth_runner Package: Utilities to Automate Synthetic Control Estimation Using Synth.” The Stata Journal 17 (4): 834–849. doi:10.1177/1536867X1801700404.
- Kaul, A., S. Klößner, G. Pfeifer, and M. Schieler. 2015. “Synthetic Control Methods: Never Use All Pre-Intervention Outcomes Together With Covariates.” https://EconPapers.repec.org/RePEc:pra:mprapa:83790
- Rosenkoph, L., and M. Tushman. 1994. “The Coevolution of Technology and Organization.” In Evolutionary Dynamics of Organizations, edited by J. Baum and J. Singh, 403–424. New York: Oxford University Press.
- StataCorp. 2017. Version 15. College Station: TX StataCorp LP.