
 ?Mathematical formulae have been encoded as MathML and are displayed in this HTML version using MathJax in order to improve their display. Uncheck the box to turn MathJax off. This feature requires Javascript. Click on a formula to zoom.
ABSTRACT
This paper evaluates the short-term labour market impact of the COVID-19 containment measures in Germany. By assessing the treatment effect on unemployment via difference-in-difference estimation, we find that 60% of the considerably increased inflows from employment into unemployment in April 2020 were due to the shutdown measures. Disentangling further, we find that the hiring margin accounted for additional 82% of the unemployment effect coming from the separations margin. In sum, the shutdown measures increased unemployment in the short run by 117,000 persons.
KEYWORDS:
I. Introduction
In spring 2020, the coronavirus spread exponentially worldwide and extensive containment measures were taken. Subsequently, unemployment in Germany rose dramatically. Therefore, the question arises how much unemployment has been caused by the containment measures. In this paper, we determine these short-run labour-market effects. First, we use detailed administrative data by sectors to determine the treatment effect on unemployment via difference-in-difference estimations. Second, to disentangle the effects on hirings and separations, methodically we exploit the fact that the containment measures were implemented by the German state governments at different times and not uniformly nationwide. The resulting regional variation allows us to estimate the direct effects on local unemployment flows representing a higher separation and a lower job-finding rate. Thereby, we distinguish between economic shutdowns and curfews using unique data.
We find that 60% of the considerably increased inflows into unemployment in April 2020 were due to the shutdown measures. Furthermore, the hiring margin accounted for additional 82% of the unemployment effect coming from the separations margin. In sum, the shutdown measures increased unemployment in the short run by 117,000 persons.
II. Diff-in-diff with bite
Using data for the inflow of workers from employmentFootnote1 to unemployment by regions (16 federal states) and industries (2-digit level of the Germany industry classification) from the statistics of the Federal Employment Agency, we calculate a separation rate by taking the inflows over the number of workers subject to social security contributions.Footnote2
We use a difference-in-difference approach, distinguishing industries that are treated by the economic closures from the other industries, and apply a special application of this approach by replacing the binary treatment by the ‘bite’. We borrow this procedure from the literature which measures the effects of a nationwide minimum wage on employment (see, for instance, Card (Citation1992) or a recent application from Caliendo et al. (Citation2018)). First, we use assumptions about the degree of closure. Details for the different industries can be found in the Appendix.
While some industries are closed per decree, others were hit by these measures through their linkages to the closed industries. We account for the full extent by generating the change in the gross value added of every industry caused by the closures via their linkages in an input-output table. The percentage loss in the gross value added then gives the ‘bite’ of treatment. Further information on the closure assumptions, the full list of the degrees of closure and the loss in value added including input-output linkages are given in the Appendix.
In the difference-in-difference regression of the separation rate, we control for a comprehensive set of variables which stem from the Establishment History Panel (BHP) (see Ganzer et al. (Citation2020) for a full description of the data). The BHP is a yearly, cross-sectional dataset that contains all the establishments in Germany which have at least one employee liable to social security. We use the BHP wave of 2018 to add information on the average share of certain worker groups in the establishments operating in the industries in the regions, information about the average wage structure and the age of the establishments. Furthermore, we control for the rate of confirmed COVID-19 infections (Robert Koch Institute) on 13 March. We choose this reference date because the inflows are counted between the 13th of March and the 14th of April. To account for differences in the regions (e.g. differences in unemployment) we include a set of region dummies. To account for differences in industries (e.g. export dependency), we include dummies on the 1-digit industry code. The regression is weighted by the number of employees in the regions and industries.
Our estimation equation reads as follows:
where hold the separation rates in region
, industry
at time
.
is a time dummy that takes on the value of 1 in April 2020. As first closure measures came into force on 13 March, and the inflows in April are measured between 13th of March and 14th of April, the time dummy measures the post treatment time span.
is bounded between 0 and
, showing the degree of industry value added affected by the closures. The treatment effect is given by the interaction term of
and
with coefficient
. This interaction measures the treatment effect because of the closure measures.
holds the control variables with coefficient vector
, and
is an error term.
shows the effect of interest. The closure measure increased the inflow into unemployment out of employment by 0.0075 percentage points. A back-of-the-envelope calculation, where we multiply the coefficient by the drop in output and weight this expression with the number of employees in the respective industry sectors, shows that the closure measures increased the unemployment inflow by about 60% (which corresponds to 53,000 people).
Table 1. Diff-in-diff regression of separation rate
The additional inflows from all industries sum to 88,000 in our data. This is a bit lower than the overall number from the statistics of the Federal Employment Agency of 107,000 due to missings in industry classification codes. Applying our result of 60%, we arrive at an unemployment inflow due to the closures of 64,000.
III. Impact channels: inflows and outflows
Currently, by industry, we only can observe the inflows into unemployment but not the outflows from unemployment. However, we are interested to which extent the two channels, namely separations and job findings, contribute to the rise in the unemployment stock. Therefore, we take a deeper look at these two channels using regional variation.
As dependent variables, we use the flows between employment and unemployment for the 156 Employment Agency districts. We consider the change in the seasonally adjusted separation and job-finding rate (outflows from unemployment into employment divided by the stock of unemployment) from March to April 2020.
As explanatory variables, we use the days of economic closures and days of curfews. These were determined via comprehensive research and compiled in a dataset. Since all measures lasted at least until mid-April, the number of days reflect how early the measures came into force regionally. In the Employment Agency districts, usually, it is the decisions of the respective federal states that are relevant. However, in some districts, certain special measures exist. The data on industry closures were researched for the sectors of retail, accommodation, restaurants, bars/clubs, cinemas, trade fairs/events, other education, art/entertainment/recreation and hairdressers/cosmetics, and combined into one closure variable per district by averaging.
Considering the 156 districts, there are on average 26.7 closing days (standard deviation of 0.8). The average for the days of curfews is 21.1 days (standard deviation of 0.9). shows the two variables aggregated at the level of the federal states.
Table 2. Average number of days of economic closures and curfews
We control for the industry composition (2-digit classification again) of the districts via the proportions of employees. The unemployment rate in March 2020 and its change since March 2019 reflect the regional labour market situation. Finally, the regional COVID-19 infection rate is controlled as above. The regression is weighted by the share of employees in the regions and industries.
The regression in shows that the economic closures have an effect of +0.022 on the separation rate, which means that one more closing day represents a regional separation rate that is 0.022 percentage points higher. Extrapolated to the stock of employment in Germany, this would affect 7,400 persons. The curfews variable has an effect of +0.022. Here one day stands for a 0.022 percentage points higher separation rate, or 7,800 persons extrapolated nationwide.
Table 3. Regression of labour market flows on closing days
On the job-finding rate, the variable of economic closures has an effect of −0.191, i.e. one closing day leads to a 0.192 percentage point lower job-finding rate. Recall that this rate is calculated on basis of the stock of unemployment and not as the separation rate, on the stock of employment. Logically, we extrapolate to the stock of unemployment for Germany. Then, 4,400 people would be affected. One additional day of curfews reduces the exit rate by 0.352 percentage points, or 8,100 people extrapolated nationwide.
All together, additional days of economic closure and curfews have effects of a similar magnitude. Both channels operating via separations and new hires are relevant. Sector closures and curfews taken together, the loss of new hires stands for an unemployment effect of an additional 82% of the effect coming from separations (). When we apply this share to the above-mentioned inflow effect of 64,000, this stands for another 53,000 persons.
IV. Robustness
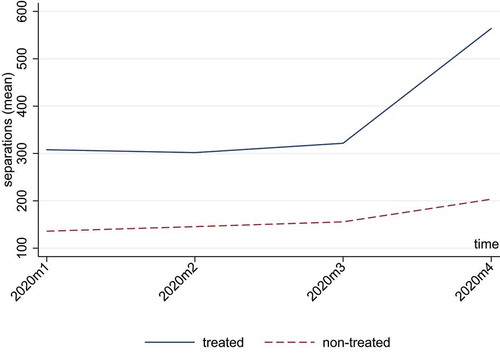
Given the currentness of data, scope for robustness checks is limited to some degree. Besides the diff-in-diff with bite, we performed classical diff-in-diff estimations with a binary treatment indicator that takes on the value one if the degree of closure is above 0 (see Appendix). This regression also delivers statistically significant results. A visual inspection of the common-trends assumption within such a classical diff-in-diff approach is displayed in the Appendix. shows that this assumption is not violated and that the treatment effect did not start but in April 2020. Hence, we are confident that a diff-in-diff approach is suitable in this context. Notwithstanding, it is well known that also this classical approach could potentially suffer from violations of other assumptions. In our version with bite, we dropped April and altered the time period of treatment to be March, in such a regression, the effect of interest is statistically and economically insignificant. In a further robustness check, we alter the loss of value added to be 20 percentage points lower or higher (as far as the upper limit of 100% is not exceeded). shows that the diff-in-diff estimation is robust to such variation.
Figure 1. visual inspection of common-trends assumption
V. Conclusion
We find that in Germany, 60% of the considerably increased inflow into unemployment in April 2020 was due to the shutdown measures. Further, we find that the hiring margin accounted for additional 82% of the unemployment effect coming from the separations margin. Evidently, saving existing jobs, e.g. via short-time work is not enough to prevent a severe labour market drop (Merkl and Weber Citation2020). In sum, the shutdown measures increased unemployment in the short-run by persons (or +0.3 percentage points in the unemployment rate).
When assessing these results, two points should be kept in mind: First, the available data measure effects up to mid-April. However, later effects cannot be ruled out either, for example, with regard to notice periods. Secondly, we consider immediate effects. Without the measures, however, an uncontrolled spread of the virus could possibly have caused much greater damage in the medium run.
Acknowledgments
We thank Maximilian Studtrucker for excellent research assistance.
Disclosure statement
No potential conflict of interest was reported by the authors.
Notes
1 In what follows, employment/employees always refers to employment/employees subject to social security contribution.
2 The flow data is seasonally adjusted using Census X-13. The stock is just available with a lag of 6 months, and represents the average between October 2018 and October 2019.
3 While the automobile industry was not closed by decree, because of its factual shutdown we take it as treated (just as parts of transport.)
References
- Caliendo, M., A. Fedorets, M. Preuss, C. Schröder, and L. Wittbrodt. 2018. “The Short-run Employment Effects of the German Minimum Wage Reform.” Labour Economics 53: 46–62. doi:10.1016/j.labeco.2018.07.002.
- Card, D. 1992. “Using Regional Variation in Wages to Measure the Effects of the Federal Minimum wage.” Industrial & Labor Relations Review 46 (1): 22–37. doi:10.1177/001979399204600103.
- Ganzer, A., L. Schmidtlein, J. Stegmaier, and S. Wolter. 2020. Establishment History Panel 1975–2018. FDZ-Datenreport, 01/2020 (En). Nuremberg. doi:10.5164/IAB.FDZD.2001.en.v1.
- Merkl, C., and E. Weber. 2020. “Rescuing the Labour Market in Times of COVID-19: Don’t Forget New Hires.” VoxEU.org, 7 April.
Appendix
Input-output linkage
We assume that services in the travel sector and services in recreation and sports were closed to 100%. Also, the automobile industryFootnote3 closed fully; however, for Wholesale and retail trade and repair of motor vehicles and motorcycles we set the closure to 50%, approximating the share of trade while garages were still operating. Accommodation and Food and beverage service activities offered is one industry in our classification, and, because restaurants were allowed to offer takeaway service, we assume a closure of this industry of 80%. For Wholesale and Retail trade we assumed 40.5%, as groceries, pharmacies, drug stores and gas stations, which already make up 50% in terms of sales, were still running during lockdown and faced an increase in demand. For Land transport and transport via pipelines, we set the rate to 32.8%, which stands for the majority of passenger services. Libraries, archives, museums and other cultural activities, creative arts and entertainment activities and Gambling and betting activities in sum are closed to 70%, because most of the industries were closed by decree, except gambling. Other personal service activities is assumed to be closed about 58% which corresponds to the share of beauty treatments and hairdressers within the industry. Below 20% of closure was given to the industries of Education, Public administration and defence and compulsory social security, Motion picture, video and television programme production, sound recording and music publishing activities (standing for education beyond the schooling system and cinemas).
Table A1. Inflows to unemployment from employment subject to social security contributions
