

ABSTRACT
We study the spillovers of US real uncertainty and financial uncertainty shocks on Euro area economic activity in an SVAR framework. We find that a rise in US real or financial uncertainty triggers a decline in industrial production and an increase in credit spreads in the Euro area. The adverse effects of financial uncertainty shocks on Euro area industrial production are larger than those stemming from real uncertainty shocks (−0.8% versus −0.4%) due to a larger extent of financial friction. The contribution of US financial uncertainty shocks, vis-à-vis US real uncertainty shocks, to the Euro area is quantitatively more important.
Acknowledgments
We would like to thank the anonymous referee and the Editor Prof. David Peel for helpful comments. The authors acknowledge the financial support from the TUT Development Program 2016-2022, code 2014-2020.4.01.16-0032 as well as the ASTRA Program (European Union, European Regional Development Fund).
Disclosure statement
No potential conflict of interest was reported by the authors.
Robustness Checks
We perform three different robustness checks.
(i) We place uncertainty shocks before the other variables in the vector of the SVAR model. The SVAR is estimated for
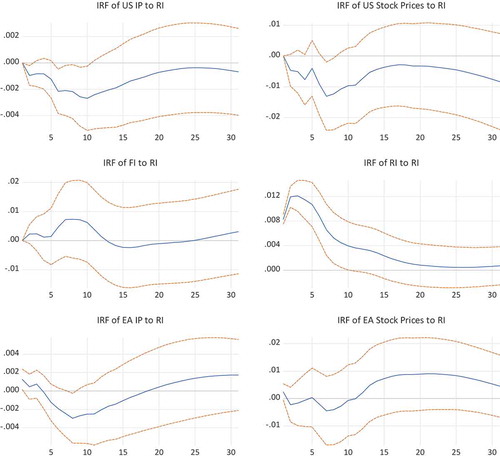
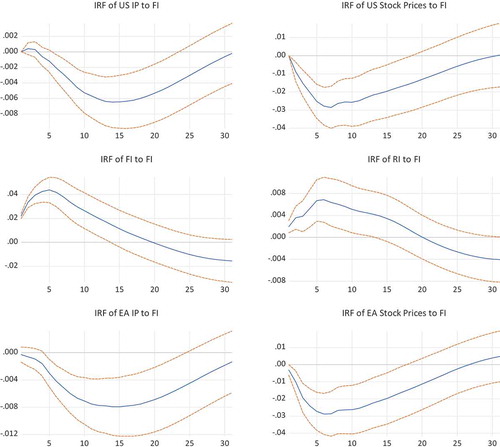
(ii) We use the US and European stock price indices as an alternative measurement of financial frictions. The log of US stock price index is denoted by and the log of European stock price index is denoted by
. The SVAR model is estimated for
.
(iii) We extend the baseline model by including the US consumer price index, the Euro area consumer price index, and the real effective exchange rate for Euro area. The log of consumer price indices for the US and Euro area are denoted by and
, respectively. The log of the real effective exchange rate of the Euro is
. The large SVAR model is estimated for
Regardless of different model specifications, a shock to has a larger impact on the US and Euro area economic activity than a shock to
.
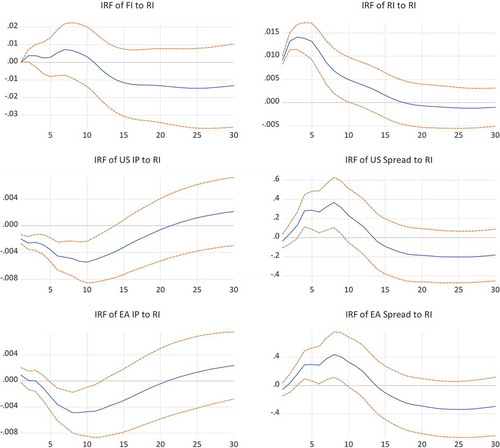
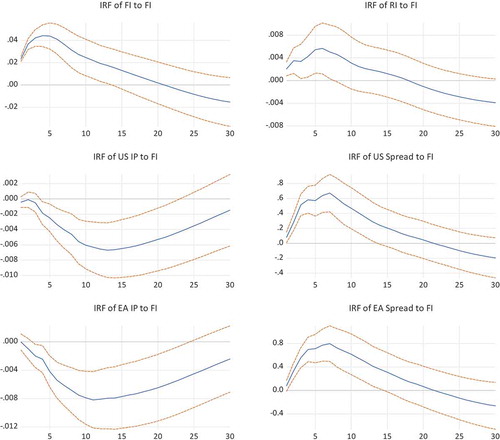
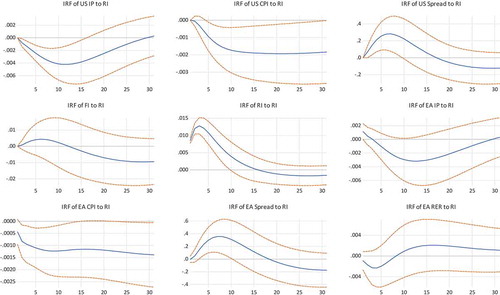
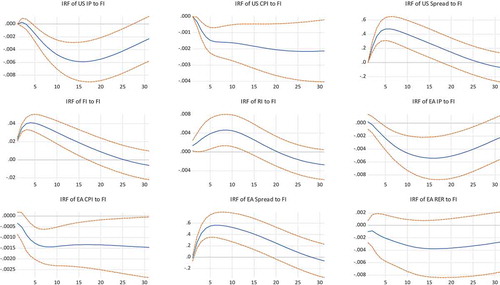
The SVAR model where uncertainty shocks come first.
a) The impact of US real uncertainty shock
The solid lines depict responses of a one standard deviation shock to US real uncertainty, the dotted lines represent the two standard errors confidence bands.
b) The impact of US financial uncertainty shock
The solid lines depict responses of a one standard deviation shock to US financial uncertainty, the dotted lines represent the two standard errors confidence bands.
(ii) The SVAR model with stock price indices
The impact of US real uncertainty shock
The solid lines depict responses of a one standard deviation shock to US real uncertainty, the dotted lines represent the two standard errors confidence bands.
(b) The impact of US financial uncertainty shock
The solid lines depict responses of a one standard deviation shock to US financial uncertainty, the dotted lines represent the two standard errors confidence bands.
(iii) The large SVAR model with consumer price indices and the real exchange rate
The impact of US real uncertainty shock
The solid lines depict responses of a one standard deviation shock to US real uncertainty, the dotted lines represent the two standard errors confidence bands.
The impact of US financial uncertainty shock
The solid lines depict responses of a one standard deviation shock to US financial uncertainty, the dotted lines represent the 2standard errors confidence bands.
Notes
1 The LR test indicates that the optimal lag length is 6.
2 Possible measures such as conventional/unconventional monetary policy, macroprudential policy and fiscal policy may be used to dampen the US spillover effects on the Euro area. Future research could adopt this work in a DSGE framework in order to explicitly formulate the implications of different policies.