
ABSTRACT
Gold has a far-reaching history of ‘safe haven’ or ‘anchor of stability’. However, the epitome of precious metals has recently deviated from its historical price trend. Fluctuations and volatility have increased too. We argue that gold is not subject to bubbles (due to its scarcity in nature), although its price is. By means of a logical-analytical macroeconomic approach combined with statistical and empirical evidence, we prove that there is excess liquidity in the world economy as a whole, which has been increasingly invested in this precious metal. The paper also shows why the gold price could further rise and/or suddenly decrease. Both scenarios would be possible as soon as speculation kicks in.
I. Introduction
Precious metals have been historically safe haven investments during shocks in stock markets (Baur and McDermott Citation2010). According to Mundell (Citation2002), gold’s stability is strongly related to the smallness of annual supply increments and demand changes. However, in the light of the gold price recently skyrocketing, it has been argued that ‘“the ultimate bubble,” has burst’ (Amadeo Citation2020) or that gold might cause a bigger bubble than that of tech stocks (Ashraf Citation2020). Although this trend might not imply a shift in the perception of gold as ‘anchor of stability’ (Tuccille Citation1987) too, it has to be explored whether gold (and its price) might be:
subject to bubbles like other commodities and assets;
and/or affected by inflationary pressures.
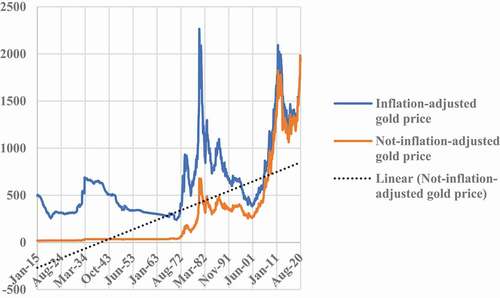
The recent gold price increase has been substantial (i.e. by 21.99%, January – September 2020), has deviated from its typical values and ranges well above its linear trend line (). Even if one curve in is not inflation-adjusted, it is the nominal-terms one to be significant. The focus should not be on the inflation-adjusted gold price, but on the historical evolution of its nominal value. In fact, inflation (if high) distorts the perception of the actual price increase.
Figure 1. Nominal and real gold prices (1915–2020).
Our hypotheses are:
gold is per se not exposed to bubbles because of ‘its limited quantities’ (Dana Citation1866) and intrinsic value;
however, if there is a bubble alias excess liquidity in the banking and financial system and economic times are uncertain while invested funds need to be collateralized against risks, the price of precious metals might be affected. Otherwise stated, ‘if there is no excess liquidity, there would be no bubble phenomena’ (Morita Citation2017).
We demonstrate that there is excess liquidity void of purchasing power because of not being backed by real values (i.e. GDP). The increase of the gold price from 2001 onwards – not coincidentally, in the ‘preparation phase’ of the global financial crisis – reflects the search for stability and is an effect of the bubble increasingly invested in gold.
II. Theoretical framework, materials, methods and discussion
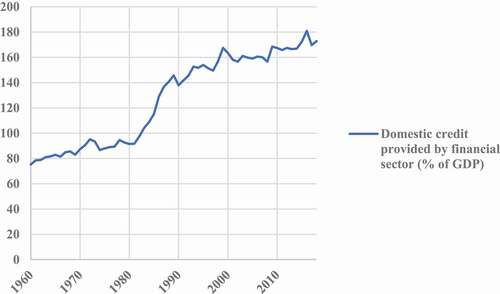
A logical–analytical, macrofounded approach allows to strip down the problem to its essence and to contribute to the analysis of bubbles in asset prices and, specifically, gold which is less studied because of its stability assumption. As described in Beretta (Citation2020), there is excess liquidity fluctuating from one part to another of the world and causing an increase of (nominal) values at the point of arrival and a sudden decrease if withdrawn. An indicator providing a fragmentary idea of the over-lending by the financial sector (although other forms of money creation at the inter-bank level, xeno-currencies, etc., are not considered), is represented by domestic credit provided by the financial sector compared to GDP (). The macroeconomic difference between lending in excess to someone’s disposable resources and GDP in general is that, in the first case, (s)he might not have the resources lent, but the economy as a whole has. In the second one, the amount lent (because of exceeding GDP) cannot be retrieved in the economy.
Figure 2. Worldwide over-lending by the financial sector (1960–2018).
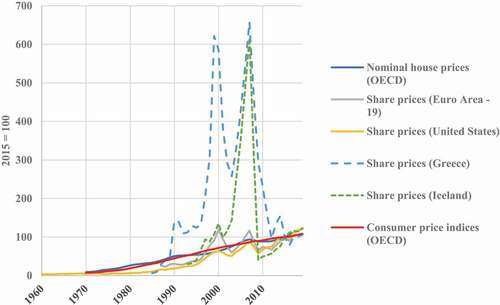
Money – if not backed by current (or future) wealth – has no intrinsic purchasing power (‘without production the concept of money would be empty’ (Cencini Citation2013)). Any excess liquidity is by definition inflationary – the inverse relation is that ‘inflation is always and everywhere a monetary phenomenon’ (Friedman Citation1992) –although it does not anymore display its price-increasing impact on consumer goods for which just a little portion of income is spent in advanced economies. In fact, ‘successful control of Consumer Price Index-inflation […] does not guarantee low asset price inflation’ (Arestis and Karakitsos Citation2004). Instead, in times of low-interest rates, excess liquidity is invested in remunerative markets like the housing and stock one (), as it has happened in the United States, Greece and Iceland. There is no doubt that, ‘[w]hile CPI inflation has been subdued, low interest rates and excess liquidity in the banking system have fueled credit growth and house prices’ (IMF Citation2016).
Figure 3. Price trends in the housing, stock and consumer-goods markets (1960–2019).
In the light of the sudden deviation from gold’s historical price trend (), we claim that a part of this bubble might have been increasingly invested in gold too. Gold has not changed over time, meaning that the ceteris-paribus condition is applicable, nor has its perception of ‘anchor of stability’ or ‘safe haven’ (Lipscomb and Libey Citation1982). In eras of digital payments gold even suffers from the competition of paper money (e.g. a more spendable ‘anchor of stability’). Bank runs in the United Kingdom (2007), Cyprus (2013) and Greece (2015) prove that in emergencies savers want savings turned back into an immediately spendable form. Quite surely, if they should decide (while waiting to withdraw their deposits) between cash and gold, almost anyone would prefer paper money because of being spendable with no delay (e.g. ‘payment finality’ (Committee on Payment and Settlement Systems Citation1992)).
Table 1. World gold supply/demand and price expectations (2007–2019)
This is a crucial point. Hence, on the one hand, gold displays the same stability features as before (Almarzoqi, Mansour, and Krichene Citation2018). On the other, it can be supposed that demand is rising, which confirms that ‘[t]he future value of gold is naturally governed by […] the side of demand rather than […] the side of supply’ (Nature Citation1929). But which kind of demand should be referred to? Since savers are not suddenly buying physical gold en masse, the demanders must be others, namely investors. Typically, subjects investing in precious metals are not ‘physically’ buying bullions, but rather gold futures, options and ETFs, meaning that mainly claims on gold are demanded/offered (Investopedia Citation2020).
If the reader accepts this conclusion, (s)he admits that the gold price is influenced by speculative forces typical of financial markets (where such financial instruments are traded). shows that its price (2007–2019) has deviated from reasonable logic based on demand and supply of physical gold. Even if gold supply is not subject to bubbles because of its scarcity in nature, its price might be. While demand–supply interactions affected by excess liquidity result in volatile movements, without it they are smoother. That gold has plummeted by almost 150 USD/oz from mid of August to September 2020 (Gold Price Citation2020) with no ‘true’ reason should not astonish.
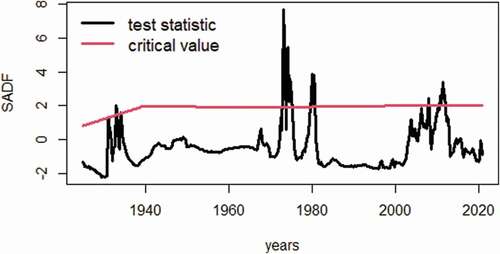
To empirically verify the presence of (inflation-adjusted) gold price bubbles in correspondence of liquidity surpluses, we conduct two statistical tests, following Phillips, Shi, and Yu (Citation2015). We first implement a Generalized Supremum Augmented Dicky-Fuller (GSADF) test to provide evidence on the existence of a price bubble during the period of observation. Then, we run a modified sequential PWY test (Phillips, Wu, and Yu Citation2011) to identify (possibly, multiple) periods of gold price exuberance. The realized value of the GSADF test statistic is 7.70, well beyond any critical value associated with a first-type error probability of 1%, suggesting the clear existence of at least one price bubble in the period. The dating procedure of the sequential PWY test identifies, again at a first-type error probability of 1%, three periods of price bubbles:
1st quarter 1973 − 2nd quarter 1975;
4th quarter 1979 − 4th quarter 1980;
2nd quarter 2010 − 1st quarter 2012.
These periods correspond to times at which Supremum Augmented Dicky-Fuller test statistics are persistently higher than the corresponding critical values (). Emblematically enough, (1) and (2) correspond to the first and second oil crisis while (3) to the spreading of the global economic crisis and kicking in of monetary stimuli. With specific regards to 2020, we cannot exclude a bubble still-to-be-identified at the end of the sample. The pattern of the gold price (), which resembles the peaks identified as bubbles, inductively supports this assumption.
Figure 4. (Inflation-adjusted) gold price bubbles in correspondence of liquidity surpluses (1915–2020).
III. Conclusion
The recent rise in gold price might be of inflationary nature. Although its historical role of ‘safe haven’ is not at risk, gold might temporarily loose its characteristic of stability if it should significantly drop in price. When (and if) it might happen relies on speculative decisions and their erraticness. A precipitous drop in price (i.e. the bubble bursts) as well as a consolidation at high price levels given gold’s historical status (i.e. a ‘special treatment’ compared to other commodities) are both possible.
Acknowledgments
We thank Philip Arestis, Director of Research at the Cambridge Centre for Economic & Public Policy of the University of Cambridge, for his useful and appreciated comments on the paper.
Disclosure statement
No potential conflict of interest was reported by the authors.
References
- Almarzoqi, R. M., W. Mansour, and N. Krichene. 2018. Islamic Macroeconomics. A Model for Efficient Government, Stability and Full Employment. London and New York: Routledge.
- Amadeo, K., 2020. “Gold, “The Ultimate Bubble,” Has Burst.” http://www.thebalance.com/gold-the-ultimate-bubble-has-burst-3970478.
- Arestis, P., and E. Karakitsos. 2004. The Post-bubble US Economy: Implications for Financial Markets and the Economy. Basingstoke, Hampshire, and New York: Palgrave Macmillan.
- Ashraf, A., 2020. “Gold Is Bigger Bubble than Tech, Says $63 Billion Asset Manager.” http://www.bloomberg.com/news/articles/2020-08-26/gold-is-bigger-bubble-than-tech-says-63-billion-asset-manager
- Baur, D., and T. McDermott. 2010. “Is Gold a Safe Haven? International Evidence.” Journal of Banking and Finance 34 (8): 1886–1898. doi:https://doi.org/10.1016/j.jbankfin.2009.12.008.
- Beretta, E. 2020. “The Fourfold Relation between the Essence of Money, Inflation, Bubbles and Debt. A Theoretical Macrofounded Analysis.” Economic Notes – Review of Banking, Finance and Monetary Economics 49 (3): e12166.
- Cencini, A. 2013. Money, Income and Time: A Quantum-theoretical Approach. London and New York: Bloomsbury Academic.
- Committee on Payment and Settlement Systems. 1992. Delivery versus Payment in Securities Settlement Systems. Basel: Bank for International Settlements.
- Dana, W. B., 1866. The Merchants’ Magazine and Commercial Review. William B. Dana.
- Friedman, M. 1992. Money Mischief: Episodes in Monetary History. San Diego, New York and London: Harcourt Brace Jovanovich.
- Gold Price. 2020. “Goldprice.” Est. 2002. http://goldprice.org
- IMF. 2016. Republic of Fiji: 2015 Article IV Consultation-press Release; Staff Report; and Statement by the Executive Director for the Republic of Fiji. Washington, D.C.: IMF.
- Investopedia. 2020. “How to Invest in Gold: An Investors Guide.” http://www.investopedia.com/articles/basics/08/gold-strategies.asp.
- Lipscomb, H. A., and D. R. Libey. 1982. On Gold. Dekalb, Illinois: Waterleaf Press.
- Macrotrends. 2020. “Gold Prices – 100 Year Historical Chart.” http://www.macrotrends.net/1333/historical-gold-prices-100-year-chart
- Morita, K. 2017. Emerging Capital Markets and Transition in Contemporary China. Singapore, Hackensack, New Jersey, and London: World Scientific Publishing.
- Mundell, R. A. 2002. “The Sixth Lord Robbins Memorial Lecture: Reform of the International Monetary System.” In Monetary Stability and Economic Growth: A Dialog between Leading Economists, edited by R. A. Mundell and P. J. Zak, 1–23. Cheltenham and Northampton: Edward Elgar.
- Nature. 1929. “Stability of the Value of Gold.” Nature 124: 670. doi:https://doi.org/10.1038/124670a0.
- OECD, 2020a. “Housing Prices.” http://data.oecd.org/price/housing-prices.htm
- OECD. 2020b. “Inflation (CPI).” http://data.oecd.org/price/inflation-cpi.htm#indicator-chart
- OECD. 2020c. “Share Prices.” http://data.oecd.org/price/share-prices.htm#indicator-chart
- Phillips, P. C. B., S. Shi, and J. Yu. 2015. “Testing for Multiple Bubbles: Historical Episodes of Exuberance and Collapse in the S&P 500.” International Economic Review 56 (4): 1043–1078. doi:https://doi.org/10.1111/iere.12132.
- Phillips, P. C. B., Y. Wu, and J. Yu. 2011. “Explosive Behavior in the 1990s Nasdaq: When Did Exuberance Escalate Asset Values?” International Economic Review 52 (1): 201–226. doi:https://doi.org/10.1111/j.1468-2354.2010.00625.x.
- Refinitiv. 2018. “GFMS Gold Survey 2017.” http://images.financial-risk-solutions.thomsonreuters.info/Web/ThomsonReutersFinancialRisk/%7B7e83d5e5-edae-457b-9bd5-3c54a865079c%7D_GFMS_Gold_Survey_2017.pdf
- Refinitiv. 2019. “GFMS Gold Survey.” Q4 update & outlook. http://images.financial-risk-solutions.thomsonreuters.info/Web/ThomsonReutersFinancialRisk/%7B209bd9ea-5462-4580-8d2b-ce8023bd9a34%7D_GFMS-Gold-Survey-Q4-2018.pdf
- Refinitiv. 2020. “GFMS Gold Survey 2019.” H2 update & outlook. http://images.marketing.refinitiv.com/Web/ThomsonReutersFinancialRisk/%7B08b444af-7357-485a-a6fc-4b2047c237f0%7D_GS19_H2_Update_for_Eikon_compressed.pdf?elqTrackId=105e8a3c0fa648ed9ce9def3e17653e6&elqaid=8538&elqat=2
- Tuccille, J. 1987. Kingdom: The Story of the Hunt Family of Texas. Manchester: PaperJacks.
- World Bank. 2020. “Domestic Credit Provided by Financial Sector (% of GDP).” http://data.worldbank.org/indicator/FS.AST.DOMS.GD.ZS.