
ABSTRACT
People exhibit vast individual variation in the degree to which they choose optimal attentional control strategies during visual search, although it is not well understood what predicts such variation. In the present study, we sought to determine whether markers of real-world achievement (assessed via undergraduate GPA) and cognitive ability (e.g., general fluid intelligence) could predict attentional strategy optimization (assessed via the Adaptive Choice Visual Search task; [Irons, J. L., & Leber, A. B. (2018). Characterizing individual variation in the strategic use of attentional control. Journal of Experimental Psychology: Human Perception and Performance, 44(10), 1637–1654]). Results showed that, while general cognitive ability predicted visual search response time and accuracy, neither achievement nor cognitive ability metrics could predict attentional strategy optimization. Thus, the determinants of attentional strategy remain elusive, and we discuss potential steps to shed light on this important research topic.
Collective wisdom tells us that abilities alone seldom predict performance in life; it is essential that one apply their abilities strategically to achieve desirable behavioural outcomes. How universal is the use of strategy? If a person is strategic in one facet of life, will they also be strategic in others? For present purposes, we seek to understand how individuals control attention; when searching the visual world for targets of interest, why do some people use optimal strategies while others use suboptimal ones (Irons & Leber, Citation2020)? By a unitary account, strategic performance is similar across many tasks, such that the degree to which one uses attention to optimize performance can be predicted by how much they optimize performance at other tasks. By the broadest version of a unitary account, certain trait variables linked to optimizing behaviour in real-world achievement measures, such as academic performance, might predict attentional strategy optimization. Alternatively, strategy may be non-unitary, whereby its use varies across different tasks. In this case, high achievement in real-world measures will not predict attentional strategy usage.
In this paper, we investigate several possible predictors of search strategy optimization. First, we evaluate the degree to which college-level academic performance – a real-world achievement metric – predicts attentional control strategy. Previous research has highlighted the importance of strategy – particularly learning and cognitive regulation strategies – to academic performance (Alexander & Judy, Citation1988; Broadbent, Citation2017; Donker et al., Citation2014). A unitary strategy would therefore predict that those who strategize optimally in attentional control will do the same in their academic studies, and attentional control strategy will correlate with academic outcomes. This association should be even stronger after accounting for other variables that also contribute to academic achievement, such as general intelligence (Laidra et al., Citation2007) or socioeconomic status (Rodriguez-Hernandez et al., Citation2020).
Second, we evaluate how metrics of cognitive ability – relating to general fluid intelligence – might predict strategy. We pursue this latter question for two reasons. First, individuals with greater cognitive ability may find it easier to implement better strategies (Schunn & Reder, Citation2001). Our recent work has failed to find a relationship between other ability metrics (e.g., visual working memory capacity, visual search response time) and attentional strategy (Irons & Leber, Citation2016, Citation2018, Citation2020), so we tested a more domain general metric relating to general fluid intelligence. Second, as mentioned above, real-world achievement metrics like cumulative grade point average (GPA) can be partly explained by cognitive ability (Laidra et al., Citation2007). Therefore, should we find academic achievement to predict attentional strategy, we can assess the degree to which such a relationship is due to cognitive ability.
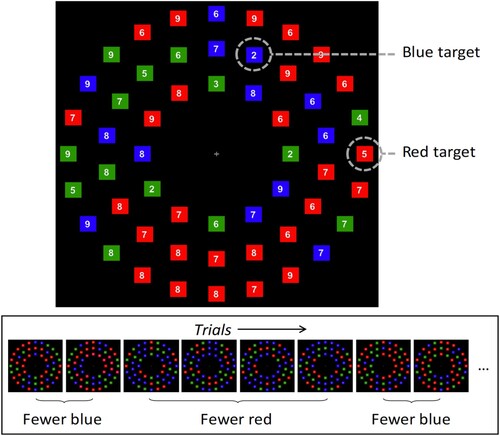
To assess attentional control strategy, we used a procedure designed expressly for this purpose: the Adaptive Choice Visual Search (ACVS; ; Irons & Leber, Citation2016, Citation2018). In the ACVS, participants are presented with displays containing two coloured subsets of squares (e.g., red and blue), each of which contains one target. Additional colour distractors (e.g., green) serve to encourage colour-based search but never contain targets. Participants only have to find one target and can freely choose which one to search for on each trial. Critically, the subsets of coloured squares in the display differ in numerosity, such that the optimal way to find a target is to search through the smaller colour subset. Note that some task factors could work against performance benefits in choosing the optimal target, such as task switching costs and the relative differences in inter-item spacing within colour subsets. However, we have consistently verified that searching the smaller colour subset is indeed the better strategy, as optimality rate is reliably negatively correlated with overall RT (Irons & Leber, Citation2016, Citation2018; Li et al., Citation2021). Because the choice of target is unconstrained, individual choice behaviour can reveal a variety of strategies.
Figure 1. Depiction of the Adaptive Choice Visual Search (ACVS) task (Irons & Leber, Citation2018, Experiment 2).
Top: stimulus from a sample trial, in which the subset of blue squares contains fewer items than the subset of red squares. Searching the smaller subset – blue, in this example – is considered the “optimal” choice, as it yields substantially faster performance. Bottom: Sequence of successive trials, showing that the colour of the smaller subset varies unpredictably, in randomized run lengths of 1–6. Figure reproduced from Irons and Leber (Citation2020).
Although the optimal strategy is fastest, it requires that participants take on additional cognitive demands such as appraising the display, enumerating the subsets, and updating attentional settings when needed (see Hansen et al., Citation2019). Suboptimal strategies, which produce slower reaction times, include searching for the same target colour every time or randomly choosing a colour subset to search on each trial.
Previous work with this paradigm has revealed vast individual differences in the optimality of target choice (Irons & Leber, Citation2016, Citation2018). Moreover, test-retest reliability of strategy choice has been shown to be stable across sessions spaced 1–10 days apart (Irons & Leber, Citation2018), suggesting that strategy use is trait-like (see also Li et al., Citation2021). This reliability thus makes the ACVS suitable for comparison to other trait measures of academic performance and ability.
To assess domain-general cognitive ability, we included a general fluid intelligence measurement (International Cognitive Ability Resource, or ICAR; Condon & Revelle, Citation2014). To assess academic achievement, we collected Introductory Psychology grades and cumulative grade point average (GPA). We also collected a college admissions test score (American College Test, or ACT, Citationn.d.; ACT, Inc.), which has been shown to independently predict both general fluid intelligence and college academic performance (Coyle & Pillow, Citation2008). Finally, while not central to the present aims, we also assessed whether a pencil-and-paper mindfulness assessment, the Mindful Attention Awareness Scale (MAAS; Brown & Ryan, Citation2003) could predict strategy.
If strategy optimization is unitary, real-world measures of academic achievement (e.g., cumulative GPA) should predict the optimality of target choice in the ACVS. However, if strategy is non-unitary, then these two variables will not correlate significantly. Additionally, if cognitive ability predicts attentional strategy optimization, then general fluid intelligence should predict ACVS optimality; alternatively, if ability does not predict strategy optimization, then general fluid intelligence will not relate to ACVS optimality.
Method
Open practices statement
The rationale, method, and analysis plan for this study were preregistered at the Open Science Framework (OSF), after data collection began but before any results were examined (https://osf.io/qcn3p/?view_only=65d01d1752d34ff089b6b96ffed0a00e).
Participants
Data collection occurred during the Autumn semester of 2018, via the undergraduate Research Experience Program at The Ohio State University. All participants were enrolled in Introductory Psychology and participated for course credit. We planned to collect data from a total sample of 100 individuals comprising a single cohort of students taking Introductory Psychology. The planned sample size was based on the expectation of obtaining 85% power to detect a small effect (r = 0.3) and >99% power to detect a medium effect (r = 0.5) (using an alpha criterion of 0.05). We ultimately obtained data from 98 volunteers before the semester ended (43 male, 54 female, 1 non-binary). Rather than resume in the subsequent semester from a different cohort, we chose to stop data collection at this point. Participants were required to be aged 18–40 years old (obtained Mage = 18.85; range: 18–38) and have self-reported normal or corrected-to-normal visual acuity and normal colour vision.
Procedure
All methods were approved by The Ohio State Institutional Review Board. Participants consented (1) to participate in in-lab data collection, and (2) for the researchers to obtain the participants’ academic metrics (GPA, SAT score, ACT score, final grades for each class, and/or major) from the university registrar. They completed the following tasks/surveys, in the order described.
ACVS
Apparatus
All participants completed the task in a sound-attenuated and light-controlled testing room, on a Mac Mini computer with a 24″ Acer LCD monitor. Participants were seated approximately 62 centimeters away from the monitor. Head position was not fixed; reported visual angles of stimuli are based on the typical viewing distance. Stimuli were presented using MATLAB (MathWorks, Natick, MA, USA) with Psychophysics Toolbox extensions (Brainard, Citation1997; Kleiner et al., Citation2007).
Stimuli and procedure
Participants completed 3 blocks of 84 trials of the ACVS task (Irons & Leber, Citation2018, Experiment 2). For every trial, participants saw an array of 54 squares, each sized 1° x 1° (13 red, 13 blue, 14 green and 14 “variable”). The colour of the variable squares was either red or blue on each trial (explained further below). The squares were evenly spaced in three concentric circles around a fixation cross. The inner circle contained 12 squares centred at 6.3° eccentricity, the middle circle contained 18 squares at 9.4° eccentricity, and the outer circle contained 24 squares at 12.4° eccentricity. The colour of each square was selected randomly without replacement from the combined four colour sets defined above.
A white digit was superimposed on the centre of each square, with numbers between 2 and 9 (0.48°; font: Arial). This digit size ensured that participants’ gaze had to be fixated on or near the square to determine the digit identity. In every array, there were two targets: one red square and one blue square. Each target contained a randomly chosen digit among the set of 2, 3, 4, and 5, with the constraint that the red target digit was never the same as the blue one. All other red and blue squares contained a number between 6 and 9. Green squares each contained a digit between 2 and 9, ensuring that participants had to confine their search to red and blue squares, rather than searching solely for digits while ignoring colour. Digits were pseudo-randomly assigned to squares, with constraints that each coloured subset contained approximately the same frequency of each digit (see ).
Participants were informed that both the red and blue targets would always be present but were not instructed of the optimal strategy, rather that they were free to search for and report either target on each trial. They were instructed to report the digit inside either the red or blue target using the V, B, N, and M keys on the keyboard, corresponding to target digits 2, 3, 4, and 5, respectively.
Half of the time the variable distractors were red, meaning there were approximately twice as many red squares as blue squares (27 vs. 13). The other half of the time, the variable distractors were blue, meaning there were approximately twice as many blue squares as red. Finding the target in the smaller coloured-subset is the optimal strategy for this task, since the subset contains the fewest squares through which to search, yielding the fastest performance on the task (Irons & Leber, Citation2016, Citation2018, Citation2020). The colour of the optimal subset changed across successive trials, switching between red and blue every 1–6 trials. The length of each run was randomly chosen (and therefore unpredictable by the participant), but each run length was presented equally often.
At the beginning of each trial, a fixation cross was presented for 1.5s, followed by the search array, which was presented until response. If participants were incorrect, meaning they made a response that did not match either target digit, a 400 Hz auditory tone was played for 150 ms. Next, a 1.5s inter-trial interval was presented. Ten practice trials were completed while the experimenter was present to ensure understanding of the task, followed by three experimental blocks of 84 trials (252 total trials).
Following completion of the main task, participants completed a brief strategy questionnaire that was similar to the one used by Irons and Leber (Citation2018, Experiment 2). These were collected as part of our preregistration plan for the purposes of later exploratory analysis beyond the scope of the present study.
Socioeconomic status (SES). Participants were asked to report, if applicable, their mother’s and/or father’s educational attainment and approximate combined household income. As mentioned in the introduction, our rationale for including this measure was to assess the relationship between academic achievement and visual search strategy, while controlling for SES.
General Fluid Intelligence Assessment. Participants completed the International Cognitive Ability Resource (ICAR; Condon & Revelle, Citation2014; Curran et al., Citation2011). This 16-item assessment included four questions each of three-dimensional rotation, letter and number series, matrix reasoning, and verbal reasoning.
Mindfulness. Participants completed the Mindfulness Attention Awareness Scale (MAAS; Brown & Ryan, Citation2003).
Academic Measures. Several measures of academic performance and aptitude – if available – were retrieved from the University Registrar during the Autumn 2019 academic semester, one year following completion of the main experiment. These included participants’ Cumulative Grade Point Average (GPA), Introduction to Psychology final grade, American College Test (ACT) score, and Scholastic Aptitude Test (SAT) score. While not intended for inclusion in our analysis, the registrar provided additional transcript information, such as students’ undergraduate majors. Additionally, while we only preregistered one wave of collecting registrar data, we were able to obtain a second cumulative GPA measurement one year after initial collection of academic data, following the Autumn 2020 semester.
Results
We excluded two measurements from our analysis, as follows: First, based on academic records, 69 participants had ACT scores and 33 had SAT scores. Given the similarity between tests and that so few took the latter, we opted to analyze only the ACT. Second, only 32 participants completed the SES questions. Therefore, despite our preregistered plan, we felt it necessary to exclude SES from all analyses, as it would have severely limited statistical power.
Participants were excluded for withdrawing before completing any survey measures (n = 1), computer malfunctioning (n = 1), being non-naïve to the task (n = 1), and accuracy greater than three standard deviations below the sample mean (n = 2). Of the 98 participants from whom data was collected, this resulted in an analyzed sample of 93 participants (40 male, 52 female, 1 non-binary).
For each measure, individuals were classified as univariate outliers and their respective measures were excluded if the absolute value of the z-score exceeded 3.29, p < .001 (n = 1, for the GPA measure).
All statistical tests were two-tailed and compared against an alpha criterion of 0.05. The Holm–Bonferroni method was used to correct for multiple comparisons (denoted as pHB) (Holm, Citation1979).
ACVS performance
For each participant, trials with incorrect responses and trials with response times (RTs) that were less than 300 ms or more than three standard deviations above the individual’s mean were excluded from RT analysis (3.52% of trials).
All main descriptive statistics were similar to what has previously been reported (Irons & Leber, Citation2018, Experiment 2): accuracy (M = 98.3%; range: 93.3–100.0%), RT (M = 3328 ms; range: 2192–5313 ms), proportion of optimal choices (M = 64.5%; range: 30.0–98.8%) and rate of switching (M = 28.6%; range: 0.0–50.2%). We also estimated internal consistency for proportion of optimal choices; we used the method of Susilo et al. (Citation2010), by calculating and averaging 50 random splits of the data and applying a Spearman-Bowman correction. This yielded a mean split-half reliability of r = .974.
Other measures
Total observations, mean, and SD for all other included dependent measures are reported in the first four columns of . Note that total observations for some variables were less than the overall sample size, as follows: Intro Psych Grade: several participants were enrolled in an honours section, and we chose to exclude these data points due to inherent differences in the course rigour, resulting in a sample of 88 individuals. ACT: the registrar reported this test score for 69 individuals. Cumulative GPA (2nd collection): we obtained the second wave of GPA data for 77 participants, as some were no longer enrolled (i.e., they graduated or withdrew). Additionally, for each correlation, multivariate outliers were defined by a Mahalanobis distance that exceeded 13.82, p < .001 (n = 0). Pairwise deletion was used for any missing data or incomplete surveys.
Table 1. ACVS descriptive statistics.
Predicting ACVS performance
As described above, our main measure of attentional strategy was the proportion of optimal choices, or optimality. Thus, the critical analyses were to assess whether optimality was predicted by academic performance and cognitive ability scores. We also explored whether these measures could predict the other ACVS metrics, including accuracy, RT, and frequency of switches. Pearson’s correlation coefficients were computed to assess pairwise associations between these measures, followed by t-tests to determine if the correlations were significantly different from zero. Correlation coefficients (Pearson’s r), and uncorrected and corrected (Holm, Citation1979) p-values are reported in the last four columns of .
Note that in our preregistration, we initially planned hierarchical regressions to analyze the individual contributions of academic performance, SES, and intelligence metrics, in predicting optimality and frequency of switching. However, as results show below, the lack of significant correlations – as well as insufficient SES data – obviated the utility of these regressions, so we omitted them.
Academic Performance. For Cumulative GPA (both AU19 and AU20) and Intro to Psychology grade, we found no significant relationship with any of the ACVS measures ().
General Fluid Intelligence. ICAR score did not predict the ACVS strategy metrics of optimality or frequency of switching; however, ICAR was significantly correlated with ACVS RT ().
College Entrance Exam. ACT score did not predict the ACVS strategy metrics of optimality or frequency of switching. However, it did significantly predict ACVS Accuracy and RT ().
Mindfulness. MAAS scores did not correlate significantly with any ACVS performance metrics of interest (see ).
Complete Reporting of Pairwise Correlations. Beyond the planned pairwise correlations analyzed, we present, for completeness, all pairwise correlation coefficients, with uncorrected p-values, in .
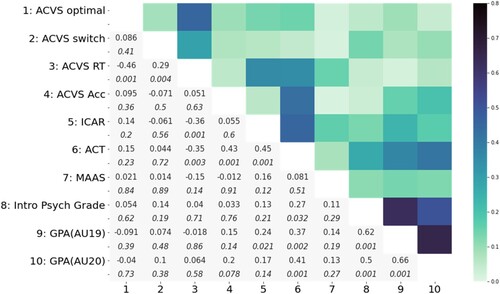
Figure 2. Correlation matrix: ACVS and survey metrics.
Note: Complete correlation matrix of comparisons of the ACVS and survey metrics. Pearson’s r and uncorrected p-values (denoted in italics) are shown below the diagonal. Graphical depiction of Pearson’s r coefficients, in absolute values, above the diagonal. Note that Intro Psych Grade, GPA(AU19), and GPA(AU20) are not independent, as they are calculated based on some degree of shared data.
Discussion
Is a person’s strategy optimization unitary, or similar, across multiple tasks and settings? In particular, we questioned whether real world achievement, as assessed by academic performance, could predict the optimization of strategy in the ACVS. We found no evidence to support this unitary account, since neither cumulative GPA (measured over two years) nor Intro Psychology grade predicted strategy optimization on the ACVS. The failure to predict attentional strategy from real-world achievement metrics is consistent with the non-unitary account of strategy usage.
We also investigated whether cognitive ability predicts attentional strategy optimization, and results found no relationship between ICAR and ACVS strategy measures. ACT, which has been previously shown to relate to both general fluid intelligence and academic performance (Coyle & Pillow, Citation2008), also failed to predict ACVS strategy metrics. However, we did find that ACT and ICAR measures could predict RT, and ACT predicted task accuracy. These results are consistent with previous work showing that visual search RT and accuracy are well-predicted by multiple ability-related metrics (Cowan et al., Citation2005; Kane et al., Citation2001; Miyake et al., Citation2000). These results also fit parsimoniously with our recent findings that working memory capacity and visual search RT did not predict ACVS optimality (Irons & Leber, Citation2016, Citation2020). Taken together, the present data are consistent with our recent proposal that cognitive ability and attentional strategy are distinct from one another (Irons & Leber, Citation2020).
We had to abandon our plan to account for SES when assessing the relationship between academic performance and search strategy. However, given that we did not observe a relationship between GPA and ACVS metrics, the lack of SES data presents less of a problem for interpreting the results.
Non-unitary nature of attentional strategy optimization
Overall, we reject a broad version of the unitary account of attentional strategy. That is, a single trait variable does not span levels of a putative hierarchy to determine optimization for both high-level life achievement and task-specific strategy. These results do not, however, address whether more limited versions of unitarity of strategy exist – for instance, across a set of lower-level cognitive tasks. Recent work by Clarke et al. (Citation2022), which was run at the same time as the present study, produced evidence against this more limited form of unitarity. In that study, the authors compared three attentional strategy measures: ACVS, Mouse Click Foraging (Kristjánsson et al., Citation2014), and the Split Half Line Segment task (Nowakowska et al., Citation2017). While each of the tasks showed good test-retest reliability, none were reliably correlated with one another. Specifically, strategy optimization in one attentional task need not predict optimization in other tasks, supporting a non-unitary account of strategy. Had we known the results of Clarke et al. when beginning the present study, we reasonably could have predicted from the outset that academic performance was unlikely to relate to ACVS optimality.
Taking our work and the work of Clarke et al. together, we have scant evidence for a unitary “optimality trait,” either across or within levels of a strategy hierarchy. We instead presume that strategy use – which can be highly consistent and trait-like within individual tasks – is largely task-specific, or non-unitary (see also Irons & Leber, Citation2020; Li et al., Citation2021).
Understanding the drive to optimize performance is a vital undertaking and is likely to predict a great deal of variance in real-world attentional performance. It is thus essential to fully characterize strategy optimization across a variety of task settings. However, the seemingly heterogeneous nature of strategy use poses a great challenge to this enterprise. That is, rather than obtaining a single trait variable measurement, we apparently need to measure a whole assortment of variables to understand optimizing behaviour across all strategy-related tasks.
Additional work also needs to be carried out to explain what factors drive strategy optimization in various tasks. For instance, people’s propensity to optimize could be linked to both their metacognitive knowledge of what the possible strategies are, and which ones produce the best performance. In the ACVS, participants tend to have high metacognitive knowledge of their chosen strategy (Irons & Leber, Citation2016, Citation2018), but we have yet to measure whether they know whether they are using the optimal strategy. It is possible that the variation in optimization across tasks reflects variation in knowledge of the optimal strategy. Alternatively, individuals may know the optimal strategy but seek to avoid the subjective cognitive effort required to implement this strategy (Irons & Leber, Citation2018, Citation2020). One possible way to disentangle these two options would be to instruct participants about the optimal strategy for all tasks and measure whether across-task correlations in strategy emerge.
Relationship between ability and strategy
We have previously drawn a distinction between cognitive abilities and attentional strategies, offering evidence that no ability metric – of many that we have measured – can predict ACVS optimality (Irons & Leber, Citation2020). Such results stand in contrast to adaptive strategy optimization in more abstract cognitive tasks (e.g., arithmetic problems using the Building Sticks Task; see Schunn & Reder, Citation1998). Yet, given that strategy optimization appears to be so heterogeneous across multiple attentional tasks, it was perhaps predictable that the kinds of ability metrics we have measured would not predict optimality. That is, measures of general fluid intelligence, working memory capacity, and processing speed are all related to one another and are thus to some degree task-general metrics (Cowan et al., Citation2005; Kane et al., Citation2001; Miyake et al., Citation2000); thus, we may have predicted that a task-general measure should predict either many/all attentional strategy tasks or few/none.
A potentially more fruitful approach might be to isolate ability metrics that can be linked to individual tasks – or a subset of tasks. For instance, we have found the process of enumerating the colour subsets to find the smaller set to be critical for optimal performance in the ACVS (Hansen et al., Citation2019), although such a function is not essential to other strategy tasks (Li et al., Citation2021). It stands to reason that one’s ability to enumerate might predict ACVS optimality. We have begun to investigate this hypothesis, although our results thus far have not supported it (McKinney et al., Citation2021; Zhang et al., Citation2021).
Note that our investigation of the potential relationship – or lack thereof – between ability and attentional strategy has been somewhat narrow in scope; we must acknowledge that clinically significant limitations in cognitive or perceptual capacities (e.g., colour deficiency) could predict poor strategy optimization.
Conclusions
Overall, while our results were clear, we have unfortunately not uncovered any predictors of attentional strategy optimization. If real world achievement and cognitive ability do not predict attentional strategy (as found in the present study) – and, if strategy at one task does not predict strategy at another (as found by Clarke et al., Citation2022) – then what does? We have speculated that subjective cognitive effort plays a key role (Irons & Leber, Citation2018, Citation2020), and we believe that further investigation in this vein may provide some answers. To conclude, we emphasize that the pursuit toward understanding strategy optimization remains an intriguing challenge and is essential for helping us to understand how and why individuals use their attentional capacities in everyday settings.
Acknowledgements
We thank Yoolim Hong, Paul Scotti, and Lisa Heisterberg for valuable comments and suggestions, and we thank Kate Friess, Needa Toofany, Eric Reinhart, Dana Shaw, Elliot Ping, Walden Li, Ben Dominguez, and Zoe Zhang for assistance with data collection.
Disclosure statement
No potential conflict of interest was reported by the author(s).
Additional information
Funding
References
- ACT. (n.d.). American College Testing. ACT, Inc. https://www.act.org/content/act/en.html
- Alexander, P. A., & Judy, J. E. (1988). The interaction of domain-specific and strategic knowledge in academic performance. Review of Educational Research, 58(4), 375–404. https://doi.org/10.3102/00346543058004375
- Brainard, D. H. (1997). The psychophysics toolbox. Spatial Vision, 10(4), 433–436. https://doi.org/10.1163/156856897X00357
- Broadbent, J. (2017). Comparing online and blended learner's self-regulated learning strategies and academic performance. The Internet and Higher Education, 33, 24–32. https://doi.org/10.1016/j.iheduc.2017.01.004
- Brown, K. W., & Ryan, R. M. (2003). The benefits of being present: Mindfulness and its role in psychological well-being. Journal of Personality and Social Psychology, 84(4), 822–848. https://doi.org/10.1037/0022-3514.84.4.822
- Clarke, A. D. F., Irons, J. L., James, W., Leber, A. B., & Hunt, A. R. (2022). Stable individual differences in strategies within, but not between, visual search tasks. Quarterly Journal of Experimental Psychology, 75(2), 289–296. https://doi.org/10.1177/1747021820929190
- Condon, D. M., & Revelle, W. (2014). The International Cognitive Ability Resource: Development and initial validation of a public-domain measure. Intelligence, 43, 52–64. https://doi.org/10.1016/j.intell.2014.01.004
- Cowan, N., Elliott, E. M., Scott Saults, J., Morey, C. C., Mattox, S., Hismjatullina, A., & Conway, A. R. A. (2005). On the capacity of attention: Its estimation and its role in working memory and cognitive aptitudes. Cognitive Psychology, 51(1), 42–100. https://doi.org/10.1016/j.cogpsych.2004.12.001
- Coyle, T. R., & Pillow, D. R. (2008). SAT and ACT predict college GPA after removing g. Intelligence, 36(6), 719–729. https://doi.org/10.1016/j.intell.2008.05.001
- Curran, V., Hollett, A., Casimiro, L. M., Mccarthy, P., Banfield, V., Hall, P., Lackie, K., Oandasan, I., Simmons, B., & Wagner, S. (2011). Development and validation of the Interprofessional Collaborator Assessment Rubric ((ICAR)). Journal of Interprofessional Care, 25(5), 339–344. https://doi.org/10.3109/13561820.2011.589542
- Donker, A. S., De Boer, H., Kostons, D., Van Ewijk, C. D., & van der Werf, M. P. (2014). Effectiveness of learning strategy instruction on academic performance: A meta-analysis. Educational Research Review, 11, 1–26. https://doi.org/10.1016/j.edurev.2013.11.002
- Hansen, H. A., Irons, J. L., & Leber, A. B. (2019). Taking stock: The role of environmental appraisal in the strategic use of attentional control, Attention, Perception, & Psychophysics, 81(8), 2673–2684. https://doi.org/10.3758/s13414-019-01769-6
- Holm, S. (1979). A simple sequentially rejective multiple test procedure. Scandinavian Journal of Statistics, 65–70.
- Irons, J. L., & Leber, A. B. (2016). Choosing attentional control settings in a dynamically changing environment, Attention, Perception, & Psychophysics, 78(7), 2031–2048. https://doi.org/10.3758/s13414-016-1125-4
- Irons, J. L., & Leber, A. B. (2018). Characterizing individual variation in the strategic use of attentional control. Journal of Experimental Psychology: Human Perception and Performance, 44(10), 1637–1654. https://doi.org/10.1037/xhp0000560
- Irons, J. L., & Leber, A. B. (2020). Developing an individual profile of attentional control strategy. Current Directions in Psychological Science, 29(4), 364–371. https://doi.org/10.1177/0963721420924018
- Kane, M. J., Bleckley, M. K., Conway, A. R., & Engle, R. W. (2001). A controlled-attention view of working-memory capacity. Journal of Experimental Psychology: General, 130(2), 169–183. https://doi.org/10.1037/0096-3445.130.2.169
- Kleiner, M., Brainard, D., Pelli, D., Ingling, A., Murray, R., & Broussard, C. (2007). What’s new in Psychtoolbox-3? Perception, 36(ECVP Abstract Suppl.).
- Kristjánsson, Á., Jóhannesson, Ó. I., & Thornton, I. M. (2014). Common attentional constraints in visual foraging. PLoS ONE, 9(6), e100752. https://doi.org/10.1371/journal.pone.0100752
- Laidra, K., Pullmann, H., & Allik, J. (2007). Personality and intelligence as predictors of academic achievement: A cross-sectional study from elementary to secondary school. Personality and Individual Differences, 42(3), 441–451. https://doi.org/10.1016/j.paid.2006.08.001
- Li, W. Y., McKinney, M. R., Irons, J., & Leber, A. B. (2021). Generalization of attentional control strategies across distinct tasks. Experimental Psychology: Human Perception and Performance. https://doi.org/10.31234/osf.io/jvube
- McKinney, M. R., Zhang, T., Leber, A. B. (2021, November). Further evidence of a divergence between cognitive ability and attentional control strategy. Poster presented at the Annual Object Perception, Attention, & Memory Conference. http://www.opam.net/
- Miyake, A., Friedman, N. P., Emerson, M. J., Witzki, A. H., Howerter, A., & Wager, T. D. (2000). The unity and diversity of executive functions and their contributions to complex “frontal lobe” tasks: A latent variable analysis. Cognitive Psychology, 41(1), 49–100. https://doi.org/10.1006/cogp.1999.0734
- Nowakowska, A., Clarke, A. D., & Hunt, A. R. (2017). Human visual search behaviour is far from ideal. Proceedings of the Royal Society B: Biological Sciences, 284(1849), 20162767. https://doi.org/10.1098/rspb.2016.2767
- Rodriguez-Hernandez, C. F., Cascallar, E., & Kyndt, E. (2020). Socio-economic status and academic performance in higher education: A systematic review. Educational Research Review, 29, 100305. https://doi.org/10.1016/j.edurev.2019.100305
- Schunn, C. D., & Reder, L. M. (1998). Strategy adaptivity and individual differences. Psychology of Learning and Motivation, 38, 115–154. https://doi.org/10.1016/S0079-7421(08)60185-1
- Schunn, C. D., & Reder, L. M. (2001). Another source of individual differences: Strategy adaptivity to changing rates of success. Journal of Experimental Psychology: General, 130(1), 59–76. https://doi.org/10.1037/0096-3445.130.1.59
- Susilo, T., McKone, E., Dennett, H., Darke, H., Palermo, R., Hall, A., Pidcock, M., Dawel, A., Jeffery, L., Wilson, C. E., & Rhodes, G. (2010). Face recognition impairments despite normal holistic processing and face space coding: Evidence from a case of developmental prosopagnosia. Cognitive Neuropsychology, 27(8), 636–664. https://doi.org/10.1080/02643294.2011.613372
- Zhang, T. McKinney, M. R., Leber, A. B. (2021, November). Attentional strategy and effort avoidance: The role of display enumeration. Poster presented at the Annual Object Perception, Attention, & Memory Conference. http://www.opam.net/