
Abstract
Financial data science and econometrics are highly complementary. They share an equivalent research process with the former’s intellectual point of departure being statistical inference and the latter’s being the data sets themselves. Two challenges arise, however, from digitalisation. First, the ever-increasing computational power allows researchers to experiment with an extremely large number of generated test subjects (i.e. p-hacking). We argue that p-hacking can be mitigated through adjustments for multiple hypothesis testing where appropriate. However, it can only truly be addressed via a strong focus on integrity (e.g. pre-registration, actual out-of-sample periods). Second, the extremely large number of observations available in big data set provides magnitudes of statistical power at which common statistical significance levels are barely relevant. This challenge can be addressed twofold. First, researchers can use more stringent statistical significance levels such as 0.1% and 0.5% instead of 1% and 5%, respectively. Second, and more importantly, researchers can use criteria such as economic significance, economic relevance and statistical relevance to assess the robustness of statistically significant coefficients. Especially statistical relevance seems crucial, as it appears far from impossible for an individual coefficient to be considered statistically significant when its actual statistical relevance (i.e. incremental explanatory power) is extremely small.
Introduction
‘Good with numbers? Fascinated by data? The sound you hear is opportunity knocking’. These were the words of the New York Times when it announced ‘the Age of Big Data’ on 11 February 2012.Footnote1 According to Version 6.0 of the Data Never Sleeps report, nowadays it takes less than 3 min for a million tweets to be published, less than 20 s for a million Google searches to be conducted and less than four seconds for The Weather Channel to receive 1 million forecast requests.Footnote2
How do econometricians react to this newly found abundance in data? Some celebrate ‘the triumph of the empiricists’ and announce ‘the birth of financial data science’ (Simonian and Fabozzi Citation2019, 10), while others warn of p-hacking – the process of arriving at superficially attractive and selective p-values through multiple hypothesis testing, whereby multiple may well mean millions or more (Chordia, Goyal, and Saretto Citation2017). While such data mining has probably always occurred in academic and professional finance research and similarly always found its critics, it has become much more attractive, more rewarding, and likewise much more dangerous in the age of big data. Even Harry Markowitz himself recently commented on the issue of data mining in the age of big data, stating with his co-authors Arnott and Harvey (AHM in the following):
‘We are all data miners, even if only by living through a particular history that shapes our beliefs’
(Arnott, Harvey, and Markowitz Citation2019, 64)
Viewing data mining as an inevitable aspect of being an empirical financial researcher in line with AHM appears pragmatic and sensible. Yet, it implicitly cries out for much more academic research into the analytical measurement opportunities, statistical methods, and new financial products arising in and from the age of big data as well as the research process and researcher integrity needed to achieve robust conclusions. Furthermore, research on big data in finance needs to be connected with all the knowledge already in place, most notably in the area of financial econometrics. Consequently, in this paper, we explore the degree to which the newly emerging financial version of the scientific enquiry into big data is complementary to econometrics and we discuss the opportunities and challenges that arise from the birth of this new research paradigm, which we call ‘Financial Data Science’.Footnote3
Defining financial data science
‘[E]conometrics is measurement in economics … [and] financial econometrics will [consequently] be defined as the application of statistical techniques to problems in finance’ (Brooks Citation2002, 1). While the definition of econometrics is well established, embodying the process of measurement and ‘model-based statistical inference’ (Campbell, Lo, and MacKinlay Citation1997, 3), formal definitions of financial data science are yet to emerge. To provide such a formal definition of financial data science, we contrast it with econometrics before subsequently discussing the complementary nature of the two fields.
Financial data science differs from econometrics in its intellectual point of departure, its process and its ambitions. While econometrics’ intellectual point of departure is statistical inference (i.e. the process), financial data scientists share a common interest in the data sets whose exploration and explanation can advance financial decision making (i.e. the ingredients). Despite the unstoppable move to big data, the availability of high quality (i.e. trustworthy) data sets remains the key practical constraint for the empirical researcher. Consequently, the desire to explain human behaviour through the exploration and critical assessment of new data sets is the common intellectual desire which unites financial data scientists whose statistical techniques can vary from the probabilistic regression models of financial economists to the neural network-based classification models of computer scientists.
To provide researchers with the best odds of explaining human behaviour with ever-increasing data sets, financial data science is inevitably interdisciplinary. In other words, the expertise and skills needed to insightfully extract information from unstructured data, to efficiently process several big datasets, and to design and execute effective statistical analysis, are so plentiful that it normally requires a financial econometrician, a computer scientist and an individual with deep knowledge about financial markets to design a competitive financial data science process. While two researchers maybe able to cover these three required skillsets, it is extremely rare that a given individual truly possesses all three. Consequently, financial data science is inevitably teamwork. To maintain a good interdisciplinary team spirit, it is paramount that no member of single discipline insists on the idiosyncratic attributes of their discipline (i.e. theoretical assumptions) being more worthy or truthful than another discipline’s idiosyncratic attributes. Therefore, financial data scientists
minimize … [their] use of assumptions … [and] make every effort to empirically test these. In other words, while … [others] tend to look at the world from their theoretical angle, financial data scientists … undertake a deep investigation of all available data to then arrive at conceptual explanations of what happens in the real world. (Hoepner Citation2016, 2)
Consequently, we define financial data science as an interdisciplinary process of scientific enquiry, which is rigorously and repeatedly exploring and explaining the variance in all relevant data sets to advance financial decision making and thereby enlightening not only the interdisciplinary team of researchers but also society as a whole. In line with (Simonian and Fabozzi Citation2019, 12), we argue ‘that financial data science is a discipline in its own right, and not merely the application of data science methods to finance’, since the self-reinforcing yet mean-reverting nature of many financial markets produces distributions alien to classic data scientists and hence require a distinct, interdisciplinary field of enquiry. Nevertheless, the emerging field of financial data science is inevitably complementary to the intersection of data science and other disciplines (e.g. evidence-based medicine). We argue in the following section that it experiences a similar yin yang style complementary relationship with econometrics.
Yin Yang of econometrics and financial data science
While econometrics and financial data science differ in their intellectual point of departure (i.e. statistical techniques and data sets, respectively) and exhibit some further divergences largely due to the inevitably interdisciplinary nature of financial data science, the two fields have many more aspects in common than divide them. Both use econometric concepts and techniques, both fields develop their hypotheses informed by some form of economic theorising. Similarly, both are likely to make use of the wealth of newer and bigger data sets resulting from digitalisation and an increased willingness of commercial organisations to share their growing number of proprietary datasets with academics. And finally, both fields are likely to experience an increased practical relevance due to their analysis of bigger and more often proprietary datasets.
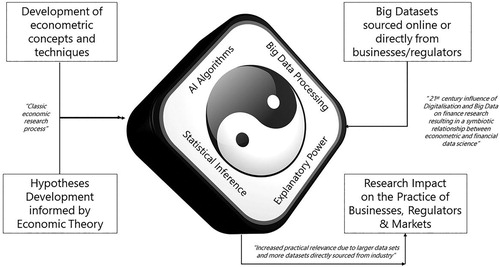
Hence, whereas econometrics has more emphasis on statistical inference and financial data science has more emphasis on big data processing, both fields share both concepts. Similarly, neural networks have been described for decades in advanced econometrics textbooks and the concept of explanatory power simultaneously represents the fit of the econometricians’ model as well as the degree to which a financial data scientist understands the variation in the respective dependent variable. In other words, econometrics and financial data science represent two complementary perspectives on the same process. Hence, we argue that they enjoy a yin yang type relationship as displayed in Figure .
Figure 1. The Yin Yang (i.e. complementary relationship) of Econometrics and Financial Data Science.
Notes: The Yin Yang symbol in the middle captures the most crucial aspects of econometrics and financial data science. The text in the boxes provides a formal description of the processes contributing to the complementary relationship between econometrics and financial data science. The text in quotation marks and italics provides practical commentary.
We continue by jointly exploring the implications of the ever-increasing amount of human data for the fields of econometrics and financial data science while simultaneously introducing the contributions of this special issue. We commence by discussing new analytical measurement opportunities and new financial products arising from the age of big data. Subsequently, we discuss the challenges that big data impose on the financial economics research process and the resulting need for new research methods and processes to address these. We propose to extend the researchers’ focus on statistical significance and economic relevance to also include statistical relevance and economic significance. We conclude with a discussion of the urgent avenues for future research in the fields of econometrics and financial data science at the advent of the age of big data.
Research opportunities in the age of big data
The most obvious implication of the age of big data is new datasets. A stunning example of such work in progress is (Fedyk and Hodson Citation2018), who extract monthly information on career progress from over thirty million curricula vitae of employees of US firms to investigate the impact of turnover and the skill level of human capital on firm performance. They observe that higher turnover hurts returns, which is intuitive but would previously have been studied only on much smaller and hence less generalisable datasets. Based on a similar text-extraction approach, Goloshchapova, Poon, Pritchard and Reed (Citation2019, 2) used ‘a battery of Python code … and … the latest R algorithm’ to extract the topics discussed in over 5000 corporate social responsibility (CSR) reports of more than thousand firms from 15 European countries between 1999 and 2016. They observe topic clustering at the sectoral level with, for instance, industrial firms displaying a bigger concern for employee safety and consumer firms being more engaged in topics such as ‘food packaging’. While such results may seem intuitive to the reader, it is the relation of these ‘big data statistics’ to economic outcomes that presents the deeper appeal of financial data science.
Thng (Citation2019) represents such a paper, which relates text-extracted information to abnormal returns. She first extracts the tone of 647 Initial Public Offerings (IPO) of US firms employing four separate sentiment measurement approaches.Footnote6 She finds that VC-backed IPO has a less optimistic tone and explains this with concerns around litigation risk. Nevertheless, this defensive language does not appear to hamper performance. Much the opposite, Thng (Citation2019) observes VC-backed IPOs to significantly outperform non VC-backed IPOs over longer horizons. A less expected but by no means less interesting application of novel datasets in financial data science is offered by Kumar et al. (Citation2018). The authors obtained access to a rather unique proprietary dataset: over five million bank accounts with 250 million transactions belonging to clients over the age of 70. Such elderly clients may be the victims of fraud and hence protecting them reduces the operational risk of the major financial institution that provided the data on the condition of anonymity. Employing both logistic regression and classification techniques (support vector machines), the authors develop a new alert model that significantly advances beyond the practical status quo in terms of accuracy. Apart from being a relevant academic contribution and in practical terms representing a significant reduction in operational risk, this paper also received a very positive review from the Wall Street Journal.Footnote7 In short, a truly innovative and successful financial data science research project that also displayed a positive impact on society.
Besides the exploration of new datasets, the ever-increasing amounts of information in the age of big data also allow for a deeper exploration of previously overlooked research questions, either through a very large collection of various individual data sets or through a much deeper dive into previously less transparent subjects of analysis. A famous example of a very large collection of data sets is Moskowitz, Ooi, and Pedersen's (Citation2012) study of time-series momentum in 58 liquid security types. Similarly, Cotter and Suurlaht's (Citation2019) study risk across various asset classes. They include credit risk, equity market risk, interest rate risk, interbank liquidity risk, and real estate market risk, and they find that spillovers between these are led by the equity and real estate markets, which supports the view that these have a special role in terms of financial stability.
Asimakopoulos, Asimakopoulos, and Fernandes (Citation2019) focus on a previously less transparent subject of analysis: unlisted firms. More specifically, they compare unlisted firms’ cash holdings with those of listed firms and expect that unlisted firms will be more inspired by the precautionary principle, therefore holding more cash. The authors confirm their expectation based on a sample of more than hundred thousand Euro-area manufacturing firms. Another category of previously less studied subjects of analysis are those products that only exist as a consequence of bigger data sets and much faster computational processing capabilities. One class of these products is Exchange Traded Funds (ETFs). Studying a specific version of these ETFs – leveraged ETFs based on commodities – Del Brio, Mora-Valencia, and Perote (Citation2018) show that semi-nonparametric approaches to risk assessment can perform better than Gaussian approaches in backtests of expected shortfall. In fact, nonparametric approaches are themselves likely to experience a resurgence in popularity due to the classification focused nature of many machine learning approaches. Consequently, Jackson’s (Citation2019) theoretical contribution to this special issue is rather timely since the development of new tests and techniques further extends the toolbox available for data scientists to conduct analysis. In particular, nonparametric tests (such as Jackson Citation2019) do not require distributional assumptions about the underlying data, a major advantage when there is still much debate over the generating process.
Research challenges originating from the age of big data
Based on increasing computational power, researchers such as Mclean and Pontiff (Citation2016) or Jacobs and Müller (Citation2019) conduct all-in studies of any relevant cross-sectional predictor of stock returns and the effect of academic publication on the very predictability of these factors. While Mclean and Pontiff (Citation2016) study ‘only’ 97 predictors, Jacobs and Müller (Citation2019) increase this number to 241. Conceptually, there is no theoretical limit to the number of cross-sectional predictors and or time series trading strategies than can be studied, and investment practice is a very willing audience for such kind of academic research. In fact, the increasing literacy of academic scholars from various disciplines in programming languages such as Python and R is likely to make the occurrence of such all-in studies a regular sight in both academic and professional seminar series.
Increasing in the numbers game, Psaradellis et al. (Citation2018) apply 7846 technical trading rules to daily data of crude oil futures and the US Oil fund to a sample period of almost 10 years that provides them with significant statistical power. Employing controls for multiple hypothesis testing proposed by Romano and Wolf (Citation2007) and Bajgrowicz and Scaillet (Citation2012), they cannot find systematic, persistent abnormal returns to any of the technical trading rules. Taking the numbers game to the extreme, work in progress by Chordia, Goyal, and Saretto (Citation2017) generates 2.1 million trading strategies to evaluate the severity of p-hacking in finance research. They find that most rejections of the null hypothesis under single hypothesis testing disappear using a multiple hypothesis testing framework that accounts for cross-correlations within signals. They conclude that p-hacking is a serious concern for finance research, whose severity is substantially increased by the advent of the age of big data.
Consequently, researchers face the challenge that, due to increasingly large numbers of observations available, the conventional protocols for hypothesis testing are disrupted by shocks to the statistical power of the test datasets (i.e. extremely large number of observations) and shocks to the computing power of the researchers themselves (i.e. extremely large numbers of generated test subjects). While the computing power challenges are theoretically infinite following Moore’s law, the statistical power challenge can be precisely illustrated based on the t-statistics that a correlation coefficient would have in a controlled laboratory setting depending on the number of observations. As shown in Table , theoretically true correlation coefficients of up to 2% would have t-statistics far below the critical values for conventional significance levels in case of sample sizes of 100 or even 1000 observations. However, the same theoretically true correlation coefficients would be declared statistically significant from 0.1% upwards for 10 million observations. This striking difference is neither caused nor helped by the fact that the critical values themselves decrease incrementally with the number of observations. In any case, it highlights how severe the statistical power challenge is in the age of big data. More worryingly, from 10 million observations onwards, regression coefficients are in many cases more likely to be declared highly significant at conventional significance levels than to be considered insignificant or mildly significant, even if they are in fact entirely inconsequential.
Table 1. Statistical power challenge as illustrated for the simple example of t-statistics of a Pearson correlation coefficient.
These statistical and computing power challenges require new thinking about research protocols and practices to allow researchers to explore the opportunities offered by ever-faster computing and exponentially increasing amounts of data being produced, while simultaneously ensuring that the profession maintains its integrity.
New research practices to address research challenges in the age of big data?
To address the issue of p-hacking resulting from the increasing ability of researchers to generate an extremely large number of usually interrelated test portfolios, Arnott, Harvey, and Markowitz (Citation2019) develop a ‘research protocol for investment strategy backtesting’ including 22 questions in 7 sections. While some questions are – as one would expect from AHM – technical such as ‘[i]s the model resilient to structural change’ or ‘[h]ave the researchers taken steps to produce the simplest practical model specification’ (73), the vast majority of their questions are procedural if not philosophical and focus on the integrity of the research process.
For instance, AHM ask ‘[d]id the researchers take steps to ensure the integrity of the data?’ Similarly, they question whether ‘the research culture reward[s] the quality of the science rather than the finding of a winning strategy’. These questions about the integrity of the research process are crucial as adjustments for multiple hypotheses testing only work if researchers are transparent about each and every test they conducted. AHM even go beyond the integrity questions and suggest assessing the level of education of the researchers and their managers by asking if ‘the researchers [are] aware that true out-of-sample tests are only possible in live trading’ and if ‘researchers and management understand that most tests will fail’ (73).
While there is clearly a very strong need to assess the integrity of researchers and their research processes in the age of big data, we do not fully understand how AHM aim to practically assess these integrity questions without relying on a researcher self-assessment format that may itself suffer from financial conflicts of interest. AHM recommend determining any relevant research design decision ex-ante before the formal research process has started but this sadly does not prevent researchers from conducting informal explorations to determine ex-ante research design set ups which are supportive of their subsequent formal research process. Further conceptual development and perhaps inspiration from other scientific disciplines such as medicine seem needed to address these significant challenges resulting from researchers’ newfound abilities to create extremely large numbers of test portfolios.
Furthermore, the challenge of millions of test portfolios is reasonably specific to a selection of research questions such as the performance of investment strategies, while the challenge of an extremely large number of observations is likely to impact virtually any research question. In our view, an obvious response to this – apart from multiple hypothesis testing where applicable – is to sharpen the conventional significance levels required from 10%, 5% and 1% to 1%, 0.5% and 0.1%, respectively. Such a simple adjustment of expectations regarding statistical significance could be applied across research questions and would simply recognise that one can expect more robustness in conclusions from modern researchers who can see much further and/or in much more detail than previous generations.
However, we argue that an increased focus on concepts beyond statistical significance allows researchers to utilise the benefits of the age of big data while protecting themselves from the pitfalls. These concepts are economic significance, economic relevance and especially statistical relevance as outlined in Table . Crucially, while statistical power is vastly increased by the use of big data and hence the difficulty of achieving conventional significance levels (i.e. 5%) has dropped substantially, the remaining three concepts are not negatively affected by the advent of the age of big data.
Table 2. Implication of big data for the significance and relevance of empirical research results in statistical and economic terms.
Economic significance (i.e. the effect size itself) remains unaffected, while more data sets allow for a more seamless comparison of effect size with other economic indicators. Similarly, economic relevance remains to be assessed by the relationship between the effect size and distributional properties such as the mean and standard deviation of the dependent variable. It probably also slightly benefits from bigger datasets, as these imply that the distributions of the dependent variable are estimated with incrementally increasing accuracy.
Since each individual coefficient’s probability of being statistically significant increases with the substantially larger statistical power resulting from the use of big data, the statistical relevance of each coefficient is likely to become a more important assessment criterion for research quality. Statistical relevance can be measured as an incremental explanatory power (e.g. Adjusted R-squared, Shapley R squared) of adding the respective variable to the otherwise identical model. In the age of big data, it appears not impossible for an individual coefficient to be considered statistically significant when its actual statistical relevance is negligible or even slightly negative. Consequently, we propose that researchers should discuss not only the statistical significance of the coefficients to key independent variables on which they build their narratives but also measure and discuss statistical relevance as well as commenting on the economic significance and relevance of key coefficients.
Concluding thoughts
With millions of tweets being published in less than 10 min and millions of Google searches being requested in less than 1 min, we are living through the advent of the age of big data. Such a shock to the amount of available information appears to result in the emergence of a new research paradigm: financial data science. Acknowledging that we are currently experiencing the advent of the age of big data with ever-increasing amounts of data produced on a daily basis, this brings into being exciting new opportunities for academic research which itself will evolve, if not suddenly then at least gradually, in response to this new environment. We conclude on four aspects.
First and maybe most obviously, the strongly increasing computational power and the seamlessness of open source programming languages such as Python and R are likely leading to significant challenges for their commercial competitors. This process democratises access to statistical packages and economises on limited scholarly research funding, and is therefore beneficial even if it implies that many of us will gradually have to adapt our textbooks and taught courses.
Second, econometrics and financial data science are clearly complementary fields and we are likely to see an increasing number of studies using innovative fact extraction-based datasets such as Fedyk and Hodson (Citation2018) or Thng (Citation2019) as well as many more ‘all in’ studies of any relevant effect such as Mclean and Pontiff (Citation2016) or Jacobs and Müller (Citation2019). Studies such as Kumar et al. (Citation2018), who use financial data science techniques to directly advance societal goals such as the protection of the elderly from fraud, are very welcome and hopefully also a more common sight at seminars going forward.
Third, the econometrics and financial data science research community may receive inspiration from medical research and collaborate to establish an institution such as the Cochrane Reviews for jointly synthesizing research results.Footnote8 While the integrity of each individual researcher is hard to ensure, a community of researchers acting jointly should be able to keep itself accountable and thereby maintain its integrity. Pre-registration of research as practiced in much of medicine and psychology,Footnote9 and as suggested by López de Prado (Citation2019), for financial data science research, may also support integrity. Furthermore, we support the idea of actual out-of-sample periods of at least one year occurring past the pre-registration in addition to our proposal of an assessment of the statistical and economic significance and relevance of each key coefficient.
Finally, we clearly need much more engagement with performance management standards. AHM’s (Citation2019) protocol for backtesting hypothetical investment strategies is clearly a step in the right direction, but we need further thinking on how to address a new version of the old joint hypothesis problem. While pre-registering the research design and actual out-of-sample periods would certainly help, we might need to develop a research stream on the performance models themselves to avoid researchers registering weak performance models as often as some investment managers cherry-pick custom benchmarks. But it is not only financial return models that we are concerned about. We are maybe even more concerned about our models of risk which often are actual models of deviation to both sides (e.g. variance and tracking error are used more often than semi-variance and trailing error, respectively). If risk is measured including upside and downside deviations from the mean (i.e. variance) or an index return (i.e. tracking error), then the researcher assumes that each investor ‘considers extremely high and extremely low returns equally undesirable’ (Markowitz Citation1959, 194). Since this assumption is inaccurate for any professional investor and Markowitz's (Citation1959, 193) practical caveat that computing based on co-variance instead of variance requires ‘roughly two to four times as much computing time’ does not apply anymore given 2019 computational power, the accurate measurement of risk or the implications of inaccurate measurement of risk appear fruitful avenues for further research in econometrics and financial data science.
Acknowledgments
The authors are very grateful to Chris Adcock for providing us the opportunity to empower and develop research on financial data science and econometrics. Our thinking has benefited from discussions with Alexander Arimond, Damian Borth, John Cotter, James Hodson, Yanan Lin, Markus Koch, Valerio Poti and Pei-Shan Yu. Authors are alphabetically listed. All remaining errors are our sole responsibility.
Disclosure statement
No potential conflict of interest was reported by the authors.
ORCID
Chardin Wese Simen http://orcid.org/0000-0003-4119-3024
Notes
2 https://web-assets.domo.com/blog/wp-content/uploads/2018/06/18_domo_data-never-sleeps-6verticals.pdf
3 We would like to note that we used the term ‘Financial Data Science’ as part of the ‘Econometrics and Financial Data Science’ workshop at the ICMA Centre of Henley Business School on 2 November 2017, before the equivalently titled paper by Giudici (Citation2018) or Simonian and Fabbozzi (Citation2019, 10) announcement of ‘the birth of financial data science’ in their first issue of The Journal of Financial Data Science published by IPR journals. Our use of the term ‘Financial Data Science’ indeed dates back to 13 November 2014, when one of our co-authors used it in a Henley Business School faculty viewpoint (Hoepner, Citation2014). He had been inspired by discussions he had earlier in the year with Damian Borth, who was a postdoc at the International Computer Science Institute (ICSI) of UC Berkeley at the time. https://www.henley.ac.uk/news/2014/financial-data-science-vs-financial-economics.
5 See also the Asilomar AI Principles which contain a similar team spirit focused ethos. https://futureoflife.org/ai-principles/?cn-reloaded=1
6 See Table 1 in her paper for a comparison of these techniques.
8 To the best of our knowledge, such an institution like the Cochrane Library (https://www.cochranelibrary.com/about/about-cochrane-reviews) solely dedicated to synthesising research only exists in the medical discipline, where communicating the most likely best treatment of a given symptom to general practitioners in the light of conflicting results from empirical studies can potentially be a matter of life or death.
References
- Arnott, R. D., C. R. Harvey, and H. Markowitz. 2019. “A Backtesting Protocol in the Era of Machine Learning.” The Journal of Financial Data Science 1 (1): 64–74. doi:10.3905/jfds.2019.1.064.
- Asimakopoulos, P., S. Asimakopoulos, and F. Fernandes. 2019. “Cash Holdings of Listed and Unlisted Firms: New Evidence from the Euro Area.” European Journal of Finance.
- Bajgrowicz, P., and O. Scaillet. 2012. “Technical Trading Revisited: False Discoveries, Persistence Tests, and Transaction Costs.” Journal of Financial Economics 106 (3): 473–491. doi:10.1016/j.jfineco.2012.06.001.
- Brooks, C. 2002. Introductory Econometrics for Finance. 1st ed. Cambridge: Cambridge University Press.
- Campbell, J. Y., Lo, A. W. and MacKinlay, A. C. (1997). The Econometrics of Financial Markets. Princeton, NJ: Princeton University Press. doi:10.2307/j.ctt7skm5.
- Chordia, T., A. Goyal, and A. Saretto. 2017. p-hacking: Evidence from two million trading strategies. Swiss Finance Institute Research Paper.
- Cotter, J., and A. Suurlaht. 2019. “Spillovers in Risk of Financial Institutions.” The European Journal of Finance, 1–28. doi:10.1080/1351847X.2019.1635897.
- Del Brio, E. B., A. Mora-Valencia, and J. Perote. 2018. “Expected Shortfall Assessment in Commodity (L)ETF Portfolios with Semi-nonparametric Specifications.” European Journal of Finance. doi:10.1080/1351847X.2018.1559213.
- Fedyk, A., and J. Hodson. 2018. “Trading on Talent: Human Capital and Firm Performance.” SSRN Electronic Journal. doi:10.2139/ssrn.3017559.
- Financial Data Science Association. 2016. “ReFine Principles of Financial Data Science – FDSA.” December 14. Accessed July 29, 2019. https://fdsaglobal.org/initiatives/refine-principles-of-financial-data-science/.
- Giudici, P. 2018. “Financial Data Science.” Statistics and Probability Letters 136 (C): 160–164. doi:10.1016/j.spl.2018.02.024.
- Goloshchapova, I., S.-H. Poon, M. Pritchard, and P. Reed. 2019. “Corporate Social Responsibility Reports: Topic Analysis and Big Data Approach.” The European Journal of Finance, 1–18. doi:10.1080/1351847X.2019.1572637.
- Hoepner, A. G. F. 2014. “Financial data science versus financial economics, Henley Faculty Viewpoint.” November 13. Accessed August 6, 2019. https://www.henley.ac.uk/news/2014/financial-data-science-vs-financial-economics.
- Hoepner, A. G. F. 2016. “Financial Data Science for Responsible Investors.” In 10-4-10 Anniversary Book: Chapter 4, edited by M. Mansley and F. Ward, 2–8. Bristol: Environmental Agency Pension Fund.
- Jackson, R. H. G. 2019. “Sub-sequence Incidence Analysis Within Series of Bernoulli Trials: Application in Characterisation of Time Series Dynamics.” European Journal of Finance. doi:10.1080/1351847X.2019.1583117.
- Jacobs, H., and S. Müller. 2019. “Anomalies Across the Globe: Once Public, No Longer Existent?” Journal of Financial Economics. doi:10.1016/j.jfineco.2019.06.004.
- Kumar, G., C. B. Muckley, L. Pham, and D. Ryan. 2018. “Can Alert Models for Fraud Protect the Elderly Clients of a Financial Institution?” European Journal of Finance. doi:10.1080/1351847X.2018.1552603.
- López de Prado, M. M. 2019. Advances in Financial Machine Learning. 1st ed. Hoboken, NJ: John Wiley and Sons, Inc.
- Markowitz, H. 1959. Portfolio Selection: Efficient Diversification of Investments. 1st ed. New York: John Wiley and Sons.
- Mclean, R. D., and J. Pontiff. 2016. “Does Academic Research Destroy Stock Return Predictability?” Journal of Finance 71 (1): 5–32. doi:10.1111/jofi.12365.
- Moskowitz, T. J., Y. H. Ooi, and L. H. Pedersen. 2012. “Time Series Momentum.” Journal of Financial Economics 104 (2): 228–250. doi:10.1016/j.jfineco.2011.11.003.
- Psaradellis, I., J. Laws, A. A. Pantelous, and G. Sermpinis. 2018. “Performance of Technical Trading Rules: Evidence From the Crude Oil Market.” European Journal of Finance. doi:10.1080/1351847X.2018.1552172.
- Romano, J. P., and M. Wolf. 2007. “Control of Generalized Error Rates in Multiple Testing.” Annals of Statistics 35 (4): 1378–1408. doi:10.1214/009053606000001622.
- Simonian, J., and F. J. Fabozzi. 2019. “Triumph of the Empiricists: The Birth of Financial Data Science.” The Journal of Financial Data Science 1 (1): 10–13.
- Thng, T. 2019. “Do VC-Backed IPOs Manage Tone?” European Journal of Finance. doi:10.1080/1351847X.2018.1561482.
- Weiss, N. A. 2012. Introductory Statistics. 9th ed. Boston, MA: Addison Wesley/Pearson Higher Ed.