
 ?Mathematical formulae have been encoded as MathML and are displayed in this HTML version using MathJax in order to improve their display. Uncheck the box to turn MathJax off. This feature requires Javascript. Click on a formula to zoom.
Abstract
This research examines the market reaction to the publication of firm-specific environmental news for participating firms in the European Union’s Emissions Trading System (EU ETS) during its third phase. Our sample of 123 publicly listed participating firms, located in 21 European countries, accounted for 45.43% of emissions in the EU ETS in 2020. Using an event study methodology during the period 2014–2021, we find that positive news was rewarded with increased returns for publication events related to the latter years of the phase (2017–2020) while it had an insignificant impact for earlier year (2013–2016). This indicates that the EU ETS is finally fulfilling its intended function of incentivising participating firms to reduce their emissions. Our study highlights the contextually contingent nature of the relationship between environmental and financial performance.
1. Introduction
Over recent decades, external pressure for businesses to behave more responsibly towards the environment has intensified from a multitude of stakeholders including the government, media, NGOs and consumers (Flammer Citation2013; Hase et al. Citation2021). Many governments have implemented policies aimed to help their economies decarbonise while at the same time the investment community has recognised environmental performance as a key metric to consider as part of the growing field of ESG investing (Global Sustainable Investment Alliance Citation2018). An understanding of the impact of policies introduced by the government on the allocation of capital to sustainable economic activities is crucial if the required reduction in environmental degradation is to be achieved in line with stated goals such as the Paris agreement and the G7 Nature compact.
The EU has implemented a carbon emissions trading system as one of its key policies to achieve its decarbonisation ambitions (European Commission Citation2015b), based on the Polluter-Pays-Principles enshrined in EU treaties. However, the performance of the system and the incentives it creates have been repeatedly brought into question since its inception (Bruninx et al. Citation2019). As the system has evolved through periodic revisions to its structure, the incentives it creates have also been in flux. The aim of this study is to explore the impact of the EU’s Emissions Trading System (ETS) on the valuation of participating firms during its third phase (2013–2020) in order to examine the incentives it creates for firms to reduce their emissions.Footnote1 An examination of the response of market actors to the announcement of verified firm-specific carbon emissions data, allows us to observe the market’s assessment of its expected financial impact on participating firms, and to assess whether markets create an incentive for emissions reduction by rewarding (punishing) news of positive (negative) environmental performance.
Specifically, we use an event study methodology to analyse the market reaction to emissions verification events related to the third phase of the EU ETS over the period 2014–2021 on a sample of 123 participating listed firms. Emissions verification events reveal participating firms’ carbon emissions and resultant EU ETS allowance (EUA) demand for the previous year. We identify two distinct periods during the third phase of the Emissions Trading System with regards to the price of traded allowances. An inflection point occurs around the time of the announcement of the revisions to the system for Phase 4 in late 2017 (Friedrich et al. Citation2019; Friedrich et al. Citation2020).Footnote2 Hence, we split Phase 3 into the period before (Phase 3a: 2013–2017) and after (Phase 3b: 2018–2020) the announcements of these revisions to investigate whether the divergent market dynamics in these two periods altered the market reaction to verification events. The valuation of participating firms’ carbon-related environmental performance revealed during subsequent emissions verification events (Phase 3b) may be altered in the presence of a more stringent regulatory environment (Clarkson et al. Citation2015) if markets adapt their assessment of its materiality. Hence, this sub period analysis investigates whether the change in market dynamics between the two periods also aligned the incentives created by the EU ETS with its intended purpose.
We examine the market reaction to the verification events in each year, and specifically the reaction to the positive or negative news contained within the emissions data using three distinct measures. Firstly, we measure the change in a firm’s allowance surplus since the previous year as the absolute change in a firm’s EUA or carbon liability (Clarkson et al. Citation2015). Secondly, we measure a firm’s change in their industry relative allowance surplus/deficit. Finally, we create a measure of expectations based on the average past emissions reductions of the firm as the provision of new information about the carbon emissions of a firm may only cause abnormal changes in its stock price when the information deviates from investors’ expectations and is perceived to impact profitability (Gupta and Goldar Citation2005).
We find evidence of a significant change in the impact of verified emissions announcements between the early and later stages of Phase 3. We find that positive news of a reduction in both absolute and industry-relative carbon liability is rewarded with increased returns in Phase 3b while it has an insignificant impact in Phase 3a. These findings are consistent with previous findings that the EU ETS was not adequately compensating proactive firms or penalising those that pollute in the earlier periods (Andreou and Kellard Citation2021). The increased value relevance of carbon liability reductions in the latter period may be attributed to a number of changes in contextual factors such as the increased stringency of the EU ETS (Verde et al. Citation2021), intensified political focus on combating climate change and the increased flow of funds into socially responsible investment funds. However, we find that negative news, that is, an increase in a firm’s absolute or industry-relative carbon liability has no corresponding effect on firm returns in either period. This indicates that financial markets provide an incentive for firms to reduce their absolute or industry-relative carbon liability but no disincentive for increases in either measure. When we create a measure of expectations and stratify a firm’s emissions reduction performance by the magnitude of the deviation from it, we find that substantial deviations from expectations (i.e. substantial unexpected increases or decreases in emissions) provoke a market reaction for both positive and negative surprises in the latter period of Phase 3.
Overall, our findings indicate that any changes in emissions; absolute, industry-relative or relative to expectations, were not valued by investors until Phase 3b, that only absolute or industry-relative reductions in a firm’s carbon liability are rewarded, and that changes in emissions only provoke a market reaction when the change is either substantially more or less than expected. These findings indicate that the markets assessment on the incentives created by the EU ETS for firms to reduce their emissions has evolved to become more aligned with its emissions reduction goal during its third phase.
Our research makes several contributions to the extant literature. Firstly, it contributes to the body of research which examines the stock market reaction to environmental news (Capelle-Blancard and Petit Citation2019; Flammer Citation2013; Lioui and Sharma Citation2012) by providing a novel examination of the market reaction to positive and negative news related to the carbon liability and emissions of firms. Secondly, we contribute to previous research on the EU ETS which has highlighted the importance of considering industry characteristics of participating firms (Abrell, Ndoye Faye, and Zachmann Citation2011; Bushnell, Chong, and Mansur Citation2013; Jong, Couwenberg, and Woerdman Citation2014; Koch and Bassen Citation2013). Thirdly, we explicitly consider environmental news in relation to market expectations which contributes unique findings to the literature. Fourth, we contribute evidence that greater external pressure amplifies shareholders’ reactions to positive or negative news. This makes a major contribution to the literature by highlighting the contextually contingent nature of the relationship between environmental and financial performance. This has implications for policy as we demonstrate that an increased perception of the future stringency of the system, and political commitment to it, increased the effectiveness of the EU ETS in shaping the market treatment of emissions-related environmental performance. Lastly, this research extends the body of research into the incentives created by the ETS for publicly traded participating firms (Brouwers et al. Citation2016) with an examination of Phase 3 which had not yet been examined in its entirety. Hence, it offers an updated insight into the impact of one of the EU’s core environmental policies on the financial market impact of changes in participating firm’s environmental performance.
The remainder of the paper is structured as follows. In Section 2 we describe the evolution of the EU ETS and EUA price. We then review the literature related to the relationship between environmental performance and financial performance and develop our hypotheses to be tested. Section 3 describes our dataset and provide details of our methodological approach used to test our hypotheses. We then present our results in Section 4, followed by a discussion of the findings, limitations, and implications of our study in Section 5.
2. Literature review
2.1. European Union emissions trading scheme
The European Union’s Emissions Trading Scheme is the corner stone of the EU’s strategy to tackle climate change by creating financial incentives for European companies with the largest emissions of carbon dioxide to reduce those emissions (European Commission Citation2015b). It is the first and largest cap-and trade system for reducing greenhouse gas (GHG) emissions and accounts for the majority of international carbon trading (De Clara and Mayr Citation2018). The EU ETS limits emissions from around 10,000 installations in the power sector and manufacturing industries in EU and EEA-EFT countries which account for approximately 40% of the EU’s greenhouse gas emissions (European Commission Citation2021). The policy instrument is designed to directly limit GHG emissions by setting a system cap and then harnesses the power of market forces by allowing participating companies the flexibility to trade emissions allowances. This system design sidesteps the difficulty of determining the ‘right price' of carbon to obtain a given amount of emissions reduction by setting the overall reduction goal and allowing the market to decide the price.Footnote3
The EU ETS, currently in its fourth phase, was established in 2005 and has developed through an iterative process with successive phases involving updates, tightening, changes and improvements. In the first two phases (2005–2007, 2008–2012), the vast majority of allowances were given to emitters at no cost with the remaining proportion auctioned (European Commission Citation2015b). Both phases suffered from an over allocation of free allowances and resultant collapse in the price of EUAs. This overallocation has been attributed to a lack of accurate verified data for the process in the first phase (De Clara and Mayr Citation2018) and multiple factors in the second phase including a slowdown in economic activity due to the 2008 financial crisis, the abundant usage of international credits generated through the Kyoto Protocol and the impact of overlapping policies (De Clara and Mayr Citation2018; European Commission Citation2015b; Verde et al. Citation2021). These major changes in EUA demand and supply have created substantial changes in EUA price returns and volatility since the inception of the EU ETS (Jia et al. Citation2020).
Our research focuses on the third phase of the EU ETS (2013–2020), which was marked by a number of major revisions designed to improve the functioning of the system which included a centralised free allowance allocation system, an increased proportion of auctioned allowances and stricter cap (European Commission Citation2015a). The persistently low EUA price at the beginning of phase 3 created the impression that the EU ETS did not work as intended and was in need of reform (Edenhofer Citation2014). However, political interventions in the market failed to reverse the trend until the announcement of the EU ETS reforms for Phase 4 in 2017. Jia et al. (Citation2020) identify a structural change to the market the middle of phase three related to this intervention. The announcement of the introduction of the market stability reserve (MSR)Footnote4 and its cancellation policy are highlighted as possible catalyst for the change in price dynamics as they enhanced the robustness of the system to economic shocks and reduced the overall cap (Gerlagh, Heijmans, and Rosendahl Citation2020). Additionally, the announcement may have also dispelled the dominating perception of a lack of political will to tighten the system which weighed on the EUA price in the earlier period (Grosjean et al. Citation2016; Salant Citation2016).Footnote5 The increased probability of further scarcity increasing political interventions in the market during the latter years of Phase 3 due to the increasing political focus on carbon emissions reduction as evidenced in proposals such as the European Green Deal (European Commission Citation2019) may also be a key driver of the price.
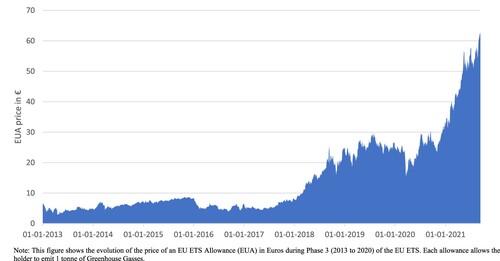
As the logic of the EU ETS is to form price signals for the EUA which optimise the trade off by covered corporations between investing in low carbon advanced technologies and purely trading carbon allowances to complete compliance (Du, Tang, and Song Citation2016), previous research has focused on the EUA price, its determinants, and the impact of events on carbon prices. Zhu et al. (Citation2019) studied carbon price drivers and found that the effect of electricity market and stock index appeared earlier whereas the impact of coal, oil and gas prices lagged behind in the medium and long timescale. However, some divergence in the drivers of EUA prices has been found in the literature with the evolution of the system responsible for the fluctuations in the fundamental drivers of price. The nature of the EU ETS with its pre-specified emissions limits creates a vulnerability to unexpected external shocks and policy adjustments that have dramatic impact on the demand and supply of EUAs (Christensen et al. Citation2005). These external shocks can create break points which alter the data-generating process of EUA prices. These might indicate a change in the relationship between the marginal CO2 abatement cost and thus indicate a change in the economic and environmental efficiency of the EU ETS (Christiansen and Wettestad Citation2003). These break points, resultant from a change in market expectations caused by structural changes in the EUA price, divide EUA price development into different periods (Jia et al. Citation2020). Figure displays the price per EUA in Euro over the period, where one EUA allows the holder to emit 1 t of greenhouse gasses. We observe that the price per EUA remains low, under €10 between 2013 and 2017, and from early 2018 it begins to increase and increases significantly between 2018 and 2021. We refer to the first period of low prices as Phase 3a (2013–2017) and the subsequent period of increasing prices as Phase 3b (2018–2020)Footnote6 for the remainder of our analysis.
Figure 1. EU ETS allowance price evolution during Phase 3.
Verified emissions publications are identified as some of the most influential event in the EU ETS as they represent institutional information disclosures, providing authenticated information to the EUA market regarding overall demand and firm specific carbon reduction performance (Guo et al. Citation2018). An extensive literature has examined the impact of these events on the price of EUAs due to their important role in the price discovery process. The role played by these events in the price discovery process is highlighted by their ability to impart significant shocks to the EU ETS causing structural breaks in the market in both 2006 and 2009 (Brouwers et al. Citation2016). Hitzemann, Uhrig-Homburg, and Ehrhart (Citation2010) and Jia, Xu, and Fan (Citation2016) investigated the impact of emissions announcements during the first two phases and found that the EU ETS efficiently incorporated information from these events. Guo et al. (Citation2018) investigate the trading behaviour around these announcements during its first two phases and conclude that the carbon market has evolved from a simple environmental regulatory instrument to a functioning market in its second phase implying that EUAs have become recognised as some kind of financial asset. Since EU ETS was originally proposed as an instrument to achieve abatements in carbon emissions of participating firms (Christiansen and Wettestad Citation2003; Convery Citation2009), it might be helpful to examine whether the micro-level carbon reduction performance of these firms revealed in the same verified emissions events is judged as material by market actors in these different periods.
2.2. Environmental and financial performance
The relationship between a firm’s environmental and financial performance has attracted an increasing amount of attention over the years as the climate emergency focuses the minds of academics and policymakers (Hase et al. Citation2021). However, there are still divergent views on the nature of the relationship, its shape or even the need for policy intervention to encourage companies to transition to more environmentally friendly business activities (Hang, Geyer-Klingeberg, and Rathgeber Citation2019). Disagreement still exists regarding the sign of the relation, moderating and mediating factors, and the causality of the effect (Hang, Geyer-Klingeberg, and Rathgeber Citation2019).
Proponents of the ‘traditionalist view’ subscribe to Friedman's (Citation1970) trade-off hypothesis which posits that environmental performance and financial performance are necessarily negatively related (Walley and Whitehead Citation1994). The counter-argument that environmental performance is positively related to financial performance due to its ability to generate new and competitive resources for a firm has been made from numerous theoretical perspectives such as stakeholder theory (Freeman Citation1984), instrumental stakeholder theory (Jones Citation1995), the natural resource based view of the firm (Hart Citation1995) and using the Porter hypothesis (Porter and Linde Citation1995). Porter and Linde (Citation1995) highlight the importance of the regulatory context in facilitating this type of ‘win-win’ outcome.
Empirical investigations into the relationship between environmental and financial performance has resulted in contradictory findings with several meta-analysis confirming the presence of a positive relationship (Busch and Friede Citation2018; Endrikat, Guenther, and Hoppe Citation2014) while other studies support the existence of a negative relationship (Gonenc and Scholtens Citation2017; Horváthová Citation2012; Lioui and Sharma Citation2012) and more recently studies have found it to be nonlinear (Lahouel et al. Citation2022; Lahouel, Bruna, and Zaied Citation2020). This body of research which endeavours to establish the underlying relationship between environmental and financial performance is often plagued with questions regarding the direction of causality and the quality of the environmental data usedFootnote7 (Hang, Geyer-Klingeberg, and Rathgeber Citation2019).
An event study methodology has been implemented by numerous studies to examine the stock market reaction to firm specific environmental news that signalsFootnote8 changes in its environmental performance. This approach mitigates against questions of causality and some data concerns by examining the stock market reaction to the release of new information. Empirical evidence from this stream of literature has also been contradictory with findings of both a positive and negative relationship.Footnote9 Flammer (Citation2013) highlights that the value of environmental performance depends on time-variant external pressures and internal factors such as the firm’s historical environmental performance. This indicates that one possible reason for the divergence of the previous empirical research in the area is a lack of contextualisation and supports the need for a contextualised investigation of the relationship. Our research extends the line of investigation into the link between environmental performance and financial performance with a consideration of the impact of the time-variant external pressures of the EU ETS which may alter the perceived materiality of emissions information.
2.3. The EU ETS, environmental news and financial performance
The theoretical relationship between the EU ETS and participating firm’s financial performance could be based on its impact on real cash flows or by changing the expected returns taking that asset values are determined by expected discounted cashflows (Williams Citation1938). First, because EUA are a factor of production for participating firms, higher EUA demand or prices increase the cost of current and future production, reducing future cash flows, earnings, and dividends. This cost effect would imply a negative relationship between a firm’s EUA requirements revealed during emissions verification events and financial performance. Secondly, the EU ETS could impact the risk premium component of a firm’s discount rate incorporating a level of regulatory risk (Grosjean et al. Citation2016) that would not have been present otherwise. Improved current performance could signal a reduction in future carbon related regulatory risks, boosting financial performance. Indeed, Wen, Bouri, and Roubaud (Citation2017) discuss the need for firms to have risk management strategies for carbon risk and investigate whether energy-related futures can be used to hedge EUA price risk.
Brouwers et al. (Citation2016) implement an event study methodology to investigate the value relevance of emissions verification announcements on the participating firms in the first two phases of the EU ETS and find that the first publication of compliance data for each phase resulted in a statistically significant abnormal market reaction while the remaining years had no impact. They attribute these findings to the market’s perception that there would be a scarcity of allowances during each of these phases which failed to materialise. The first announcement contained new information about the performance of participating firms that was perceived to be value relevant due to the anticipation of allocation scarcity and resulting high prices. Hence, the perception of future scarcity and the increased price of carbon liabilities was a key driver of the market reaction during these first announcement. Our research extends Brouwers et al.'s (Citation2016) study by examining the value relevance of emissions verification announcements in the third phase of the EU ETS. Additionally, we extend existing research by examining the market reaction to the firm-specific positive or negative news contained within the announcements using an absolute, industry-relative and expectations-based measure to categorise it. In order to examine the value relevance of the environmental news contained within the announcements during the third phase of the EU ETS, we test the following hypotheses:
H1: The release of positive (negative) environmental news about firms participating in the EU ETS triggered positive (negative) market reactions during Phase 3.
We also use sub period analysis to examine the effects of changes to perceived stringency of the EU ETS brought about by the announcement of structural changes in the Phase 4 reforms. In order to examine whether these change which altered the EUA market dynamic also altered the incentives created by the system for firms to reduce their carbon emissions, we test the following hypothesis:
H2: Changes in the perceived stringency of the EU ETS due to the announcement of the reforms for Phase 4 caused a significant difference in the market reactions to environmental news about ETS participating firms during Phase 3a and 3b of the EU ETS.
3. Data and methodology
3.1. Data
In order to investigate how the publication of verified emissions in the EU ETS affected stock prices of participating firms during Phase 3, we analyse market reactions on 8 annual event dates between 2014 and 2021. We investigate this period in particular as major reforms, designed to address previous shortcomings and inefficiencies that beset the ETS during its first and second phases, were enacted during this time. We analyse the stock market reactions of the European listed firms with installations covered by the EU ETS during this period. From the beginning of the third trading period, the monitoring and reporting of greenhouse gas emissions was required to be in line with the EU Monitoring and Reporting regulations to ensure that the monitoring, reporting and verification of emissions is complete, consistent, accurate and transparent (European Commission Citation2015b). The preceding year’s verified emissions data for all firms are simultaneously published on the Commissions website. The publication of Phase 3 emissions data took place on the 1st (2014, 2015, 2016, 2019, 2020, 2021) or 3rd (2017, 2018) of April each year, corresponding to 8 event dates. Two types of data are available for each installation; the number of free allowances allocated to it and its verified emissions for a given year.
3.1.1. Sample selection
As our study seeks to explore the stock market reaction to EU ETS verification events during the third phase of the system, our study contains European listed firms with installations covered by the EU ETS during the period. We matched the emissions data from the Union registry, provided by the Carbon Market Data database,Footnote10 to financial data from Refinitiv DataStream. The installation level emissions and allowance allocation data provided on the Community Independent Transaction Log by the European Commission was matched to firms which resulted in a sample of 123 publicly traded firms covering 4139 installations in our sample. As 16,061 installations have been covered by the EU ETS since its inception, this represents 25.8% of the total number of installations. However, these 25.8% of installations accounted for 45.43% of the total verified emissions in the entire EU ETS for 2020. Our sample is heavily weighted towards five countries (Germany, France, Italy, Spain and Great Britain) which contain 57% of firms and 64% of installations. However, these countries account for 54% of installations covered by the EU ETS which shows that our sample is similarly structured to the overall sample.
Table presents the industry composition of the firms in our sample. Firms operating in the sectors Utilities, Basic materials and Energy constitute the majority of our sample as is to be expected as these are the main sectors covered by the EU ETS. Utilities dominate in the amount of carbon emissions created by the sector at 52% of the sample, but also of note is the allowance deficit in this sector of 92.95%, meaning that firms in this sector are emitting almost double the amount of GHGs for which they hold EUAs. This large deficit represents a clear break with the previous two phases of the EU ETS in which 56.24% (Phase 1) and 47.90% (Phase 2) of free allowances were allocated to the Utility sector which was responsible for 60% of verified carbon emissions (Brouwers et al. Citation2016). In aggregate, all sectors except Industrials and Basic Materials have a deficit in allowances during Phase 3 which is contrary to the finding of research on the previous phases in which only Utilities firms were found to be in deficit (Brouwers et al. Citation2016). This change is evident in Figure which shows a marked change in deficits between allowances and emissions for the firms in our sample between the earlier and later stages of the EU ETS. Figure compares the number of EU ETS allowances to the number of verified emissions for the firms in our sample in each year from the beginning of Phase 1 in 2005 to the end of Phase 3 in 2020. There is a clear pattern of an increased allowance deficit from 2013 onwards, which corresponds to the beginning of Phase 3.
Figure 2. Allocated allowances and verified emissions of sample firms from Phase 1 to Phase 3 of the EU ETS.
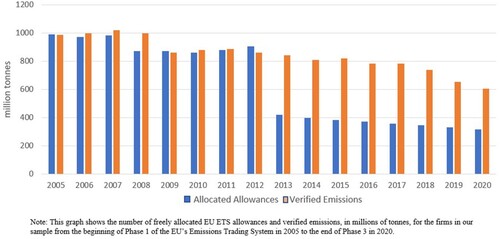
Table 1. Sample firms by industry and country.
3.2. Methodology
3.2.1. Event study methodology
Stock market event studies are based on the Efficient Market Hypothesis and the premise that stock markets operate efficiently by reflecting current information and expectations (Hamilton Citation1995). The new information contained within an event will be incorporated into stock prices depending on how it is interpreted by the majority of investors guided by their beliefs about its relevance/materiality (having a positive or negative effect) or irrelevance/immateriality to company value (Fama Citation1991). The magnitude and direction of the reaction indicating the evaluation of its impact on the firm’s future financial performance by market actors. However, Lo's (Citation2004) ‘Adaptive Market Hypothesis' highlights that the interpretation of the relevance/materiality of a piece of information may also evolve over time as markets adapt to changes in the market environment. An evolving financial ecosystem can alter how factors such as environmental performance are reflected in financial valuations. Therefore, the relationship between environmental and financial performance may be contingent on the context. Hence, an examination of similar events in different contextual settings offers insights into how context shapes the materiality of information to market actors. Event studies have been widely applied in studies of stock market responses to negative and positive information (Burton, Kumar, and Pandey Citation2020) such as corporate social responsibility and irresponsibility (Groening and Kanuri Citation2018), corporate crime (Song and Han Citation2017), and EUA trading behaviour (Guo et al. Citation2018).
We use an event study methodology to analyse the impact of the 8 EU ETS emissions verification announcements on stock market returns of participating firms during the third phase of the system. Following the event study literature (Krüger Citation2015; Loipersberger Citation2018), we derive the expected returns for the event period using a standard market model in accordance with MacKinlay (Citation1997) that is estimated over 200 trading days ending 20 days prior to the event date for the 8 emissions verification events. A single factor model is chosen as the gains from employing multifactor models for event studies are limited (MacKinlay Citation1997).Footnote11 We then calculate the abnormal returns over the event window to examine whether the event had a significant impact on stock prices. To estimate the expected stock returns, the daily stock returns of firm i are regressed on the market returns over the estimation window (day −220 to day −21):
Where Rit is the return on stock i on day t and Rmt is the market returns on day t.
, a constant term for firm i, and
, the slope of the characteristic return of firm i, are OLS estimates, and
is the error term. We use the benchmark country indices for each country, as listed in Table , as our market proxies to estimate the relationship between individual stock returns and the market within the estimation period. The abnormal returns (AR) for stock i on day t is given by
The stock prices used to calculate the abnormal returns are the daily closing prices as these should reflect the impact of the event on day zero. To estimate the total impact of the event over the entire event window, the daily abnormal returns are aggregated into the cumulative abnormal return (CAR) for stock i.
Where
and
denote the beginning and end of the event window.
As the focus of our research is on the aggregate effect of the event on participating firms as opposed to a single firm, we estimate the average abnormal return (AAR) across all firms:
The average abnormal return is then aggregated into the cumulative average abnormal returns (CAARs) to capture the total impact of the multiple observations across the entire event window:
We use the following event windows to capture possible leaks in information and to reflect possible delays in the incorporation of the information into the stock price: (−1, + 1), (0, + 1), (0, + 2), (0, + 3) and (0,+4). We implement a short event window to minimise confounding effects (McWilliams and Siegel Citation1997) but allow some time for the information to influence investors decisions and trigger a market reaction due to the complex nature of the information. A relatively short event window also essentially eliminates the effect of company characteristics such as size, profitability or leverage, which were already known and were unlikely to change substantially over a very short period (Adamska and Dąbrowski Citation2021).
We assess the event date abnormal returns for statistical significance relative to the distribution of abnormal returns in the estimation period. One common method is to test for statistical significance using paramedic tests that assume abnormal returns are normally distributed (Corrado Citation2011). However, the fact that the validity of the test depends critically on the assumption that stock returns are normally distributed has spurred the development of non-parametric tests which rely on no such assumption and avoid imprecise inference in the presence of non-normally distributed security returns. Campbell and Wesley (Citation1993) find that the non-parametric rank test by (Corrado Citation1989) was well specified with Nasdaq data while parametric event study tests were poorly specified. Furthermore, Corrado and Truong (Citation2008) find that the rank test introduced in Corrado (Citation1989) and further adjusted for cross-sectional variance in Corrado and Zivney (Citation1992) has the best specification overall with United States and Asia Pacific market returns data.
Additionally, cross sectional correlation may lead to downward-biased estimates in the standard errors of regression coefficients and consequently overstated t-statistics when the event takes place at the same time for all firms (Brouwers et al. Citation2016). As verified emissions announcements are simultaneous across all firms, we mitigate the impact of cross-sectional correlation and event induced volatility (Corrado and Zivney Citation1992) in addition to reducing the possibility of misspecification from the presence of non-normally distributed data by using the non-parametric rank test adjusted for cross-sectional variance in Corrado and Zivney (Citation1992) to test the significance of the events in this study.
For our first hypothesis, we examine whether a market reaction is triggered in the stocks of publicly traded EU ETS participating firm when new information about their demand for EUAs is published. As the sign of the reaction is irrelevant to both hypotheses, we test whether cumulative average abnormal returns are significantly different from zero. Once our research has examined the relevance of these event, we analyse the effect of environmental news (Positive and Negative) and test the null hypothesis of no price reaction against a signed alternative in the remaining models.
3.2.2. Categorisation of firms by environmental performance news
In order to investigate the market reaction to the heterogeneous changes in environmental performance of participating firms, we categorise the firm-specific information released on the verification event date as positive or negative news using three methods; 1. Absolute Environmental Performance – the change in a firm’s allowance surplus/deficit which can also be expressed as the increase or decrease in their uncovered carbon liability, 2. Industry-Relative Environmental Performance – the change in a firm’s industry-relative allowance surplus/deficit, and 3. Expectations-Relative Environmental Performance – the change in a firm’s verified emissions and relative to expectations.
As Clarkson et al. (Citation2015) find that market participants pay attention to a firm’s uncovered carbon liability, the amount of emissions that exceed free allowances, as opposed to its absolute level of emissions within the EU ETS, we measure Absolute Environmental Performance as the change in a firm’s allowance surplus since the previous year with firms categorised as positive or negative based on the sign of the change (1).Footnote12 The news from the absolute measure entails both an immediate direct financial cost for the firms as a firm with negative performance would have to increase their purchase of EUA’s to cover the increased carbon liability (or have fewer EUAs to sell) and also signalling an increase in future carbon liabilities.
Firms’ internal and industry characteristics may also impact the perspectives taken by investors on the relevance of our environmental performance news. A firm’s emissions reduction performance should be judged against the performance of others in the same industry as the availability of carbon mitigation measures, carbon intensity, regulatory constraints, asset composition, the composition of cashflows for investments etc. are industry specific. Additionally, the ability of a firm to pass on the carbon compliance costs may also rely on its industry relative carbon performance with the most carbon efficient firms being able to pass on a larger proportion of the cost without becoming un-competitive. Hence, positive (negative) news of a reduction (increase) in the relative size of a firm’s EUA or carbon liability represents an increase (decrease) in its relative carbon efficiency and competitiveness. Industry-Relative Environmental Performance is measured as the change in a firm’s industry relative allowance surplus/deficit since the previous year with firms categorised as positive or negative based on the sign of the change (2).Footnote13
Gupta and Goldar (Citation2005) note that the provision of new information about the carbon performance of a firm may cause abnormal changes in its stock price when the information deviates from investor’s expectations and is perceived to impact profitability. Hence, absolute changes in emissions may matter less if these changes were expected and hence already included in the stock price previous to the event. Hence, we compare a firm’s change in emissions in a given year to the change in emissions that may be expected based on the historical verified emissions changes of the firm. We create a measure of Expectations-Relative Environmental Performance which is the average percentage verified emissions reduction over the previous five years (3). The standard deviation of the percentage emissions reduction is also calculated over the same five-year period and firms are classified into one of four groups based on their observed performance relative to our measure of expectations in a given year. Firms which perform worse than their average performance over the previous five years (expectations) are categorised into two groups, firm with negative performance within one standard deviation of expectations are classified as negative while firms with a negative performance greater than this are classified as very negative. The same method of classification is applied to positive firms. The use of these groupings allows us to examine whether more extreme deviations from expectations elicit more pronounced market responses.
In Table we describe how we create each of these 3 measures. In Table , using the categorisations of each of the measures created above, we show the performance of our sample firms within different industries over the period covered by Phase 3, 2013–2020.
Table 2. Description of the Environmental Performance Measures.
Table 3. Performance Measures by Industry.
In order to test our second hypothesis which relates to the impact of the changing dynamics of the market between Phase 3a and Phase 3b, we split our sample into two periods as changes in the structure of the EU ETS system may alter investors perception of the future cost of emissions and benefits (drawbacks) of good (poor) environmental performance. The first sub period is classified as the Phase 3a and includes the publication of data for the years 2013–2016 which were release in the years from 2014 to 2017. The second subperiod is classified as Phase 3b and includes the publication of data for the years 2017–2020 which were release in the years from 2018 to 2021.
4. Findings
4.1. Market reactions to the EU ETS verification events
In this section we examine the market reaction to EU ETS emissions verification events for publicly traded participating firms. We start by examining the overall market reaction by year over four event windows ranging from (−1, + 1) to (0, + 4) for each publication of Phase 3 data. We then examine the market reaction to the publication of information about a firm’s verified emissions across the entire period and over our two sub periods.
Table lists the cumulative average abnormal returns (CAARs) for the 8 different verification event dates of the EU ETS for Phase 3 (2013–2020). The results indicate that stock prices only react significantly to the publication of 2018 emissions data in 2019 and to 2019 emissions data in 2020. The publication event in 2019 resulted in a positive and significant market reaction for participating firms across four of the five event windows with CAARs ranging from 0.8% to 1.3%. The positive market reaction may be attributed to the overall positive performance of the participating firms who reduced their emissions by 5.7% compared to the previous year’s publication which represented the largest drop in emissions up to that point in Phase 3. In 2020, the market reaction was positive and significant across all event windows with CAARs ranging from 1.4% to 2.6%. The overall reduction in emissions from the previous year was substantial at 11.1% with the COVID crisis a probable cause for the outsized reduction. However, as this reduction coincides with a reduction in the required expenditure on EUAs for the firms involved, markets reacted positively to the reduction in this liability. In 2021, no significant market reaction is registered across all event windows even though the overall decrease in emissions reported was −7.8%. However, the average reduction in firm level emissions reported in 2021 was a less substantial −2.6% which may account for the insignificant market reaction and highlights the importance of considering firm-level emissions measures when analysing the market reaction to these events.
Table 4. Event Study Results for EU ETS Emissions Verification Event Dates.
4.2. Firm-Specific performance news
The above analysis examines the entire sample of firms without considering the heterogenous nature of the firm-level information that was revealed. Hence, the overall CAARs reported above may be subdued as they represent the average market reaction to both positive and negative firm level news. To gain further insight into the market reaction to these events, we segregate the sample based on whether the published verified emissions data represented positive or negative news about each firm’s environmental performance. This allows us to investigate whether firms are rewarded with higher returns for a reduction in their carbon liabilities and/or carbon emissions and vice versa. We use the categorisations listed in Table , to differentiate between positive and negative news, for each of our three measures; Absolute Performance, Industry-Relative Performance, and Expectations-Relative Performance.
Table presents the cumulative average abnormal returns over three event windows (0,1), (0,2) and (0,3) for firms in our sample categorised by their Absolute and Industry-Relative performance in Phase 3 and for the two sub periods, Phase 3a and 3b.Footnote14 Panel A presents our findings for the entire sample and shows that positive absolute performance is on average rewarded by a 0.3% and 0.5% increase in returns over a three-day and four-day event window respectively at a 10% level of significance. Conversely, negative absolute performance which represents an increase in the firm’s carbon liability has no corresponding negative effect on returns. This asymmetric market reaction is mirrored in our findings when industry-relative performance is used with positive news resulting in a positive market reaction over a two-day window at a 10% level of significance while all others are insignificant. The lack of symmetry in the reaction to the emissions performance may indicate that markets are not just reacting to the increased/reduced current carbon liability but also to the signalling effect that positive performance may entail.
Table 5. Absolute and Industry-Relative Environmental Performance.
In Panels B and C of Table , we test the market reaction to absolute and relative performance in the two subsamples and find clear divergence in our results. In Panel B, we find a lack of significance across all measures and event windows during Phase 3a from 2013 to 2017. This indicates that a firm’s level of absolute and relative performance during this period was not considered relevant/material information to firm valuation. In contrast, significant market reactions are present in Phase 3b. For both positive and negative absolute performance, we find positive CAARs that range from 0.39% to 0.42% for negative performers and from 0.68% to 1.2% for positive performance. The larger increase for firms with positive performance could be attributed to their reduction in carbon liabilities in addition to the signalling effect of increased future performance. However, the positive impact of negative absolute performance defies this interpretation and may point to the importance of judging performance on a relative basis due to the continual reductions in the EUA free allocations over the period.
The relative performance measure in phase 3b provides a clearer picture with positive performance resulting in positive returns across all event windows with CAARs ranging from 0.42% to 0.98% at various levels of significance while negative performance results in non-significant returns. The lack of symmetry in the reaction to the emissions performance mirrors the findings of the full sample and lends further support to the conjecture that the relationship is driven by more than just the implied cost of carbon liabilities. These findings highlight stark differences between the two periods of Phase 3 and point to the increased value-relevance of positive performance in Phase 3b. This supports our second hypothesis that the verification events during Phase 3a and Phase 3b of the EU ETS triggered different market reactions to environmental performance news. It also lends support to the findings of Jia et al. (Citation2020) regarding a structural break in the EU ETS in the middle of phase 3 by highlighting that it not only altered the price dynamics of EUAs but also the perception of market actor on the financial implications of positive environmental performance.
In Table , we categorise the information released on the event dates by the change in emissions relative to expectations with firms grouped by the degree of the deviation from the expected change, using the categorisations listed in Table . Panel A of Table displays the results of our analysis of the impact of deviations from expected performance for the entire sample. We find a significant negative market reaction occurring for firms with very negative news about their change in emissions relative to expectations, across a three- and four-day window at a 10% level of significance and CAARs ranging from −0.45% to −0.5%. The group with very positive news displays the opposite relationship with positive CAARs ranging from 0.33% to 0.73% registered across a three- and four-day event window at a 10% and 5% level of significance respectively. The other two groups, representing 66.8% of the sample, display a near identical relationship with positive CAARs of similar magnitudes but with a greater level of significance for the negative group. While it might be expected that negative performance would elicit a negative market response, the fact that the performance is within one standard deviation of expectations may reduce its impact.
Table 6. Emissions Reduction Performance Relative to Expectations.
Panels B and C of Table investigates whether the market reaction differs between Phase 3a and 3b. As with our previous analysis, a clear difference between the two periods can be observed with the level of performance in Phase 3a being inconsequential across all groups and event windows. This contrasts with an increased impact in terms of strength and significance across many of the groups in Phase 3b. We find a stronger market reaction for firms with both very positive and very negative news. Very negative news on average results in a −0.82% CAAR across a two-day event window at a 5% level of significance and a −0.73% CAAR across a three-day window at a 10% level of significance. Very positive news also resulted in more pronounced gains with a CAAR of 0.5% at a 5% level of significance for a two-day event window increasing to 1.2% at a 1% level of significance across a 4-day event window. As with the full sample, the two middle groups display positive CAARs, although of slightly greater size and significance.Footnote15
These results compound the observation resulting from our previous analysis of the importance of considering the two periods separately due to a change in the EUA market dynamics (Jia et al. Citation2020) which have altered the market perception of the value of participating firms’ carbon emissions. This lends further support to our second hypothesis. They also highlight that major deviations from expectations during the latter period resulted in positive and negative market reactions which indicates that firms are rewarded when they make major improvements to their carbon efficiency and suffer losses when they underperform expectations by a substantial amount. This confirms the finding of previous studies related to the positive relationship between environmental news and stock returns (Capelle-Blancard and Laguna Citation2010; Capelle-Blancard and Petit Citation2019; Flammer Citation2013) and may be the most comparable measure of performance to these studies as they examine the effect of substantial news such as environmental awards or disasters which would be akin to very positive or negative news. However, the inconsistency between the two sub periods in our sample highlights the importance of institutional context and external pressures on the valuation of environmental performance which is also found to be a significant factor in other financial market contexts (Chiaramonte et al. Citation2021).
Our findings suggest that the emissions verification event only became relevant to the equity investors of participating firms in Phase 3b. Two possible inter-related explanations could possibly account for this change in significance, the increased direct carbon liability due to the higher EUA price and an increase in the market expectations of future environmental regulatory stringency. As the EUA price was found to be driven by political considerations with the expectation of weaker regulations depressing the price in the Phase 3a period, the reverse market sentiment may be present in the Phase 3b period. Hence, improved current emissions reduction performance would signal a positive trajectory for the firm into a future of stricter environmental regulations. The asymmetric nature of our findings related to the treatment of performance may point to the greater importance of the second factor as an increased direct current carbon cost should weigh equally for positive and negative performance.
5. Conclusion
This research examines the evolving impact of the EU ETS on the valuation of participating firms by examining whether events that contain demand information about the market and its participants provoke an equity market reaction in the days following the announcements. As incremental managerial decisions and actions related to a firm’s environmental performance are not easy to observe and evaluate (Klassen and McLaughlin Citation1996), a single discrete event can signal these changes and alter the market’s perception of performance. Hence, we use an event study methodology to gauge the markets interpretation of firm specific emissions related environmental news during Phase 3 of the system. The publication of verified emissions for participating firms represents news which can be positive or negative depending on their performance, therefore our research contributes to the body of research which examines the stock market reaction to environmental news (Capelle-Blancard and Petit Citation2019; Flammer Citation2013; Lioui and Sharma Citation2012; Oberndorfer et al. Citation2013). We also examine whether changes to the EU ETS altered the market reaction to firm-specific environmental performance news by splitting our sample into two periods during Phase 3.
Our findings suggest that the emissions verification event only became relevant to equity investors in participating firms in the latter Phase 3b period beginning in 2018. Two possible inter-related explanations could account for the change in significance between the two periods – the increased direct cash flow effect of their carbon liability due to the higher EUA price and an increase in the market expectations of future environmental regulatory stringency which embedded political risk in participating firms’ discount rate. The turning point between these periods has been linked to the announcements of the revision to the system for Phase 4 of the system which may have altered the actual and perceived future EUA scarcity (Bruninx et al. Citation2019). The introduction of the market stability reserve’s cancellation policy as part of the Phase 4 revisions increased the perception of scarcity by reducing the overall cap and puncturing the waterbed (Gerlagh, Heijmans, and Rosendahl Citation2020). The introduction of these reforms also demonstrated that the oft questioned political will to tackle climate change in the EU was present which increased the probability of future price increasing regulatory intervention (Salant Citation2016). Our findings indicate that these changes altered the equity markets perception of the materiality of carbon emissions news to financial performance, aligning the incentives these markets create with the intended purpose of the EU ETS.
The asymmetric nature of our findings, for positive and negative changes in absolute and industry relative emissions, may point to the greater importance of the signalling that positive performance implies as an increased direct current carbon cost should weigh equally for positive and negative performance. A symmetric relationship between emissions reduction news and returns was only found for large positive and negative changes relative to expectations, confirming previous findings (Capelle-Blancard and Laguna Citation2010; Capelle-Blancard and Petit Citation2019; Flammer Citation2013). However, the inconsistency between the two sub periods in our sample provides an explanation for the inconsistences in previous research investigating the impact of environmental news on stock returns (Wang et al. Citation2019) by highlighting the importance of institutional context and external pressures on the relationship.
Our research extends previous research on the EU ETS which evaluated its impact on the financial performance of publicly traded participating firms in Phase 1, Phase 2 and the first half of Phase 3 of the ETS (Andreou and Kellard Citation2021; Brouwers et al. Citation2016; Jong, Couwenberg, and Woerdman Citation2014). The operation of Phase 3 of the ETS differs considerably from previous phases and this study is, to the best of our knowledge, the first to examine how these changes impact the market reaction to the publication of verified emissions data of participating firms. Additionally, previous research on the impact of EU ETS publication events on firm returns examined the divergent reactions of categories of firm such as firms with more or less emissions than allocated, lower or higher emissions shortage compared to an industry median or, a high or low level of carbon intensity (Brouwers et al. Citation2016; Jong, Couwenberg, and Woerdman Citation2014). This research contributes a unique approach by examining the divergent reaction of firm returns based on the nature of the firm-specific emissions-related news, that is whether positive or negative, including the change in a firm’s emissions surplus, industry-relative emissions surplus and emissions relative to previous years which is unique in the literature.
This paper makes a major policy-related contribution by highlighting the increased effectiveness of the EU ETS in shaping the market reaction to news about emissions-related environmental performance. It provides policy makers with an evaluation of the incentives created by the EU ETS over its third phase which can inform the revisions and design of other Cap-and-Trade systems. In particular, it highlights the importance of a mechanism to make Cap-and-Trade systems robust to external shocks to reduce uncertainty about the future strictness of the system. The introduction of the Market Stability Reserve with a cancellation policy provided this mechanism for the EU ETS and resulted in the system achieving its intended objective of providing a financial incentive for firms to reduce their emissions. It also highlights the importance of perceived political will in shaping market outcomes. The announcement of the EU ETS reforms dispelled the perception of a lack of political will to make the system effective. The announcement of the reforms rather than enactment of reforms had an immediate impact on the pricing dynamics, bringing forward the impact of future policy changes. Policy makers should be aware, not only of the effect of announcements of reforms on market valuations, but also of the effect of expected changes in the institutional context and external pressures on the valuation of environmental performance in financial markets.
Our research also provides some insight into the EU ETS for participating firms by highlighting the increasing market attention to emissions data with news of positive environmental performance increasing returns in more recent years. This may inform firms’ future investment decisions, stimulating long-term investment decisions in low-carbon technologies, if announcements of reductions in their carbon liability are positively reflected in market returns. The announcement of these investment decisions may have positive implications for the risk premium expected by investors. Our findings also highlight the increased exposure of participating firms to political risk and expected policy changes which should be considered in their strategic planning and investment decisions.
Our sample is limited to publicly traded firms that emit close to half of the emissions covered by the scheme, this means that the impact of the system on smaller privately held or governmental firms is absent from our analysis. Future research could investigate whether the financial incentives created by the system are the same for non-listed participating firms.
While our study examines the impact of firm emissions reduction performance on market reactions, other firm and industry characteristics could moderate the reaction to news related to environmental performance which presents fertile ground for future research in the area. Additionally, a key finding of this study is the context specific nature of the incentives created by the system which belies that fact that the nature of the incentives will change as the EU ETS and the environmental policy environment continues to evolve further. Further research will be required to examine the incentives created by the EU ETS in later stages of its development.
Disclosure statement
No potential conflict of interest was reported by the author(s).
Additional information
Notes on contributors
Benjamin Lynch
Benjamin Lynch is an Assistant Professor of Finance at Technical University Dublin.
Martha O’Hagan-Luff
Martha O'Hagan-Luff is an Associate Professor of Finance at Trinity Business School, Trinity College Dublin.
Notes
1 The EU ETS has developed through a number of Phases governed by an evolving set of rules and regulations. Phase 3 (2013–2020) introduced major structural changes to the system as compared to Phases 1 (2005–2007) and Phase 2 (2008–2012) while the current Phase 4 (2021–2030) involves a further tightening of the system.
2 Using an event study methodology, we investigate the market reaction to a number of political events relating to the revisions of the system which we identify as a possible inflection point between the two periods and find evidence of a significant market reaction. This further supports the rationale behind an examination of the two periods. Results available on request.
3 The quantity of allowances that will result in the overall level of emissions equalling the cap is distributed via free allocations and a primary EUA market based on auctioning. Participating firms must surrender one EUA for every tonne of GHGs emitted in a given year or pay a fine. Firms with a deficit (surplus) of EUA to cover their emissions can also buy (sell) them in the secondary EUA market.
4 The MSR is a rules-based mechanism that is intended to address the imbalances between supply and demand in the market by adjusting auction volumes in response to allowance surplus thresholds (Vivid Economics Citation2020).
5 According to economic theory, price formation in the EU ETS should be driven by supply and demand derived market fundamentals such as coal and gas prices as well as economic activity that impact the marginal abatement cost and stringency of the cap (Friedrich et al. Citation2020). However, a review of the empirical literature by Friedrich et al. (Citation2020) concludes that fundamental price drivers such as these have relatively little explanatory power and that the price is driven by other factors.
6 As the verified emission data from the EU ETS that is released each year relates to the previous year, Phase 3a includes the verification events occurring in 2014, 2015, 2016 and 2017 which reports the emissions data for 2013, 2014, 2015, and 2016 respectively. Phase 3b includes the verification events occurring in 2018, 2019, 2020 and 2021 which report the emissions data for 2017, 2018, 2019, and 2020 respectively.
7 The use of emission data from the EU ETS has the advantage of being verified by a third party which negates some of these objectivity concerns as well as leakage concern related to the environmental news event study stream of literatures use of the inclusion in sustainability indexes or environmental awards as environmental news in their studies.
8 Stock splits are an oft-used example of the signalling effect of events as they should be irrelevant to valuation but have been found to result in a positive stock market response due to the signal of higher future earnings that markets perceive them to convey (McNichols and Dravid Citation1990).
9 More recently, researchers have focused on the impact of news related to a firms sustainability, inclusive of environmental performance, on stock returns by examining the market reaction to inclusion and exclusion in sustainability indexes (Adamska and Dąbrowski Citation2021). This line of investigation has also resulted in substantial heterogeneity of results. Adamska and Dąbrowski (Citation2021) propose that one reason for the divergence in the finding is related to the institutional environment.
10 Carbon Market Data is a carbon market research company and data vendor.
11 Alternatively, the Fama-French French Three-Factor model using European factors was used to generate abnormal returns. The results of the event studies using these estimates are comparable to the single factor model. Results available on request.
12 We calculate a firm absolute surplus or deficit of allowances as a percentage of its total emissions covered by its free allowances. Absolute Surplus = (Free Allowances- Verified Emissions)/Verified Emissions.
13 A firm’s industry relative allowance surplus is calculated by subtracting the average industry surplus from the firm’s allowance surplus/deficit in a given year. The average industry surplus/deficit is created by combining average activity-level emissions and allocated allowance data in proportion to the number and type of installations for each firm.
14 We also tested the relationship over (−1,1) and (−1, 0) which were found to be insignificant and may indicate a lack of information leakage prior to the event and a delayed response in its incorporation into the market price. Additionally, a (0,4) window was also implemented with insignificant reactions across most models. Results are available on request.
15 The similarity of the two middle groups which are within one standard deviation of expectations may be impacted due to the variance within this group. In order to increase the robustness of our study, we further disaggregate our sample and rerun the analysis. We create an additional group which we categorise as ‘Expected’ and includes the firms that were close to expected performance (−1/2 standard deviation: +1/2 standard deviation) and reduce our Negative and Positive groups to those firms that had negative/positive performance greater than 1/2 standard deviations and less than or equal to 1 standard deviation below/ above expectations. The Negative group’s CAARs become insignificant in Phase 3b, while the Positive group have a negative CAAR of 1.8% at a 10% level of significance across a four-day window and positive CAARs of 0.88% and 0.97% at a 5% level of significance across a two- and four-day event window respectively. Surprisingly, the firms in the Expected group also registered positive CAARs of 0.8% in Phase 3b across a three- and four-day event window at a 5% level of significance. Results available on request.
References
- Abrell, J., A. Ndoye Faye, and G. Zachmann. 2011. Assessing the Impact of the EU ETS Using Firm Level Data. Bruegel Working Paper.
- Adamska, A., and T. J. Dąbrowski. 2021. “Investor Reactions to Sustainability Index Reconstitutions: Analysis in Different Institutional Contexts.” Journal of Cleaner Production 297: 1–17. doi:10.1016/j.jclepro.2021.126715.
- Andreou, P. C., and N. M. Kellard. 2021. “Corporate Environmental Proactivity: Evidence from the European Union’s Emissions Trading System.” British Journal of Management 32 (3): 630–647. doi:10.1111/1467-8551.12356.
- Brouwers, R., F. Schoubben, C. Van Hulle, and S. Van Uytbergen. 2016. “The Initial Impact of EU ETS Verification Events on Stock Prices.” Energy Policy 94: 138–149. doi:10.1016/j.enpol.2016.04.006.
- Bruninx, K., M. Ovaere, K. Gillingham, and E. Delarue. 2019. “The Unintended Consequences of the EU ETS Cancellation Policy.” Energy Systems Integration & Modeling Group Working Paper Series No. EN2019-11.
- Burton, B., S. Kumar, and N. Pandey. 2020. “Twenty-five Years of The European Journal of Finance (EJF): A Retrospective Analysis.” The European Journal of Finance 26 (18): 1817–1841. doi:10.1080/1351847X.2020.1754873.
- Busch, T., and G. Friede. 2018. “The Robustness of the Corporate Social and Financial Performance Relation: A Second-Order Meta-Analysis.” Corporate Social Responsibility and Environmental Management 25 (4): 583–608. doi:10.1002/csr.1480.
- Bushnell, J. B., H. Chong, and E. T. Mansur. 2013. “Profiting from Regulation: Evidence from the European Carbon Market.” American Economic Journal: Economic Policy 5 (4): 78–106. doi:10.1257/pol.5.4.78.
- Campbell, C. J., and C. E. Wesley. 1993. “Measuring Security Price Performance Using Daily NASDAQ Returns.” Journal of Financial Economics 33 (1): 73–92. doi:10.1016/0304-405X(93)90025-7.
- Capelle-Blancard, G., and M.-A. Laguna. 2010. “How Does the Stock Market Respond to Chemical Disasters?” Journal of Environmental Economics and Management 59 (2): 192–205. doi:10.1016/j.jeem.2009.11.002.
- Capelle-Blancard, G., and A. Petit. 2019. “Every Little Helps? ESG News and Stock Market Reaction.” Journal of Business Ethics 157 (2): 543–565. doi:10.1007/s10551-017-3667-3.
- Chiaramonte, L., A. Dreassi, C. Girardone, and S. Piserà. 2021. “Do ESG Strategies Enhance Bank Stability During Financial Turmoil? Evidence from Europe.” The European Journal of Finance 28 (12): 1–39. doi:10.1080/1351847X.2021.1964556.
- Christensen, A., A. Arvanitakis, K. Tangen, and H. Hasselknippe. 2005. “Price Determinants in the EU Emissions Trading Scheme.” Climate Policy 5 (1): 15–30. doi:10.1080/14693062.2005.9685538.
- Christiansen, A. C., and J. Wettestad. 2003. “The EU as a Frontrunner on Greenhouse gas Emissions Trading: How did it Happen and Will the EU Succeed?” Climate Policy 3 (1): 3–18. doi:10.3763/cpol.2003.0302.
- Clarkson, P. M., Y. Li, M. Pinnuck, and G. D. Richardson. 2015. “The Valuation Relevance of Greenhouse Gas Emissions Under the European Union Carbon Emissions Trading Scheme.” European Accounting Review 24 (3): 551–580. doi:10.1080/09638180.2014.927782.
- Convery, F. J. 2009. “Origins and Development of the EU ETS.” Environmental and Resource Economics 43 (3): 391–412. doi:10.1007/s10640-009-9275-7.
- Corrado, C. J. 1989. “A Nonparametric Test for Abnormal Security-Price Performance in Event Studies.” Journal of Financial Economics 23 (2): 385–395. doi:10.1016/0304-405X(89)90064-0.
- Corrado, C. J. 2011. “Event Studies: A Methodology Review.” Accounting & Finance 51 (1): 207–234. doi:10.1111/j.1467-629X.2010.00375.x.
- Corrado, C. J., and C. Truong. 2008. “Conducting Event Studies with Asia-Pacific Security Market Data.” Pacific-Basin Finance Journal 16 (5): 493–521. doi:10.1016/j.pacfin.2007.10.005.
- Corrado, C. J., and T. L. Zivney. 1992. “The Specification and Power of the Sign Test in Event Study Hypothesis Tests Using Daily Stock Returns.” Journal of Financial and Quantitative Analysis 27 (3): 465–478. doi:10.2307/2331331.
- De Clara, S., and K. Mayr. 2018. “The EU ETS Phase IV Reform: Implications for System Functioning and for the Carbon Price Signal.” Oxford Energy Insight.
- Du, S., W. Tang, and M. Song. 2016. “Low-carbon Production with low-Carbon Premium in cap-and-Trade Regulation.” Journal of Cleaner Production 134: 652–662. doi:10.1016/j.jclepro.2016.01.012.
- Edenhofer, O. 2014. “Climate Policy: Reforming Emissions Trading.” Nature Climate Change, 4 (8): 663–664. doi:10.1038/nclimate2327.
- Endrikat, J., E. Guenther, and H. Hoppe. 2014. “Making Sense of Conflicting Empirical Findings: A Meta-Analytic Review of the Relationship Between Corporate Environmental and Financial Performance.” European Management Journal, 32 (5): 735–751. doi:10.1016/j.emj.2013.12.004.
- European Commission. 2015a. Carbon Market Report 2015, Brussels. https://ec.europa.eu/clima/sites/default/files/strategies/progress/docs/com_2015_576_annex_1_cover_en.pdf.
- European Commission. 2015b. EU ETS Handbook. Climate Action.
- European Commission. 2019. A European Green Deal. https://ec.europa.eu/info/strategy/priorities-2019-2024/european-green-deal_en.
- European Commission. 2021. EU Emission Trading System (EU ETS). Retrieved February 27, 2021. https://ec.europa.eu/clima/policies/ets_en.
- Fama, E. F. 1991. “Efficient Capital Markets.” The Journal of Finance 46 (5): 1575–1617. doi:10.1111/j.1540-6261.1991.tb04636.x.
- Flammer, C. 2013. “Corporate Social Responsibility and Shareholder Reaction: The Environmental Awareness of Investors.” Academy of Management Journal 56 (3): 758–781. doi:10.5465/amj.2011.0744.
- Freeman, R. E. 1984. “Strategic Management: A Stakeholder Approach.” Analysis 1: 1–6. doi:10.2139/ssrn.263511.
- Friedman, M. 1970. “A Friedman Doctrine--The Social Responsibility of Business Is to Increase Its Profits.” New York Times Magazine 33: 126. doi:10.1007/978-3-540-70818-6_14.
- Friedrich, M., S. Fries, M. Pahle, and O. Edenhofer. 2019. “Understanding the Explosive Trend in EU ETS Prices--Fundamentals or Speculation?” Preprint, ArXiv:1906.10572.
- Friedrich, M., E.-M. Mauer, M. Pahle, and O. Tietjen. 2020. “From Fundamentals to Financial Assets: The Evolution of Understanding Price Formation in the EU ETS.” ZBW – Leibniz Information Centre for Economics Working Paper.
- Gerlagh, R., R. J. R. K. Heijmans, and K. E. Rosendahl. 2020. “COVID-19 Tests the Market Stability Reserve.” Environmental and Resource Economics 76 (4): 855–865. doi:10.1007/s10640-020-00441-0.
- Global Sustainable Investment Alliance. 2018. Global Sustainable Investment Review 2018.
- Gonenc, H., and B. Scholtens. 2017. “Environmental and Financial Performance of Fossil Fuel Firms: A Closer Inspection of Their Interaction.” Ecological Economics 132: 307–328. doi:10.1016/j.ecolecon.2016.10.004.
- Groening, C., and V. K. Kanuri. 2018. “Investor Reactions to Concurrent Positive and Negative Stakeholder News.” Journal of Business Ethics 149 (4): 833–856. doi:10.1007/s10551-016-3065-2.
- Grosjean, G., S. Fuss, O. Edenhofer, and N. Koch. 2016. “Politics Matters: Regulatory Events as Catalysts for Price Formation Under cap-and-Trade.” Journal of Environmental Economics and Management 78: 121–139. doi:10.1016/j.jeem.2016.03.004.
- Guo, J., B. Su, G. Yang, L. Feng, Y. Liu, and F. Gu. 2018. “How do Verified Emissions Announcements Affect the Comoves Between Trading Behaviors and Carbon Prices? Evidence from EU ETS.” Sustainability 10 (9): 3255. doi:10.3390/su10093255.
- Gupta, S., and B. Goldar. 2005. “Do Stock Markets Penalize Environment-Unfriendly Behaviour? Evidence from India.” Ecological Economics 52 (1): 81–95. doi:10.1016/j.ecolecon.2004.06.011.
- Hamilton, J. T. 1995. “Pollution as News: Media and Stock Market Reactions to the Toxics Release Inventory Data.” Journal of Environmental Economics and Management 28 (1): 98–113. doi:10.1006/jeem.1995.1007.
- Hang, M., J. Geyer-Klingeberg, and A. W. Rathgeber. 2019. “It is Merely a Matter of Time: A Meta-Analysis of the Causality Between Environmental Performance and Financial Performance.” Business Strategy and the Environment 28 (2): 257–273. doi:10.1002/bse.2215.
- Hart, S. L. 1995. “A Natural-Resource-Based View of the Firm.” Academy of Management Review 20 (4): 986–1014. doi:10.2307/258963.
- Hase, V., D. Mahl, M. S. Schäfer, and T. R. Keller. 2021. “Climate Change in News Media Across the Globe: An Automated Analysis of Issue Attention and Themes in Climate Change Coverage in 10 Countries (2006–2018).” Global Environmental Change 70: 102353. doi:10.1016/j.gloenvcha.2021.102353.
- Hitzemann, S., M. Uhrig-Homburg, and K.-M. Ehrhart. 2010. “The Impact of the Yearly Emissions Announcement on CO2 Prices: An Event Study.” Information Management and Market Engineering 2: 77–92.
- Horváthová, E. 2012. “The Impact of Environmental Performance on Firm Performance: Short-Term Costs and Long-Term Benefits?” Ecological Economics 84: 91–97. doi:10.1016/j.ecolecon.2012.10.001.
- Jia, J.-J., J.-H. Xu, and Y. Fan. 2016. “The Impact of Verified Emissions Announcements on the European Union Emissions Trading Scheme: A Bilaterally Modified Dummy Variable Modelling Analysis.” Applied Energy 173: 567–577. doi:10.1016/j.apenergy.2016.04.027.
- Jia, J., H. Wu, X. Zhu, J. Li, and Y. Fan. 2020. “Price Break Points and Impact Process Evaluation in the EU ETS.” Emerging Markets Finance and Trade 56 (8): 1691–1714. doi:10.1080/1540496X.2019.1694888.
- Jones, T. M. 1995. “Instrumental Stakeholder Theory: A Synthesis of Ethics and Economics.” Academy of Management Review 20 (2): 404–437. doi:10.2307/258852.
- Jong, T., O. Couwenberg, and E. Woerdman. 2014. “Does EU Emissions Trading Bite? An Event Study.” Energy Policy 69: 510–519. doi:10.1016/j.enpol.2014.03.007.
- Klassen, R. D., and C. P. McLaughlin. 1996. “The Impact of Environmental Management on Firm Performance.” Management Science 42 (8): 1199–1214. doi:10.1287/mnsc.42.8.1199.
- Koch, N., and A. Bassen. 2013. “Valuing the Carbon Exposure of European Utilities. The Role of Fuel mix, Permit Allocation and Replacement Investments.” Energy Economics 36: 431–443. doi:10.1016/j.eneco.2012.09.019.
- Krüger, P. 2015. “Corporate Goodness and Shareholder Wealth.” Journal of Financial Economics 115 (2): 304–329. doi:10.1016/j.jfineco.2014.09.008.
- Lahouel, B. Ben, M.-G. Bruna, and Y. Ben Zaied. 2020. “The Curvilinear Relationship Between Environmental Performance and Financial Performance: An Investigation of Listed French Firms Using Panel Smooth Transition Model.” Finance Research Letters 35: 101455. doi:10.1016/j.frl.2020.101455.
- Lahouel, B. Ben, Y. Ben Zaied, S. Managi, and L. Taleb. 2022. “Re-thinking About U: The Relevance of Regime-Switching Model in the Relationship Between Environmental Corporate Social Responsibility and Financial Performance.” Journal of Business Research 140: 498–519. doi:10.1016/j.jbusres.2021.11.019.
- Lioui, A., and Z. Sharma. 2012. “Environmental Corporate Social Responsibility and Financial Performance: Disentangling Direct and Indirect Effects.” Ecological Economics 78: 100–111. doi:10.1016/j.ecolecon.2012.04.004.
- Lo, A. W. 2004. “The Adaptive Markets Hypothesis.” The Journal of Portfolio Management 30 (5): 15–29. doi:10.3905/jpm.2004.442611.
- Loipersberger, F. 2018. “The Effect of Supranational Banking Supervision on the Financial Sector: Event Study Evidence from Europe.” Journal of Banking & Finance 91: 34–48. doi:10.1016/j.jbankfin.2018.04.003.
- MacKinlay, A. C. 1997. “Event Studies in Economics and Finance.” Journal of Economic Literature 35 (1): 13–39.
- McNichols, M., and A. Dravid. 1990. “Stock Dividends, Stock Splits, and Signaling.” The Journal of Finance 45 (3): 857–879. doi:10.1111/j.1540-6261.1990.tb05109.x.
- McWilliams, A., and D. Siegel. 1997. “Event Studies in Management Research: Theoretical and Empirical Issues.” Academy of Management Journal 40 (3): 626–657. doi:10.2307/257056.
- Oberndorfer, U., P. Schmidt, M. Wagner, and A. Ziegler. 2013. “Does the Stock Market Value the Inclusion in a Sustainability Stock Index? An Event Study Analysis for German Firms.” Journal of Environmental Economics and Management 66 (3): 497–509. doi:10.1016/j.jeem.2013.04.005.
- Porter, M. E., and C. van der Linde. 1995. “Toward a New Conception of the Environment-Competitiveness Relationship.” Journal of Economic Perspectives 9 (4): 97–118. doi:10.1257/jep.9.4.97.
- Salant, S. W. 2016. “What Ails the European Union's Emissions Trading System?” Journal of Environmental Economics and Management 80: 6–19. doi:10.1016/j.jeem.2016.06.001.
- Song, C., and S. H. Han. 2017. “Stock Market Reaction to Corporate Crime: Evidence from South Korea.” Journal of Business Ethics 143 (2): 323–351. doi:10.1007/s10551-015-2717-y.
- Verde, S. F., G. Galdi, I. Alloisio, and S. Borghesi. 2021. “The EU ETS and its Companion Policies: Any Insight for China’s ETS?” Environment and Development Economics, 26 (3): 302–320. doi:10.1017/S1355770X20000595.
- Vivid Economics. 2020. Market Stability Measures. London. https://ec.europa.eu/clima/sites/clima/files/ets/reform/docs/study_market_stability_measures_en.pdf.
- Walley, N., and B. Whitehead. 1994. “It’s not Easy Being Green.” Reader in Business and the Environment 36 (81): 4.
- Wang, Y., M. S. Delgado, N. Khanna, and V. L. Bogan. 2019. “Good News for Environmental Self-Regulation? Finding the Right Link.” Journal of Environmental Economics and Management 94: 217–235. doi:10.1016/j.jeem.2019.01.009.
- Wen, X., E. Bouri, and D. Roubaud. 2017. “Can Energy Commodity Futures add to the Value of Carbon Assets?” Economic Modelling 62: 194–206. doi:10.1016/j.econmod.2016.12.022.
- Williams, J. B. 1938. The Theory of Investment Value. Cambridge: Harvard University Press.
- Zhu, B., S. Ye, D. Han, P. Wang, K. He, Y.-M. Wei, and R. Xie. 2019. “A Multiscale Analysis for Carbon Price Drivers.” Energy Economics 78: 202–216. doi:10.1016/j.eneco.2018.11.007.
