
 ?Mathematical formulae have been encoded as MathML and are displayed in this HTML version using MathJax in order to improve their display. Uncheck the box to turn MathJax off. This feature requires Javascript. Click on a formula to zoom.
Abstract
Despite growing attention on the role of internationalization in capital structure and the increasing adoption of zero-leverage policies by multinationals (MNC), no study examines the effect of internationalization on zero leverage. Using data from the United Kingdom (UK), we present the first empirical evidence of a positive and significant relationship that increases in the level of internationalization both statistically and economically. We find that the motivation for zero leverage differs between MNC and domestic firms (DOM). Whilst the major driving factor for MNC is the maintenance of financial flexibility, financial constraints motivate DOM.
1. Introduction
A relatively new and puzzling empirical observation in corporate finance is the growing number of firms implementing zero-leverage policy despite the renowned benefits of debt in capital structure. We investigate the zero-leverage phenomenon by examining whether a firm’s internationalization, or multi-nationality, influences capital structure decisions and is a relevant factor explaining zero leverage. Our motivation stems from the dominant role of multinational corporations (MNC) in global economic activity (Buckley and Ghauri Citation2004; Narula and Dunning Citation2000; Citation2010) and reported links between internationalization and either firm performance (Aggarwal et al. Citation2011) or capital structure (see, e.g. Lindner, Klein, and Schmidt Citation2018).
Exploring this relationship is both an important and timely exercise for the following reasons. First, MNC face a more complicated set of choices in determining their financial structure than purely domestic firms (DOM), such as considering the tax systems of all the countries in which they operate (Huizinga, Laeven, and Nicodeme Citation2008), and the trade-off between the costs and benefits associated with their wider geographical reach (Lee and Kwok Citation1988). On that account, the motivation for zero leverage is also likely to differ for MNC and DOM. Yet, prior studies on zero leverage neither control for firms’ internationalization, nor consider DOM and MNC separately. Ignoring the above may realize a loss of detail in understanding firms’ motivations for zero leverage. Second, as we move forward, the aforementioned set of choices that MNC are facing are likely to be impacted by the Base Erosion and Profit Shifting (BEPS) project, an effort to overhaul the global tax system, led by the OECD and recently supported by more than 135 nations.Footnote1 In this regard, examining the potential impact of internationalization on zero-leverage policies will be useful in understanding the post-BEPS financial structure of MNC as well as help inform future studies on extreme debt conservatism.
So far as we are aware, ours is the first study to test and verify empirically the relationship between zero leverage and internationalization. In doing so, we contribute to a strand of literature that seeks to explain the zero-leverage irregularity (see, e.g. Bessler et al. Citation2013; Dang Citation2013; Devos et al. Citation2012; Haddad and Lotfaliei Citation2019; Strebulaev and Yang Citation2013),Footnote2 and resolve conflicting evidence that MNC hold more/less debt than DOM (Burgman Citation1996; Chen et al. Citation1997; Lee and Kwok Citation1988; Lindner, Klein, and Schmidt Citation2018; Mansi and Reeb Citation2002; Mittoo and Zhang Citation2008; Park, Suh, and Yeung Citation2013; Reeb, Mansi, and Allee Citation2001).
Our second contribution is to explain this result. For this task, we examine the predictive abilities of capital structure theories in explaining zero-leverage policy and determine if these are homogenous for DOM and MNC. Importantly, we contemplate zero-leverage policy through the lenses of the financial constraints and/or financial flexibility hypotheses to establish whether one empirically dominates the other.
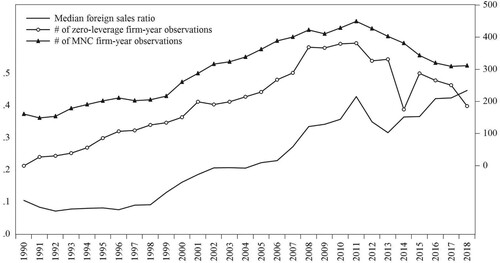
We use logistic regressions to empirically verify if internationalization significantly affects the odds of zero leverage. Our baseline econometric model controls for commonly reported determinants of capital structure and industry effects. We augment our baseline model with interaction terms between internationalization and our covariates to ascertain whether the effects on zero-leverage policy are homogenous across MNC and DOM. We also extend the analysis to consider a Tobin’s Q model of investment to shed more light on the motivation for zero leverage at MNC and DOM. We apply our models to a large panel of UK firms listed on the London Stock Exchange with available data on leverage and internationalization. Our dataset contains 21,793 firm-year observations between 1990 and 2018. Figure shows the evolution of the number of zero-leverage and MNC firm-year observations as well as the median foreign sales ratio for our sample of UK firms. The data illustrate an unambiguous and positive relationship between internationalization and zero leverage and indicate that the zero-leverage phenomenon is not negligible and is worthy of additional scrutiny to enhance understanding of capital structure decisions.
Figure 1. The evolution of foreign sales and zero leverage. This figure presents the evolution of the median foreign sales ratio (left axis), the number of zero-leverage firm-year observations (right axis), and the number of MNC firm-year observations (right axis) for our sample of UK companies between 1990 and 2018. We define zero-leverage firm-year observations as those when market leverage equals zero. We define MNC firm-year observations as those when the foreign sales-to-total sales ratio exceeds 0.50. We obtain firm identification and accounting data from Bloomberg and foreign sales data from WorldScope.
In preview, our primary result is that internationalization increases the odds of zero leverage. Furthermore, the odds of zero leverage are increasing in the level of internationalization both statistically and economically. A second result shows the underlying factors that influence the odds of zero leverage are heterogenous across DOM and MNC. Whilst pecking order theory better explains zero-leverage policy for both DOM and MNC, we show that the major motivating factor for MNC is maintenance of financial flexibility, whereas financial constraints motivate DOM. Our third result is derived from deeper analysis of sub-samples based on financial constraints, size, profitability, and actual tax. Results show that the motivation for zero leverage varies between MNC, with more constrained MNC behaving like DOM. We obtain a fourth result by modelling the investment policies of levered and zero-leverage firms. We find that in contrast to DOM, MNC strategically choose zero leverage to maintain financial flexibility. Our results withstand several robustness checks, including the use of alternative model specifications, proxies for internationalization, and zero leverage. Overall, we provide fresh insights on the effects of internationalization on zero leverage, which has implications for future research on extreme debt conservatism.
We organize the remainder of this paper as follows. Section 2 reviews related literature and develops our hypotheses. Section 3 describes the methodology and data. Section 4 discusses our findings and robustness checks. Section 5 concludes.
2. Related literature and hypothesis development
Modigliani-Miller’s (Citation1958) ‘irrelevance’ theorem of capital structure is a cornerstone in corporate finance and has facilitated the development of theories of capital structure including trade-off theory (Miller Citation1977; Modigliani and Miller Citation1963; and Scott Citation1977), pecking-order theory (Myers Citation1984; Myers and Majluf Citation1984), agency costs theory (Jensen and Meckling Citation1976), market timing theory (Baker and Wurgler Citation2002), corporate control theory (Harris and Raviv Citation1990; Stultz Citation1988), and product cost theory (Campello Citation2003; Harris and Raviv Citation1990). However, traditional capital structure theories do not explain the puzzling phenomena of zero leverage and debt conservatism in firms.
A voluminous empirical literature examines the determinants of capital structure. While size, asset structure, non-debt tax shields, profitability, and firms’ financing choices inter alia are influential, there is no consensus if capital structure is best explained by the trade-off or pecking order theories (Frank and Goyal Citation2003; Citation2009; Hovakimian, Hovakimian, and Tehranian Citation2004; Myers Citation1977; Rajan and Zingales Citation1995; Shyam-Sunder and Myers Citation1999; Titman and Wessels Citation1988).Footnote3
Investigations of debt conservatism have produced mixed results. Graham (Citation2000) finds large, profitable, and liquid firms with low distress costs conservatively use debt. That many firms borrow less than expected is inconsistent with capital structure theories (Marchica and Mura Citation2010). This irregularity has been attributed to the leverage choice of firms’ Chief Financial Officers (CFOs) to preserve financial flexibility (Bancel and Mittoo Citation2004; Graham and Harvey Citation2001). This view implies that firms adopt conservative leverage policies to maintain ‘substantial reserves of untapped borrowing power’ (Modigliani and Miller Citation1963, 442). In support, Korteweg (Citation2010) finds that, on average, firms are under-levered relative to the optimal leverage ratio (attributed to the presence of zero-leverage firms in the sample), while Matemilola and Ahmad (Citation2015) argue that firms may be under-levered due to the costs associated with adjusting to the levels of optimal debt.
Empirical studies use various characteristics to explain the empirical irregularity of zero leverage; for instance, firm-level fundamentals (Bessler et al. Citation2013; Byoun and Xu Citation2013; Dang Citation2013; Devos et al. Citation2012; Huang, Li, and Gao Citation2016), macro-economic variables (Dang Citation2013), corporate governance mechanisms and the level of managerial entrenchment (Devos et al. Citation2012; Strebulaev and Yang Citation2013), product market competition (Chu and Pham Citation2021), the long-run performance of zero-leverage firms (Lee and Moon Citation2011), market wave forces (Bessler et al. Citation2013), and cross-country characteristics, such as culture or the level of trust (El Ghoul et al. Citation2018).
More specifically, El Ghoul et al. (Citation2018) report that firms located in countries characterized by high levels of conservatism, or exhibiting high levels of trust, are more likely to employ a zero-leverage policy. Strebulaev and Yang (Citation2013) find that corporate governance significantly affects the zero-leverage policy of US firms. In Devos et al. (Citation2012), unlevered firms are small, young, and financially constrained with zero-leverage policy unrelated to governance or entrenchment. Dang (Citation2013) corroborates this result using UK data, finding zero-leverage policy reflects financial constraints and macroeconomic conditions. Byoun and Xu (Citation2013) and Huang, Li, and Gao (Citation2016) also document an important motivational relationship between financial constraints and zero leverage. Using international data, Bessler et al. (Citation2013) find that IPO waves, industry effects, financial constraints, and risk are important determinants of zero leverage. Elsewhere, Chu and Pham (Citation2021) document a positive relationship between the degree of product market competition and zero leverage. Indeed, firms operating in highly competitive industries have been found to experience higher loan rates (Valta Citation2012), lower profit margins and higher costs of debt (Xu Citation2012). Assuming that firms’ financial policies are determined by product market dynamics (Hoberg, Phillips, and Prabhala Citation2014), firms facing a higher degree of competition might be inclined to eschew debt. This evidence suggests that financial constraints are a primary causal factor of the zero-leverage phenomenon.
However, Lee and Moon (Citation2011) find zero-leverage firms perform better over the long-run, and one might expect strong performers to be less financially constrained with greater debt capacity even if they opt to eschew debt. Through this lens, financial flexibility is a more critical factor in zero-leverage policy than suggested by the debt conservatism literature. In support, Lotfaliei (Citation2018) argues that firms choose to be unlevered to maintain financial flexibility in the future. The importance firms’ place on future financial flexibility can be explained by the ‘leverage ratchet’Footnote4 effect, which posits that previous leverage decisions impact future leverage choices. Accordingly, Haddad and Lotfaliei (Citation2019) demonstrate that the timing of debt issuances can impact the propensity of firms to adopt zero leverage with firms’ issuing debt only when the net debt benefits are positive. Also, Miglo (Citation2020) argues that firms that are partially constrained are more inclined to choose a zero-leverage policy to avoid future debt overhang and maintain future financial flexibility. We note this strand of literature does not consider the level of internationalization and its potential impact on zero leverage, which presents an extreme case of capital structure.
The internationalization-capital structure literature provides contrasting arguments as per the direction of this relationship. The superior performance of MNC over DOM is attributed to greater accessibility to capital markets and benefits accruing from diversification. For example, MNC are exposed to incremental economic forces and have greater opportunities (Burgman Citation1996) leading possibly to variation in optimal capital structure. In addition, Errunza and Senbet (Citation1981) suggest that firms with international activity create vast opportunities from investments across international markets, which facilitates debt issuance at a relatively lower cost than their domestic peers. Erel, Jang, and Weisbach (Citation2020) state that even though MNC are exposed to additional risks such as political factors and exchange rates, they are likely to benefit from both flexibility in capital resources as well as diversification of cash flows. Similarly, O’ Hagan-Luff and Berrill (Citation2015) find that MNC have a greater global reach than domestic firms and thus benefit from diversification. In this way, MNC could arbitrage segmented capital markets and diversify income streams to reduce risk (Errunza and Senbet Citation1981; Lessard Citation1973; Levy and Sarnat Citation1970). Hence, MNC are better positioned to benefit from debt financing and have higher leverage than DOM (Mittoo and Zhang Citation2008). Indeed, evidence shows MNC not only carry more debt (Mansi and Reeb Citation2002; Mittoo and Zhang Citation2008; Singh and Nejadmalayeri Citation2004), but also face lower costs of debt financing (Reeb, Mansi, and Allee Citation2001). Based on this discussion, we propose the following hypothesis:
H1. Internationalization reduces the odds of zero leverage.
On the one hand, MNC may be forced to carry less or no debt. First, some argue that their debt is relatively more expensive on the back of higher agency (Lee and Kwok Citation1988) and bankruptcy (Fatemi Citation1988) costs. In particular, the international diversification of MNC makes gathering and processing information more complex, which in turn increases monitoring (Doukas and Pantzalis Citation2003) as well as bankruptcy costs relative to DOM. As a result, MNC experience higher costs of debt and are thus expected to have lower debt ratios. Second, MNC are more exposed to foreign exchange and political risks (Akhtar Citation2005; Bartov, Bodnar, and Kaul Citation1996; Chen et al. Citation1997; Erel, Jang, and Weisbach Citation2020). Given their international footprint, their operating and financing cash flows are more likely to be negatively impacted by foreign exchange fluctuations. As such, MNC can mitigate currency risk associated with debt denominated in foreign currencies by using less debt. This evidence, as well as broad consensus in the zero-leverage literature that firms without debt are smaller, younger, and financially constrained, implies that zero leverage is not a choice for MNC but a necessity. Based on this discussion, we propose the following alternative hypothesis:
H1A. Internationalization increases the odds of zero leverage (financial constraints view of MNC).
In addition, the fact that MNC pay lower taxes (Toplensky Citation2018) may increase their ability to benefit from financial flexibility. First, MNC can reduce their tax burden by taking advantage of operating (and generating income) across jurisdictions to limit reliance on debt tax shields (Blouin Citation2012). In contrast to DOM, MNC could utilize their global network of affiliates to shift internal and external debt in ways that minimize their overall tax bill (Goldbach et al. Citation2021). Singh and Hodder (Citation2000) argue that financial flexibility could be a substitute and/or complement for leverage. The substitution effect results from the ability of MNC to shift to lower tax jurisdictions and this is particularly important when a MNC has a low amount of leverage. Whereas trade-off theory suggests firms with higher tax advantages use more debt, evidence shows firms following similar tax policies have different debt levels (McMillan and Camara Citation2012). Faulkender and Smith (Citation2016) suggest that variation in tax rates is a critical factor in explaining leverage dynamics amongst MNC; they confirm findings that MNC which face lower tax rates use less debt. In the extreme scenario of no taxes, zero leverage is the ex-ante optimum policy (DeAngelo and DeAngelo Citation2007). Second, the lower the tax rate, the lower the tax disadvantage of retaining cash (Gamba and Triantis Citation2008) and thus – in the absence of tax-shield incentives – the greater the ability of MNC to strategically opt for financial flexibility. Additionally, given that financial flexibility has been identified as the most important factor that CFOs consider when deciding a company’s debt policy (Bancel and Mittoo Citation2004), it can be argued that to maintain competitive advantage (Blomström and Kokko Citation1998), MNC seek to remain financially flexible. Desai, Fritz Foley, and Hines (Citation2004) find MNC are better placed to substitute internal funds for external funds compared to local competitors with limited access to global capital markets. Since a pecking-order perspective posits using internal funds over debt financing to maintain financial flexibility, it is equally plausible that zero leverage is a choice MNC make. Based on this discussion, we formulate the following alternative hypothesis:Footnote5
H1B. Internationalization increases the odds of zero leverage (financial flexibility view of MNC).
3. Methodology and data
3.1. Model specification
Our dependent variable is a binary indicator that differentiates zero-leverage and levered firms. We use a logistic function to transform this variable into the log-odds of zero leverage and interpret the coefficient on internationalization as measuring the expected change in log-odds of a firm having zero leverage for a one-unit increase in internationalization. We estimate the probabilities of a vector of firm characteristics being associated with zero-leverage financial policy (Bessler et al. Citation2013; Dang Citation2013) (see Equation 1):Footnote6
(1)
(1) where,
is a binary variable (leverage) equal to unity for firm-year observations with zero leverage, 0 otherwise,
is a constant,
a vector of coefficients to be estimated, and
a vector of firm-specific and other explanatory variables posited to affect firms’ zero-leverage status. The variables in
are: internationalization (foreign sales-to-total sales); size (natural logarithm of total assets); cash ratio (cash and cash equivalents-to-total assets); asset structure (fixed assets-to-total assets); profitability (operating income plus depreciation-to-total assets); non-debt tax shield (depreciation-to-total assets); actual tax rate (cash paid for taxes-to-pre-tax income); growth (market capitalization-to-total book value); the Z-score (Altman Citation1968); and industry concentration (Herfindahl-Hirschman index).Footnote7
3.2. Sample
We select the UK as a suitable testing ground for our analysis. Data provided by The World Bank shows that the UK has been among the top six largest economies in the world over the last three decades. Moreover, the UK is a favourable location for MNC, ranking fourth globally in terms of the number of top MNC by country headquarters, and second in terms of the number of subsidiaries hosted.Footnote8 Among the primary factors making the UK an attractive destination for MNC are its strategic location, global connectivity, and leading financial markets.Footnote9
Our dataset contains observations on UK firms from 1990 to 2018. We source data from Bloomberg and apply the following criteria to screen the data. Firms were listed on the London Stock Exchange in 2018. We exclude utility and financial firms (Industry Classification Benchmark (ICB) codes 7000 and 8000), because they are subject to different regulations and have materially different capital structures (Dang Citation2013). We apply additional standard data restrictions and exclude firm-year observations if the leverage ratio or internationalization indicator exceed one, and winsorize covariates at the 1st and 99th percentiles to mitigate the influence of outliers. The final sample is an unbalanced panel comprising 2,516 firms and 21,793 firm-year observations. Table shows the distribution by industry, firms’ domestic or multinational status, and zero-leverage status.
Table 1. Number of firm-year observations for domestic and multinational firms by leverage status.
For the full sample, 13.59% of firm-year observations exhibit zero leverage. Segmenting the sample into DOM and MNC, the percentages of firm-year observations with zero leverage are 13.17% and 14.41%, respectively, which broadly concurs with evidence that MNC carry less debt than DOM (Burgman Citation1996; Chen et al. Citation1997).
MNC zero-leverage policy varies across industries. The technology industry records the largest percentage of zero-leverage firm-year observations (28.30%) followed by healthcare (21.41%) and oil and gas (21.13%). Similar variation exists for DOM. Our descriptive statistics infer extreme debt conservatism is industry-specific (Dang Citation2013) and contrasting with evidence from the US (see Minton and Wruck Citation2001).
3.3. Dependent variable and primary independent variable
Our preferred measure of leverage is market leverage (following Fama and French Citation2002; Flannery and Rangan Citation2006; Gomes and Schmid Citation2010). Market leverage is closely tied to equity risk and deemed more informative than book leverage (Gomes and Schmid Citation2010). We define market leverage as the ratio of debt-to-total financing (see Equation 2):
(2)
(2) where,
is leverage,
is the sum of short-term and long-term debt, and
is the market capitalization of firm i at fiscal year t. We define zero leverage in firm-year observations where
and specify a binary variable equal to unity to identify zero-leverage firms, zero otherwise (Bessler et al. Citation2013).Footnote10
Given differences in leverage between DOM and MNC, we contend that internationalization is a critical factor affecting zero-leverage policy. Equation (3) presents our measure of the level of internationalization:
(3)
(3) where,
is the percentage of foreign sales-to-total sales,
is the value of foreign sales, and
is the value of total sales of firm i at fiscal year t. In logistic regressions, a binary variable equal to unity classifies a firm as MNC in firm-year observations where
, zero otherwise.Footnote11
3.4. Control variables
We select our controls using theory and evidence. Pecking order and/or trade-off theories assert that larger firms with more tangible assets utilize higher levels of debt financing due to fewer information asymmetries and lower probability of bankruptcy (Rajan and Zingales Citation1995; Titman and Wessels Citation1988). Concomitantly, higher growth and/or more profitable firms generate sufficient internal funds to facilitate holding lower levels of debt (Myers and Majluf Citation1984). To test the predictions of pecking order and trade-off theories, our logit model specifies the following covariates: size (natural logarithm of total assets); asset structure (tangibility – fixed tangible assets-to-total assets); profitability (operating income plus depreciation-to-total assets); and growth opportunities (market capitalization-to-total book value).Footnote12
The financial constraints hypothesis posits that firms’ access to capital is restricted. A pecking-order perspective contends that firms prefer internal over external financing because the former is relatively cheaper and the latter not readily available. In this scenario, financially constrained firms refuse positive NPV projects due to high-cost premiums emanating from external finance (Guariglia and Yang Citation2016; Stiglitz and Weiss Citation1981). Therefore, financially constrained firms hold lower levels of leverage compared to financially unconstrained firms (Dang Citation2013).
In contrast, a policy of low (and potentially zero) leverage could reflect preference for financial flexibility. The financial flexibility hypothesis suggests that firms hold large cash reserves as insurance against investment distortions in the future and to maintain borrowing power (DeAngelo and DeAngelo Citation2007; Modigliani and Miller Citation1963). Thus, increasing cash holdings increases the odds of zero leverage (Bessler et al. Citation2013). We employ the cash ratio – ratio of cash and cash equivalents-to-total assets – to test propositions of the financial constraints and financial flexibility hypotheses.Footnote13 Size tests the validity of the financial constraints hypothesis since larger firms are less financially constrained and can raise more debt financing (Hadlock and Pierce Citation2010). Both asset structure and growth opportunities test the validity of the financial flexibility hypothesis: first, firms with higher levels of tangible assets have higher liquidation value implying they are more financially flexible and/or less financially constrained; second, since high-growth firms hold larger cash reserves to maintain debt capacity for future investments, they are more financially flexible.
Our model specifies non-debt tax shields (ratio of depreciation-to-total assets) which reduce tax benefits from interest payments (Titman and Wessels Citation1988) and actual tax (ratio of cash paid for taxes, net of any tax refunds-to-pre-tax income). The deduction of interest expenses from taxable income allows firms to shield income, thereby, increasing their value (Faccio and Xu Citation2015). We specify Altman’s Z-score to proxy bankruptcy risk (following Billett, King, and Mauer Citation2007; Denis and Mihov Citation2003). Whereas trade-off theory suggests riskier firms face higher distress costs that discourage using debt, a financial constraints view suggests riskier firms cannot raise debt financing due to their higher probability of bankruptcy. A pecking order perspective suggests riskier firms are less able to raise funds through internal financing, which causes firms to prioritize external finance.
We contend that industry concentration affects zero-leverage policy. Much like debt, competition limits the amounts of resources available to managers and is an effective substitute in disciplining managers spending behaviour (Williamson Citation1963). Agency theory suggests that firms operating in riskier, more competitive business environments may opt not to hold larger amounts of debt because of the higher costs associated with such environments (Jermias Citation2008).
Finally, we specify industry-level fixed effects to control for within-industry heterogeneity (Bessler et al. Citation2013). Our empirical design renders the inclusion of fixed effects problematic, because both our dependent and primary independent variables (zero-leverage and internationalization) are time-invariant for several firms in our sample. Specifically, many sample firms maintain their leverage (zero-leverage/levered) and/or internationalization (MNC/DOM) status throughout (or, persistently over) the sample period and, as such, in the case of the dependent variable using fixed effects would exclude over three-quarters of our sample. In the case of the independent variable, El Ghoul et al. (Citation2018) cite Wooldridge (Citation2002) who cautions that when key explanatory variables do not vary much over time, fixed effects can lead to imprecise estimates, and that time-invariant explanatory variables cannot be included in fixed effects models because it is not possible to separate the effects of time-constant explanatory variables from time-constant unobservable fixed effects. In our case, fixed effects would proxy for all firm characteristics, including whether a firm is a MNC as well as confine our analysis to firms with non-persistent zero-leverage policies and/or MNC status. In support, prior research on zero leverage (Bessler et al. Citation2013; Dang Citation2013; Strebulaev and Yang Citation2013) do not use fixed effects. Notwithstanding, and to mitigate potential issues due to omitted variables, we control for observable key firm characteristics, established in prior capital structure (and zero-leverage) research, while employing higher-level fixed effects (industry).
4. Empirical findings
4.1. Univariate analysis
We compare the characteristics of zero-leverage firms and levered firms across domestic and multinational dimensions. Table shows mean values and t-statistics from differences-in-means tests between subsets. Panel A presents means for levered firms only: column 1 for all levered firms; columns 2 and 3 for levered-domestic (LDOM) and levered-multinational firms (LMNC). Panel B shows means of zero-leverage firms only: column 4 for all zero-leverage firms; columns 5 and 6 for zero-leverage domestic (ZDOM) and zero-leverage MNC (ZMNC).
Table 2. Characteristics of levered and zero-leverage firms by MNC status.
To better compare our univariate results with previous studies, we contrast the characteristics of all levered and zero-leverage firms (columns 1 and 4). Our results broadly comply with capital structure theories and Dang (Citation2013). First, the average zero-leverage firm is significantly smaller than its levered counterpart. This supports a financial constraints perspective that smaller firms hold less (or zero) debt because of inferior access to credit markets. Second, the average zero-leverage firm holds more cash, faces higher growth opportunities, is less profitable, and pays lower taxes. Pecking order theory contends that information asymmetries cause firms to prioritize internal funds over debt. Smaller, higher-growth firms for whom information asymmetries are more prominent dominate our zero-leverage sample. Another two, non-mutually exclusive explanations reason that growth firms avoid debt and reserve cash to preserve credit capacity (or financial flexibility) for future periods (DeAngelo and DeAngelo Citation2007), and/or assuming cash holdings proxy future financial constraints (Almeida, Campello, and Weisbach Citation2004) to hedge against upcoming credit shortages.
Third, the average zero-leverage firm has fewer tangible assets and significantly lower non-debt tax shields. Trade-off theory assumes a positive relationship between tangibility and leverage (Jensen and Meckling Citation1976); it infers zero-leverage firms hold fewer tangible assets. Our finding on non-debt tax shields accords with Dang (Citation2013) but contradicts the broader trade-off framework assumption of a negative relationship between non-debt tax shields and leverage (DeAngelo and Masulis Citation1980). Fourth, the average zero-leverage firm is less risky (higher Z-score) and operates in relatively more concentrated industries. These results contravene propositions both of trade-off theory and the financial constraints hypothesis that smaller, riskier firms and firms operating in more concentrated markets face greater financial constraints rendering them less likely to issue debt. Lastly, we accept the null that the difference-in-means in the two cohorts’ foreign sales ratio is zero.
To investigate the potential effects of internationalization, we segment the sample into four subsets, LDOM (Column 2), LMNC (Column 3), ZDOM (Column 5), and ZMNC (Column 6) – and contrast characteristics. We compare the characteristics of LDOM and ZDOM (Column 9) and LMNC and ZMNC (Column 10). Holding the internationalization dimension constant, the results are consistent with the full samples of levered and zero-leverage firms. However, marked differences exist in the foreign sales ratio and actual tax rates of subsets. First, ZDOM (ZMNC) have a significantly lower (higher) foreign sales ratio than LDOM (LMNC). Second, our finding that zero-leverage firms have significantly lower actual tax rates (see DeAngelo and Masulis Citation1980) is driven by MNC subsets. While the actual tax rates of ZDOM and LDOM do not significantly differ, ZMNC have significantly lower actual taxes than LMNC.
Next, we examine differences between DOM and MNC (Columns 8 and 11). Holding the leverage dimension constant, MNC are significantly larger than DOM, which is consistent with prior research (see, e.g. Mittoo and Zhang Citation2008; Park, Suh, and Yeung Citation2013). They also hold more tangible assets than DOM. In comparison, Park, Suh, and Yeung (Citation2013) report the opposite for US firms, whereas Mittoo and Zhang (Citation2008) find no difference for Canadian firms, which points to cross-sample heterogeneity in firm tangibility. Both findings contravene predictions of trade-off theory and the financial constraints hypothesis, which posit that larger firms and those with higher proportions of tangible assets assume more debt. Our findings show that despite being larger and holding more tangible assets than LDOM peers, LMNC have a significantly lower leverage ratio, whilst a non-negligible number of MNC have zero leverage. While ZMNC achieve a significantly lower actual tax rate than ZDOM, this is not so for LMNC and LDOM.
Our findings support the conjecture that MNC hold less (or zero) debt by choice and not by force. This conforms to pecking order theory and the financial flexibility hypothesis. Finally, we do not observe significant differences in profitability, growth opportunities, and Z-scores between MNC and DOM. In sum, our univariate results suggest zero-leverage policy is influenced by internationalization. Next, we employ multivariate regression analysis to examine the mechanics of this relationship in greater detail.
4.2. Multivariate analysis
4.2.1. Results from logistic regressions: full sample
We use logistic regression analysis to determine whether internationalization affects the odds of zero leverage controlling for factors commonly used in capital structure studies. Table shows results.Footnote14 Model A is the baseline model. To account for variation in levels of internationalization, we estimate Model A four times using different threshold indicators of internationalization ( – foreign sales-to-total sales ratio > 0.20; MNC > 0.50; MNC > 0.60; MNC > 0.80). Next, we estimate the augmented Model B which specifies interactions between internationalization (MNC) and each covariate.
Table 3. Logistic regressions of firms’ zero-leverage status.
In Table , column 1 shows estimated coefficients from Model A when internationalization exceeds 0.20. At this threshold, internationalization does not affect zero leverage. However, higher levels of internationalization significantly increase the odds of zero leverage (column 3 – model 2 (); column 5 – model 3 (
); column 7 – model 4 (
)). Specifically, Model 2 (MNC > 0.50) shows the coefficient on MNC is 0.228, which implies that in economic terms, all else equal, MNC are 25.6% more likely to have zero leverage than DOM. The odds of zero leverage increase in magnitude (and significance) as the threshold increases (or as the definition of MNC narrows to only include firms with higher foreign sales margins). Coefficients in Models 3 and 4 show, all else equal, MNC are 28.3% and 44.6% more likely than DOM to have zero leverage, respectively. These results reject H1, reaffirm our univariate evidence, and lead to two implications. First, MNC are more likely to use zero-leverage policy. This validates our alternative hypotheses (H1A and H1B) that internationalization increases the odds of zero leverage and sides with research documenting a negative relationship between internationalization and leverage discussed earlier. Second, the odds of zero leverage are increasing in the level of internationalization. This is important given marked differences between ZMNC and other subsets noted above, and reinforces the conjecture that underlying factors, particular to MNC, influence their zero-leverage status.
Notwithstanding, an important question remains. Is MNC zero-leverage policy determined by financial constraints or the need to maintain financial flexibility? To answer this question, we examine the covariates in Model B, which specifies interaction terms (columns 2, 4, 6 and 8).Footnote15 In contrast to Model A, in Model B the coefficients on the internationalization indicator (MNC) are insignificant (bar model 2). This is unsurprising since the interaction terms capture any underlying factors, unique to MNC, which drive the positive relationships found in Model A.Footnote16 In what follows, for ease of exposition we discuss and contrast covariates across specifications A and B.
The estimated coefficients on control variables (Model A) accord with prior research on zero leverage (Bessler et al. Citation2013; Dang Citation2013; Devos et al. Citation2012). The negative, significant coefficients on size corroborate the financial constraints view that smaller firms are more financially constrained and less able to raise debt. The negative sign also endorses the pecking order view that smaller firms prioritize internal funds over debt and the trade-off view that smaller firms exhibit higher bankruptcy risk, which increases debt-related costs and reduces borrowing capacity. While size retains its sign and significance across Model B, the negative, highly significant interaction term coefficients (MNC × Size) indicate that the size effect is more pronounced for MNC. Indeed, smaller MNC are more likely to face higher borrowing costs (and eschew debt) due to agency costs and greater exposure to foreign exchange and political risks (Chen et al. Citation1997).
In Model A, coefficients on the cash ratio are significantly positive. It infers that firms which hold larger cash reserves are more likely to adopt zero-leverage policies. This result supports the financial flexibility hypothesis whereby firms hold large cash reserves to insure against future investment distortions and to maintain borrowing power (DeAngelo and DeAngelo Citation2007; Modigliani and Miller Citation1963). It also endorses a pecking order perspective that cash-rich firms prioritize internal funds potentially eschewing debt in the process, and the financial constraints hypothesis assumption of the cash ratio as proxy for future financial constraints. In Model B, cash is positive and significant for DOM only, indicating no difference in the effect of cash on zero leverage between MNC and DOM.Footnote17
That asset structure (tangibility) does not influence the odds of zero leverage in Model A contradicts trade-off and pecking order theories. The literature offers conflicting explanations. On the one hand, firms holding more tangible assets have higher liquidation value rendering them less reliant on debt (Harris and Raviv Citation1990). Concomitantly, these firms may opt not to raise debt to avoid problems associated with debt overhang (Myers Citation1977). On the other hand, Scott’s (Citation1977) secured debt hypothesis posits that firms obtain favourable terms when debt is secured by tangible assets. Under this scenario, greater tangibility ceteris paribus is associated with higher debt levels (and lower odds of zero leverage). In Model B, the coefficient on tangibility is significantly negative for DOM in column 4 (Model 2); that the sign switches on the interaction term (MNC × TANG) infers that greater tangibility raises the odds of zero leverage for MNC relative to DOM. Linear restrictions tests show the sum of tangibility coefficients for DOM and MNC is positive and significant (see ). The results support our univariate finding that MNC hold significantly higher amounts of tangible assets than DOM (see Table ) and conjecture that MNC eschew debt to maintain financial flexibility and mitigate issues associated with leverage.
The coefficients on profitability are insignificant in Model A. At first glance, this finding contradicts the pecking order theory, which suggests more profitable firms prefer internal financing thereby subordinating (or eschewing) external funds in pursuit of economic convenience and reduction of information asymmetries (Cappa, Cetrini, and Oriani Citation2020). It also contradicts the trade-off theory view that less profitable companies have fewer reasons to protect earnings using tax shields and, consequently, hold less debt (more likely to have zero leverage). However, Model B shows positive, significant coefficients for DOM, consistent with pecking order theory. It also shows negative, significant coefficients on interaction terms (bar the lowest threshold), which suggests profitability is less influential in affecting zero-leverage policies of MNC. Linear restrictions tests show the sum of profitability coefficients is insignificant. This emphasises the marked variation in the impact of profitability on the zero-leverage status of DOM and MNC, with the former not affecting the zero-leverage policies of MNC.
Across Model A, coefficients on non-debt tax shields are negative and significant indicating that firms with higher levels of depreciation have lower odds of zero leverage. Whilst this result contrasts with the broader trade-off framework (DeAngelo and Masulis Citation1980), which assumes a negative (positive) relationship between non-debt tax shields and leverage (zero leverage), it confirms results in Dang (Citation2013). Whereas coefficients on non-debt tax shields retain their sign in Model B, signs on interaction terms are insignificant (MNC × NDTS) (bar model 1). Hence, we fail to detect a significant difference in the effect of non-debt tax shields on zero leverage between MNC and DOM.
The coefficients on growth opportunities are negative and significant in Model A. While inconsistent with Bessler et al. (Citation2013) and trade-off theory, the finding is somewhat consistent with pecking order theory. It is possible that high-growth firms’ funding requirements outweigh their ability to generate internal funds. This increases the odds of firms holding debt (decreases odds of zero leverage). In Model B, growth opportunities coefficients are negative and significant for DOM and insignificant for MNC (MNC × Grow) (bar model 1) inferring that the effect of growth opportunities on zero leverage does not differ between MNC and DOM.
The actual tax rate enters Model A with positive, significant coefficients. This implies that firms which pay higher taxes (or face lower tax advantages) have greater odds of zero leverage. The result is inconsistent with the trade-off theory perspective that firms facing low taxes have less incentive to use debt, thereby increasing the odds of zero leverage. However, the result supports the conjecture that firms which pay higher taxes are more financially constrained and less able to raise debt. The augmented specifications (Models B) show the result holds for DOM only. Whereas actual tax coefficients retain their positive sign and significance for DOM, coefficients on the interaction terms are negative and significant for MNC (bar model 1). This suggests that MNC reduce their tax burden by taking advantage of locations and income across jurisdictions, which limits their reliance on debt tax shields (Blouin Citation2012). Linear restrictions tests show the sum of actual tax coefficients for DOM and MNC is insignificant, which infers that tax-related financial constraints considerations are inapplicable to MNC. With the univariate result showing that MNC pay significantly less taxes, our evidence lends further credence to our hypothesis (H1B) that the decision of MNC not to hold debt is a choice and not necessity.
We find positive, significant relationships between Z-score and zero leverage in Model A. A pecking order perspective infers that firms with lower default probabilities are more likely to follow zero-leverage policy. The positive relationship holds for DOM and MNC in Model B. The coefficients on interaction terms show that the effect of the Z-score on zero leverage is greater for MNC and are significant at the two higher thresholds of internationalization (models 3 and 4). Finally, we observe an insignificant relationship between industry concentration and zero leverage implying that the level of industry concentration, a proxy for competitiveness, is an unimportant factor in zero-leverage policy. Both results are inconsistent with trade-off theory and the financial constraints hypothesis, which postulate that smaller, riskier firms, and firms operating in more competitive markets, face greater financial constraints and are less likely to issue debt. If anything, the result on the Z-score supports pecking order theory and/or the financial flexibility view that less risky firms face potentially lower distress costs leading them to prioritize internal funds and eschew debt in the process.
Overall, our multivariate results provide strong evidence that internationalization increases the odds of zero leverage. Our results from baseline Model A show that a sole capital structure theory cannot explain zero leverage, possibly reflecting inter-firm heterogeneity in the sample. While trade-off theory and/or financial constraints considerations explain relations between zero-leverage policy and both size and taxes, pecking order theory and financial flexibility considerations better describe relations between zero-leverage policy and cash, growth, and default risk. Results obtained from the augmented Model B confirm the presence of significant variations in some of the underlying dynamics of zero leverage between DOM and MNC. Whereas coefficients on tangibility support trade-off and pecking order perspectives for DOM, they support the financial flexibility view for MNC. Second, the coefficients on profitability support a pecking order perspective for DOM and not MNC. Finally, coefficients on actual tax signal financial constraints considerations for DOM, yet not MNC. The next section will shine more light on this discussion by offering results on different sub-samples.
4.2.2. Results from logistic regressions: sub-samples
We construct sub-samples by segmenting the full sample at the median values of four variables to create the following cohorts: high and low financial constraints firms (Model 1);Footnote18 large and small firms (Model 2); high and low profitability firms (Model 3); and high and low actual tax firms (Model 4).Footnote19 In what follows, we maintain a constant level of internationalization in estimations of the augmented Model 2 (MNC > 0.50) for each sub-sample. Table presents results comparable to the full sample results of Model 2 specification B (column 4) in Table . Since many results in Table pertaining to DOM and MNC are consistent with Table , for the sake of brevity, we analyze results that deviate from the full sample.
Table 4. Logistic regressions of firms’ zero-leverage status: sample subsets.
Model 2 segments the sample by size into large and small firms. The coefficient on size shows that size does not affect zero-leverage policy for small DOM. Notwithstanding, size is a consistent determinant of zero leverage for DOM across all other cohorts. Our previous result of a pronounced size effect for MNC is rejected for the following cohorts: high financial constraints, small size, low profitability, and low tax. These results imply that the profile of more constrained MNC compares to DOM in terms of the effect of size on zero leverage.
Consistent with the full sample results, the cash ratio coefficient is positive and significant for DOM across cohorts. The previous insignificant cash coefficient for MNC turns positive (negative) and significant for low profitability and low- (high-) tax MNC (columns 6, 7, 8). This suggests that less profitable or low-tax MNC that hold larger amounts of cash have greater odds of zero leverage relative to DOM. A plausible explanation is that MNC reduce their tax burden through offshore profit shifting, thereby building cash reserves whilst limiting reliance on debt tax shields (Blouin Citation2012). This result strengthens our previous findings and supports the financial flexibility view of zero-leverage policy in MNC.
Supporting the full sample results, tangibility is negatively associated with the odds of zero leverage for high-constraints, small, less profitable, and low-tax DOM (columns 1, 4, 6 and 8). Coefficients on interaction terms retain positive and significant effects across cohorts (bar small MNC) with the effect being stronger for larger MNC (column 3) and those facing lower financial constraints (column 2). This result illuminates our previous finding on the effect of tangibility on zero leverage for MNC by reinforcing the proposition that financial flexibility is mostly relevant to large and less financially constrained MNC.
For DOM, coefficients on profitability are positive and significant in low constraints and large cohorts (columns 2 and 3). A pecking order view suggests that more profitable DOM, which are large and/or less financially constrained are more likely to use zero-leverage policy. The coefficients on interaction terms turn negative and are significant for high-constraints and both size cohorts (columns 1, 3 and 4). Notwithstanding, linear restrictions tests show that the effect of internationalization on the relationship between zero leverage and profitability is significant for the high-constraints cohort only. This supports a trade-off view where less profitable MNC facing high constraints have less reason to protect earnings and are more likely not to hold debt.
The coefficients on non-debt tax shields remain negative and retain significance for DOM (bar low constraints) yet are mostly insignificant for interaction terms. While we find positive (negative) and significant relationships (at 10 percent significance level) between the interaction terms and large size (high profitability) firms (columns 3 and 5), linear restrictions tests show the effect of internationalization on relations between non-debt tax shields and zero leverage is significant for the high-profitability cohort only.
The results on growth opportunities show that higher market-to-book values decrease the odds of zero leverage for DOM except for small size and low-tax cohorts. The interaction terms indicate the absence of significant relations for MNC with sole exception of a significant, inverse effect for the low-tax cohort.
In line with full-sample results and consistent with the financial constraints hypothesis, the coefficient on actual tax is significant for DOM in the high-constraints, small, low-profitability, and low-actual tax cohorts. However, coefficients on the interaction terms turn negative and significant for the respective MNC cohorts (bar the low-tax cohort). Notwithstanding, linear restrictions tests show the effect of internationalization on relations between actual tax and zero leverage for those subsets is statistically insignificant. This reaffirms our prior conclusion that tax-related financial constraints considerations do not affect zero-leverage policy at MNC.
Whereas coefficients on Z-score confirm full-sample results, we note some interesting findings on industry concentration across cohorts. Contrary to the full-sample results, industry concentration turns positive (negative) for low- (high-) constraints and large (small and low-profitability) DOM. Negative coefficients conform to an agency perspective that competition substitutes for debt in disciplining the managers of more constrained DOM. Concomitantly, firms eschew debt because debt is more expensive in riskier and highly competitive environments. In contrast, the positive coefficient for the less constrained cohort endorses the financial flexibility view that this cohort of DOM eschew debt when operating in less competitive environments. The insignificant interaction term coefficients suggest a similar interpretation for MNC though a sole exception is the negative and significant (at 10 percent level) coefficient for large MNC.
In sum, our evidence implies that financial constraints drive the zero-leverage policies of large, low-tangibility, and low-tax DOM, whereas need for financial flexibility is the driving force for high-profitability DOM and low-profitability MNC. Trade-off theory explains the capital structure decisions of large MNC with low tangibility levels that pay high taxes, and DOM with low profitability and high levels of actual tax and tangibility.
4.3. Investment decisions and zero leverage
Our results so far provide some evidence that the pecking order and financial flexibility hypotheses dominate the trade-off and financial constraints hypotheses in explaining the zero-leverage policy of MNC. A caveat to the above analysis is that the explanatory variables may provide multiple interpretations. To shed further light on the role of financial flexibility and financial constraints in motivating zero-leverage policy, we follow prior research (see, e.g. Aivazian, Ge, and Qiu Citation2005; Dang Citation2013) and estimate a Tobin’s Q model of investment. The model examines the relationship between zero-leverage policy and future investment (see Equation 4):
(4)
(4) where,
is investment of firm
at time
, defined as the ratio of capital expenditures-to-total assets,
is a binary variable equal to unity in zero-leverage firm-year observations, zero otherwise,
is cash flow of firm
at time
, calculated as net income plus depreciation-to-total assets, and
is the Tobin’s Q ratio of firm
at time
, defined as market value of equity plus book value of debt-to-total assets.
The coefficient on cash flow captures firms’ dependency on internal funds to finance future investments. The standalone coefficient () indicates the cash flow sensitivity to investment for levered firms, while the interacted coefficient (
) shows the additional effect of zero-leverage status on this relationship. If firms strategically choose zero leverage to maintain financial flexibility and access capital markets when opportunities arise, then their cash flow sensitivity to investment should be lower. The coefficient on Tobin’s Q captures the impact of growth opportunities on firm investment. The standalone coefficient (
) indicates the growth sensitivity to investment for levered firms, while the interacted coefficient (
) shows the additional effect of zero-leverage status on this relationship. If firms strategically choose zero leverage, they should be able to translate growth opportunities into higher future investment. Therefore, the impact of growth opportunities on investment for these firms should be higher.
Table shows results. Column 2 shows estimated coefficients for panel regressions of the Tobin’s Q model of investment for all firms. The zero-leverage binary is positively related with firm investment, which confirms prior research documenting a negative relationship between leverage and investment (see, e.g. Aivazian, Ge, and Qiu Citation2005). While the standalone cash flow coefficient is also positive and significant, the interaction between cash flow and the zero-leverage binary is not significant, indicating no difference for zero-leverage firms. However, while the coefficient on growth opportunities is positive and significant, the interaction between the latter and the zero-leverage binary is negative and significant. This indicates that zero-leverage firms are translating less growth opportunities to investment, which supports the financial constraints hypothesis (Dang Citation2013).
Table 5. Firm investment and zero leverage.
Columns 3 and 4, show estimated coefficients for sub-samples of MNC and DOM, respectively. In contrast to the full sample, the results for MNC reveal that the cash flow sensitivity to investment is lower for unlevered MNC; this indicates that these firms rely less on cash flows to fund investment relative to levered MNC, a result that is consistent with the financial flexibility hypothesis. In addition, the coefficient on the interaction between growth opportunities and zero leverage is statistically insignificant, indicating both levered and unlevered MNC are equally able to translate growth opportunities into investment. However, the corresponding results for DOM (Column 4) paint a different picture. The interaction term between cash flow and zero leverage shows unlevered DOM rely more on internal funds to finance investment relative to levered DOM. What’s more, these firms can translate fewer growth opportunities into investment. Both results are consistent with the financial constraints view for zero-leverage DOM.
Overall, consistent with our previous findings, the results show significant differences in the motivation of zero leverage between MNC and DOM. In contrast to DOM, unlevered MNC seem to strategically choose zero leverage to maintain financial flexibility, which lends further support to hypothesis H1B.
4.4. Robustness checks
We perform several robustness checks to ensure the validity of our findings. For these robustness checks, we estimate variants of the baseline model specifications (Table , specifications A). To conserve space, we present robustness checks in summary format as consecutively numbered rows in Table . Column 2 presents the number of firm-year observations, while each of the subsequent columns presents coefficient estimates of the MNC proxy.
Table 6. Robustness checks.
One may argue that our proxy for zero leverage does not consider firms with such marginal levels of leverage that could be classified as cases of extreme debt conservatism. For robustness, we re-estimate all models considering almost zero-leverage firms, defined as those with firm-year observations where and specify a binary variable equal to unity for almost zero-leverage firms, zero otherwise (El Ghoul et al. Citation2018; Strebulaev and Yang Citation2013). The results of this test (Table , row 1) affirm those our baseline model.
Second, while our baseline proxy for internationalization (foreign sales-to-total sales ratio) is the oldest and most commonly used measure of firm internationalization (Marshall, Brouthers, and Keig Citation2020), it may fail to capture firms’ true international scope or presence. For example, under this measure, exporting firms could be defined as MNC even if they do not have any assets outside their home country (Erel, Jang, and Weisbach Citation2020). For robustness, we also use the foreign assets-to-total assets ratio and specify the MNC binary equal to unity if the foreign assets-to-total assets ratio exceeds the previously defined thresholds as per our baseline model, zero otherwise. The results presented in row 2 are consistent with those in our baseline model.
However, a caveat is that this measure may still mis-classify certain firms as MNC. For instance, firms that own and operate foreign assets (or subsidiaries) as offshore production sites serving an otherwise non-exporting parent would be classified as MNC under this measure. We perform two additional robustness checks, using composite definitions for MNC that combine the previous two measures. In row 3, we specify the MNC binary equal to one if the foreign assets-to-total assets ratio is greater than zero and the foreign sales-to-total sales ratio exceeds the pre-defined thresholds, zero otherwise. In row 4, we specify the MNC binary equal to one if both the foreign assets-to-total assets ratio and the foreign sales-to-total sales ratio exceed the pre-defined thresholds. In both cases our baseline results remain unchanged.
Fourth, another concern might be that the smaller number of zero-leverage firm-year observations might be introducing a class imbalance problem in our setup. This links to the broader debate on the use of conventional logistic regression for data in which events are rare, given the maximum likelihood estimation of the logistic model is well-known to suffer from small-sample bias – the latter being strongly dependent on the number of cases in the less frequent of the two categories. The problem is not specifically the rarity of events per se (i.e. the ratio of positive-to-negative outcomes), but rather the possibility of a small number of cases on the rarer of the two outcomes (i.e. in our case, the number of zero-leverage firm-year observations). Our baseline regressions have a total of 11,412 firm-year observations, out of which, 1,467 represent zero-leverage outcomes. While this does not classify as a small number for the rarer outcome from a statistical point of view, we still perform a robustness test where we instead use the Firth model (King and Zeng Citation2001), a general approach to reducing small-sample bias in maximum likelihood estimation. The results presented in row 5 are in line with our baseline findings.
Fifth, one may argue that the use of contemporaneous control variables may lead to simultaneity or reverse-causality issues. For example, it is possible that zero-leverage firms may have more resources available to expand internationally and, as such, zero leverage could be driving internationalization rather than the other way around. To alleviate this concern, we re-estimate models lagging covariates by one year and show that the baseline results do not change (see row 6).
Finally, observations within the same firm or year may be correlated due to unobserved firm-level factors (e.g. management practices and corporate culture) or factors related to the broader macroeconomic environment affecting all firms in a given year. To account for potential within-cluster correlation of the regressors and errors, we re-estimate all models using cluster-robust standard errors and covariances at the firm- or year-level. In both cases, our findings in rows 7 and 8 show that our main results hold.
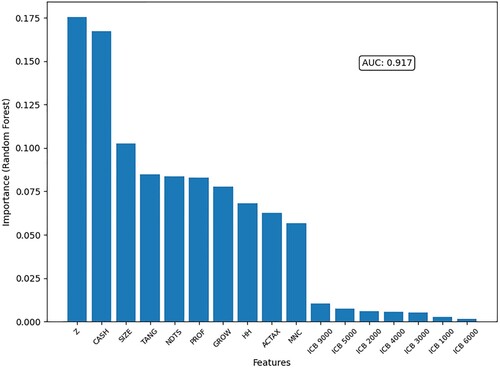
However, Amini et al. (Citation2021) argue that if conventional models, such as logistic regression are employed without considering nonlinearities and complex interactions, there is a risk of misidentifying the determinants of capital structure (and, in our case, zero leverage). They suggest that machine learning (ML) techniques may be better suited to classify a large array of determinants. Therefore, in addition to our previous robustness checks, we develop an ML experimental protocol based on the widely accepted Random Forest (RF) method (Li et al. Citation2019; Menze et al. Citation2009), which evaluates the importance of MNC in discriminating between zero-leverage and levered firms. The selection of RF, an ensemble ML method based on the Gini impurity calculation, provides an additional test of the significance of the MNC feature. The latter was tested against 16 other features as in our baseline model. All features were scrutinized via an extensive ML protocol that is based on two overlapping building blocks. The first block is related to the implementation of RF as feature importance mechanism and the second block is the utilization of RF as classifier.Footnote20 Results presented in Figure verify the importance of the MNC and other main features from our baseline model.
Figure 2. Feature importance using random forest classifier. This figure presents results using a Random Forest classifier that evaluates the importance of baseline model variables (features) in discriminating between zero-leverage and levered firms. Feature importance scores are presented on the vertical axis. The features are presented on the horizontal axis and defined in Appendix . and in Table . AUC is the area under the ROC curve.
5. Conclusions
Despite the acknowledged benefits of debt, a persistent and puzzling empirical irregularity is that many firms adopt zero-leverage policies including a non-negligible number which have increased their international presence. To date, no study has attempted to explain the effect of internationalization on the zero-leverage phenomenon. Our study contributes early evidence by examining whether internationalization affects the odds of zero leverage.
Our main result shows the odds of zero leverage increase in the level of internationalization. This finding is robust to alternative levels of internationalization with the odds of zero leverage increasing in internationalization both statistically and economically. For all firms, no sole capital structure theory can predict zero leverage. The odds of zero leverage are greater for smaller firms or firms paying higher taxes because of financial constraints these firms face. In contrast, the odds of zero leverage are greater for firms holding larger cash reserves because firms desire financial flexibility. Pecking order theory predicts the odds of zero leverage are lower for high-growth firms and higher for firms with lower probability of bankruptcy.
Further analysis reveals significant variations in the underlying dynamics of zero leverage between DOM and MNC. Our results for DOM suggest that a combination of pecking order theory and financial constraints considerations are primary drivers of zero leverage. However, pecking order and financial flexibility concerns are more important for MNC. Segmenting our sample into different cohorts sheds further light and leads to our third result. The zero-leverage policies of MNC are conditional upon the level of financial constraints. Financially constrained MNC behave more like DOM. In contrast, for less financially constrained MNC, the odds of zero leverage increase because of the need to maintain financial flexibility. We obtain a fourth result by modelling the investment policies of levered and zero-leverage firms. Whereas MNC strategically choose zero leverage to maintain financial flexibility, unlevered DOM are driven by financial constraints.
Overall, we provide new insights on the effects of internationalization on zero-leverage policy. Future research could shed further light on the underlying dynamics affecting the zero-leverage decision of MNC and the effects of this policy on firm performance. For example, other areas of interest that fall outside the scope of this study could include the potential impact of agency costs, foreign exchange risk, and political risk on the zero-leverage decision of MNC. Finally, although our sampled UK firm-years likely represent the population due to the UK's dominant role in the global economy, caution is needed in generalizing our results to other regions. Future research could analyze multiple countries, while considering country-specific cultural, political, regulatory, and economic factors.
Acknowledgement
We thank the Editor (Chris Adcock) and two anonymous referees for their insightful comments and suggestions. We are grateful to Adamantios Ntakaris for advice on developing a machine learning protocol for one of our robustness checks. We also thank Viet Anh Dang, Kostas Kalogeropoulos, and Issam Malki for helpful advice. The paper was presented at the 2021 FMA Europe virtual conference. Earlier versions were presented at the 2016 British Accounting and Finance Association Annual Conference, the 2016 Multinational Finance Society Conference, the 2015 Financial Engineering and Banking Society Conference, and the 2015 International Finance and Banking Society Oxford Conference. We would like to thank session participants and, in particular, Alain Chevalier, Nicholas Geoffrey Crain, Sadok El Ghoul, Izidin El Kalak, Costas Lambrinoudakis, Themistoklis Lazaridis, Yulia Titova, and Jiri Tresl for their constructive feedback and insightful suggestions. All errors are our own.
Disclosure statement
No potential conflict of interest was reported by the author(s).
Additional information
Notes on contributors
Eleni Chatzivgeri
Eleni Chatzivgeri has been a Senior Teaching Fellow at Edinburgh University Business School since July 2021. She was previously at Heriot-Watt University where she was an Assistant Professor in Accounting. She holds a BSc in Economics, an MSc in International Accounting and Finance and a PhD in Accounting. She has published papers in Critical Perspectives on Accounting, International Journal of Finance and Economics and Economics Letters. Eleni's research findings (Chatzivgeri et al., 2017; 2020) have been used by NGOs in their advocacy campaigns to improve transparency legislation for large extractive companies. Her collaboration has focused on developing/co-creating research that has an impact on communities outwit academia, specifically the work with NGOs and informing international debates about developing accounting regulation for socio-economic wellbeing.
Panagiotis Dontis-Charitos
Panagiotis Dontis-Charitos serves as Associate Professor of Finance at ESCP Business School. Previously, he was Senior Lecturer in Finance, at the University of Westminster. His main research interests are in banking, exploring the risk-return effects of bank M&A and the efficacy of bank regulations, as well as in corporate finance, currently focusing on the capital structure and taxation of multinational corporations. His work has been published in high-quality US and European peer-reviewed journals such as the Journal of Risk and Insurance, Journal of Financial Stability, and European Financial Management, among others, and presented at various international conferences. Panagiotis holds a PhD in Finance from Bayes Business School, City, University of London. He is a member of the advisory board of the BAFA Financial Markets and Institutions Special Interest Group and has acted as ad-hoc referee for scientific journals, such as the Journal of Banking and Finance and the European Journal of Finance. In the past, he has worked as a stock analyst and sales analyst in the financial services sector.
Sheeja Sivaprasad
Dr Sheeja Sivaprasad joined Westminster Business School as Senior Lecturer in Finance. Currently she is a Principal Lecturer in Finance. She completed her MSc Investment Management at Cass Business School. She then attained her PhD in Finance from Cass Business School. Her PhD thesis was titled ‘The Value Effects of Capital Structure.’ Sheeja teaches on the undergraduate and postgraduate courses. The modules include Financial Markets and Institutional Investment Management, Financial Strategy, Valuation of Securities, Modern Portfolio Management and Research Methods. Previously, she was the course leader for MSc Global Finance and MSc Investment and Risk Finance programmes. Currently, she is the research leader for the School of Finance and Accounting (SFA). Her research interests include Capital structure, SMEs, IPOs, multinational firms, fund management and performance, firm performance. She has also successfully supervised PhD thesis and post graduate dissertations. She has also been an external PhD examiner. She has successfully organised the school research seminar series and the Finance and Accounting Research Symposium.
Jonathan Williams
Jonathan Williams Professor Jonathan Williams joined the University of Surrey in June 2022 as Professor of Finance and Accounting. A banking and finance specialist, he is also Visiting Professor at the University of Turin, the University of Malta, and Zhejiang University of Finance and Economics. Professor Williams is the Chair of the European Association of Teachers of Banking and Finance (The Wolpertinger Group), Treasurer of the Financial Markets and Institutions Special Interest Group of BAFA (British Accounting and Finance Association), and a member of the Chartered Banker Institute's Quality and Standards Committee. Professor Williams has published in leading international journals including the Journal of Corporate Finance, Journal of Banking and Finance, Journal of Financial Stability, and Regional Studies amongst others. He has presented his research at institutions including The World Bank and Deutsche Bundesbank and at conferences and universities in countries across the world. His current research interests include executive compensation and corporate governance, financial deregulation and competitiveness, and FinTech.
Notes
1 The initial BEPS action plan was first published by the OECD in July 2013 and set out 15 BEPS actions. In October 2015 the OECD and G20 published final reports outlining consensus recommendations. More recently, in October 2021, more than 135 countries have agreed to the plan, which represents the biggest corporate tax reform in the last century. It includes a 15 per cent global minimum effective corporate tax rate, and new rules to force MNC to declare profits and pay more in the countries where they do business (for details, see https://www.oecd.org/tax/beps/).
2 These authors build upon existing capital structure research including Frank and Goyal (Citation2003; Citation2009), Myers (Citation1977), Rajan and Zingales (Citation1995), and Titman and Wessels (Citation1988).
3 Empirical research on capital structure comprises, though is not limited to, studies investigating determinants of capital structure, the effect of capital structure on stock returns, and the relationship between capital structure and market timing. To keep our task manageable, we overview evidence on capital structure determinants without intending to lessen the importance of any excluded studies. For evidence on the interaction between capital structure and returns, see George and Hwang (Citation2010), Gomes and Schmid (Citation2010), Hamada (Citation1972), Muradoglu and Sivaprasad (Citation2012a; Citation2012b), and Penman, Richardson, and Tuna (Citation2007); for evidence on market timing, see Alti (Citation2006), Baker and Wurgler (Citation2002), and Mahajan and Tartaroglu (Citation2008).
4 According to Admati et al. (Citation2018, 148) ‘the leverage ratchet effect implies that leverage begets more leverage. Because past leverage decisions distort future leverage choices, capital structure becomes history-dependent’. This implies that firms consider their future financial flexibility when considering debt financing.
5 We note that hypotheses H1A and H1B may hold simultaneously for different categories of MNC. We set out to determine which hypothesis has stronger empirical support; specifically, if financial flexibility considerations dominate financial constraints in driving MNC zero-leverage policy.
6 Logistic analysis is used elsewhere to examine conservative financial policy (see Minton and Wruck Citation2001).
7 See sections 3.3 and 3.4 and Appendix .
8 https://www.investmentmonitor.ai/uncategorized/where-are-the-global-hotspots-for-mnc-subsidiaries/
9 Prior research shows that MNC favour strategic locations that enable access to capital markets (Meyer and Benito Citation2016) and are globally connected (Goerzen, Asmussen, and Nielsen Citation2013). What makes the UK a particularly attractive hub for MNC are its financial markets that enable access to capital through a diverse range of investors and financing options, and its geographical location that offers easy access to markets in the US, Europe, Asia, and Africa.
10 For robustness, we also consider firms with almost zero leverage, defined as those with firm-year observations where and specify a binary variable equal to unity to identify almost zero-leverage firms, zero otherwise (Strebulaev and Yang Citation2013; El Ghoul et al. Citation2018). We obtain comparable results; see Section 4.4.
11 Various definitions exist for internationalization (see Aggarwal et al. Citation2011, for a detailed summary). We follow prior research and use the ratio of foreign sales-to-total sales (Chen et al. Citation1997; Park, Suh, and Yeung Citation2013). For robustness, we use the ratio of foreign assets-to-total assets as well as a composite measure combining the two metrics and obtain comparable results – see Section 4.4. for details. The percentage threshold defining internationalization (MNC) varies across studies from although results are largely consistent. While our base definition is
, we vary this threshold at intervals between
. See Section 4.2. In unreported robustness checks, we also use a continuous measure to define MNC (see Guedhami et al. Citation2022), namely the ratio of foreign sales (assets)-to-total-sales (assets) and obtain comparable results. Nonetheless, we call for caution in interpreting the results using this proxy, because they pertain to the effect of a unit increase in the foreign sales (assets) ratio on the log-odds of zero leverage and, as such, do not specifically address our research question on the effect of MNC on zero leverage.
12 Appendix . defines all variables together with their expected and observed signs.
13 Others use cash holdings to proxy future financial constraints (Erel, Jang, and Weisbach Citation2015). The difference between the financial constraints and financial flexibility hypotheses is that under the former firms do not raise debt because they lack external financing whereas under the latter debt is not raised for strategic reasons (Dang Citation2013).
14 We re-estimate all models, first, using cluster-robust standard errors and covariances at the firm- or year-level and, second, lagging covariates by one period. In both cases, the main results are not materially affected – see Section 4.4. for details.
15 The standalone coefficients indicate relationships between the control variables and zero leverage for DOM. The coefficients on interaction terms show the additional effect of MNC status on these relationships. We obtain the full effect of MNC on relationships between variables and zero leverage by summing the standalone and interaction coefficients (). We perform linear restriction tests of the null hypothesis: H0:
. See for key findings. Further detailed results are available upon request.
16 Interpreting the MNC dummy in the augmented specification is more difficult as it represents the effect of MNC when all other explanatory variables equal zero. Since these are continuous variables, it is unlikely they equal zero often, if at all, which renders the coefficient on MNC relatively meaningless by itself.
17 Model 1 is the exception with a positive, significant coefficient on the interaction term (MNC × Cash) though we caution that this model presents a rather broad definition of internationalization.
18 We construct the financial constraints index for each firm-year observation following Whited and Wu (Citation2006).
19 We use median values as the cut-off point. In unreported results we use the mean as the cut-off point. The results are comparable.
20 Both blocks are part of a wider simulation that runs several iterations to verify the importance of the proposed feature. The simulation considers a constant change of the RF random state with 200 and 100 estimators for the first and second blocks, respectively. The experimental protocol is also equipped with the calculation of the Area Under the Curve (AUC) values that we calculate in every iteration, and we report the average value.
References
- Admati, A. R., P. M. Demarzo, M. F. Hellwig, and P. Pfleiderer. 2018. “The Leverage Ratchet Effect.” The Journal of Finance 73 (1): 145–198. https://doi.org/10.1111/jofi.12588.
- Aggarwal, R., J. Berrill, J. Hutson, and C. Kearney. 2011. “What is a Multinational Corporation? Classifying the Degree of Firm-Level Multinationality.” International Business Review 20 (5): 557–577. https://doi.org/10.1016/j.ibusrev.2010.11.004.
- Aivazian, V. A., Y. Ge, and J. Qiu. 2005. “The Impact of Leverage on Firm Investment: Canadian Evidence.” Journal of Corporate Finance 11 (1-2): 277–291. https://doi.org/10.1016/S0929-1199(03)00062-2.
- Akhtar, S. 2005. “The Determinants of Capital Structure for Australian Multinational and Domestic Corporations.” Australian Journal of Management 30 (2): 321–341. https://doi.org/10.1177/031289620503000208.
- Almeida, H., M. Campello, and M. S. Weisbach. 2004. “The Cash Flow Sensitivity of Cash.” The Journal of Finance 59 (4): 1777–1804. https://doi.org/10.1111/j.1540-6261.2004.00679.x.
- Alti, A. 2006. “How Persistent is the Impact of Market Timing on Capital Structure?” The Journal of Finance 61 (4): 1681–1710. https://doi.org/10.1111/j.1540-6261.2006.00886.x.
- Altman, E. I. 1968. “Financial Ratios, Discriminant Analysis and the Prediction of Corporate Bankruptcy.” The Journal of Finance 23 (4): 589–609. https://doi.org/10.1111/j.1540-6261.1968.tb00843.x.
- Amini, S., R. Elmore, Ö Öztekin, and J. Strauss. 2021. “Can Machines Learn Capital Structure Dynamics?” Journal of Corporate Finance 70: 102073. https://doi.org/10.1016/j.jcorpfin.2021.102073.
- Baker, M., and J. Wurgler. 2002. “Market Timing and Capital Structure.” The Journal of Finance 57 (1): 1–32. https://doi.org/10.1111/1540-6261.00414.
- Bancel, F., and U. R. Mittoo. 2004. “Cross-country Determinants of Capital Structure Choice: A Survey of European Firms.” Financial Management 33 (4): 103–132. https://www.jstor.org/stable/3666330.
- Bartov, E., G. M. Bodnar, and A. Kaul. 1996. “Exchange Rate Variability and the Riskiness of U.S. Multinational Firms: Evidence from the Breakdown of the Bretton Woods System.” Journal of Financial Economics 42 (1): 105–132. https://doi.org/10.1016/0304-405X(95)00873-D.
- Bessler, W., W. Drobetz, R. Haller, and I. Meier. 2013. “The International Zero-Leverage Phenomenon.” Journal of Corporate Finance 23: 196–221. https://doi.org/10.1016/j.jcorpfin.2013.08.004.
- Billett, M. T., T. H. D. King, and D. Mauer. 2007. “Growth Opportunities and the Choice of Leverage, Debt Maturity, and Covenants.” The Journal of Finance 62 (2): 697–730. https://doi.org/10.1111/j.1540-6261.2007.01221.x.
- Blomström, M., and A. Kokko. 1998. “Multinational Corporations and Spillovers.” Journal of Economic Surveys 12 (3): 247–277. https://doi.org/10.1111/1467-6419.00056.
- Blouin, J. L. 2012. “Taxation of Multinational Corporations.” Foundations and Trends in Accounting 6 (1): 1–64.https://doi.org/10.1561/1400000017.
- Buckley, P. J., and P. N. Ghauri. 2004. “Globalisation, Economic Geography and the Strategy of Multinational Enterprises.” Journal of International Business Studies 35 (2): 81–98. https://doi.org/10.1057/palgrave.jibs.8400076.
- Burgman, T. 1996. “An Empirical Examination of Multinational Corporate Capital Structure.” Journal of International Business Studies 27 (3): 553–570. https://doi.org/10.1057/palgrave.jibs.8490143.
- Byoun, S. 2011. “Financial Flexibility and Capital Structure Decision.” Accessed February 25, 2023. https://papers.ssrn.com/sol3/papers.cfm?abstract_id=1108850.
- Byoun, S., and Z. Xu. 2013. “Why Do Some Firms Go Debt Free?” Asia-Pacific Journal of Financial Studies 42 (1): 1–38. https://doi.org/10.1111/ajfs.12009.
- Campello, M. 2003. “Capital Structure and Product Markets Interactions: Evidence from Business Cycles.” Journal of Financial Economics 68 (3): 353–378. https://doi.org/10.1016/S0304-405X(03)00070-9.
- Cappa, F., G. Cetrini, and R. Oriani. 2020. “The Impact of Corporate Strategy on Capital Structure: Evidence from Italian Listed Firms.” The Quarterly Review of Economics and Finance 76: 379–385. https://doi.org/10.1016/j.qref.2019.09.005.
- Chen, C. J. P., C. S. A. Cheng, J. He, and J. Kim. 1997. “An Investigation of the Relationship Between International Activities and Capital Structure.” Journal of International Business Studies 28 (3): 563–577. https://doi.org/10.1057/palgrave.jibs.8490111.
- Chu, V. T., and T. H. L. Pham. 2021. “Zero Leverage and Product Market Competition.” SN Business & Economics 1. https://doi.org/10.1007/s43546-021-00062-9.
- Dang, V. A. 2013. “An Empirical Analysis of Zero-Leverage Firms: New Evidence from the UK.” International Review of Financial Analysis 30: 189–202. https://doi.org/10.1016/j.irfa.2013.08.007.
- DeAngelo, H., and L. DeAngelo. 2007. “Capital Structure, Payout Policy, and Financial Flexibility.” Marshall School of Business, Working Paper, No. FBE 02-06. Accessed January 25, 2016. http://ssrn.com/abstract=916093.
- DeAngelo, H., and R. Masulis. 1980. “Optimal Capital Structure Under Corporate and Personal Taxation.” Journal of Financial Economics 8 (1): 3–29. https://doi.org/10.1016/0304-405X(80)90019-7.
- Denis, D. J., and S. B. McKeon. 2012. “Debt Financing and Financial Flexibility Evidence from Proactive Leverage Increases.” Review of Financial Studies 25 (6): 1897–1929. https://doi.org/10.1093/rfs/hhs005.
- Denis, D. J., and V. T. Mihov. 2003. “The Choice among Bank Debt, non-Bank Private Debt, and Public Debt: Evidence from new Corporate Borrowings.” Journal of Financial Economics 70 (1): 3–28. https://doi.org/10.1016/S0304-405X(03)00140-5.
- Desai, M. A., C. Fritz Foley, and J. R. Hines. 2004. “A Multinational Perspective on Capital Structure Choice and Internal Capital Markets.” The Journal of Finance 59 (6): 2451–2487. https://doi.org/10.1111/j.1540-6261.2004.00706.x.
- Devos, E., U. Dhillon, M. Jagannathan, and S. Krishnamurhty. 2012. “Why are Firms Unlevered?” Journal of Corporate Finance 18 (3): 664–682. https://doi.org/10.1016/j.jcorpfin.2012.03.003.
- Doukas, J. A., and C. Pantzalis. 2003. “Geographic Diversification and Agency Costs of Debt of Multinational Firms.” Journal of Corporate Finance 9 (1): 59–92. https://doi.org/10.1016/S0929-1199(01)00056-6.
- Duran, M. M., and S. Stephen. 2020. “Internationalization and the Capital Structure of Firms in Emerging Markets: Evidence from Latin America Before and After the Financial Crisis.” Research in International Business and Finance 54: 101288. https://doi.org/10.1016/j.ribaf.2020.101288.
- El Ghoul, S., O. Guedhami, C. Kwok, and X. Zheng. 2018. “Zero-leverage Puzzle: An International Comparison.” Review of Finance 22 (3): 1063–1120. https://doi.org/10.1093/rof/rfw065.
- Erel, I., Y. Jang, and M. Weisbach. 2015. “Do Acquisitions Relieve Target Firms’ Financial Constraints?” The Journal of Finance 70 (1): 289–328. https://doi.org/10.1111/jofi.12155.
- Erel, I., Y. Jang, and M. Weisbach. 2020. “The Corporate Finance of Multinational Firms.” NBER WORKING PAPER SERIES. Accessed February 23, 2023. https://www.nber.org/system/files/working_papers/w26762/w26762.pdf.
- Errunza, V. R., and L. W. Senbet. 1981. “The Effects of International Operations on the Market Value of the Firm: Theory and Evidence.” The Journal of Finance 36 (2): 401–417. https://doi.org/10.1111/j.1540-6261.1981.tb00455.x.
- Faccio, M., and J. Xu. 2015. “Taxes and Capital Structure.” Journal of Financial and Quantitative Analysis 50 (3): 277–300. https://doi.org/10.1017/S0022109015000174.
- Fama, E., and K. French. 2002. “Testing Trade-off and Pecking Order Predictions About Dividends and Debt.” Review of Financial Studies 15 (1): 1–33. https://www.jstor.org/stable/2696797.
- Fatemi, A. M. 1988. “The Effect of International Diversification on Corporate Financing Policy.” Journal of Business Research 16 (1): 17–30. https://doi.org/10.1016/0148-2963(88)90078-1.
- Faulkender, M., and J. M. Smith. 2016. “Taxes and Leverage at Multinational Corporations.” Journal of Financial Economics 122 (1): 1–20. https://doi.org/10.1016/j.jfineco.2016.05.011.
- Ferrando, A., M. T. Marchica, and R. Mura. 2017. “Financial Flexibility and Investment Ability Across the Euro Area and the UK.” European Financial Management 23 (1): 87–126. https://doi.org/10.1111/eufm.12091.
- Flannery, M. J., and K. P. Rangan. 2006. “Partial Adjustment Toward Target Capital Structures.” Journal of Financial Economics 79 (3): 469–506. https://doi.org/10.1016/j.jfineco.2005.03.004.
- Frank, M. Z., and V. K. Goyal. 2003. “Testing the Pecking Order Theory of Capital Structure.” Journal of Financial Economics 67 (2): 217–248. https://doi.org/10.1016/S0304-405X(02)00252-0.
- Frank, M. Z., and V. K. Goyal. 2009. “Capital Structure Decisions: Which Factors are Reliably Important?” Financial Management 38 (1): 1–37. https://doi.org/10.1111/j.1755-053X.2009.01026.x.
- Gamba, A., and A. Triantis. 2008. “The Value of Financial Flexibility.” The Journal of Finance 63 (5): 2263–2296. https://doi.org/10.1111/j.1540-6261.2008.01397.x.
- George, T. J., and C. Y. Hwang. 2010. “A Resolution of the Distress Risk and Leverage Puzzles in the Cross Section of Stock Returns.” Journal of Financial Economics 96 (1): 56–79. https://doi.org/10.1016/j.jfineco.2009.11.003.
- Goerzen, A., C. G. Asmussen, and B. B. Nielsen. 2013. “Global Cities and Multinational Enterprise Location Strategy.” Journal of International Business Studies 44 (5): 427–450.https://doi.org/10.1057/jibs.2013.11.
- Goldbach, S., J. Møen, D. Schindler, G. Schjelderup, and G. Wamser. 2021. “The tax-Efficient use of Debt in Multinational Corporations.” Journal of Corporate Finance 71: 102119. https://doi.org/10.1016/j.jcorpfin.2021.102119.
- Gomes, J. F., and L. Schmid. 2010. “Levered Returns.” The Journal of Finance 65 (2): 467–494. https://www.jstor.org/stable/25656301.
- Graham, J. R. 2000. “How big are the tax Benefits of Debt?” The Journal of Finance 55 (5): 1901–1941. https://doi.org/10.1111/0022-1082.00277.
- Graham, J. R., and C. R. Harvey. 2001. “The Theory and Practice of Corporate Finance: Evidence from the Field.” Journal of Financial Economics 60 (2-3): 187–243. https://doi.org/10.1016/S0304-405X(01)00044-7.
- Guariglia, A., and J. Yang. 2016. “A Balancing act: Managing Financial Constraints and Agency Costs to Minimize Investment Inefficiency in the Chinese Market.” Journal of Corporate Finance 36: 111–130. https://doi.org/10.1016/j.jcorpfin.2015.10.006.
- Guedhami, O., A. M. Knill, W. L. Megginson, and L. W. Senbet. 2022. “The Dark Side of Globalization: Evidence from the Impact of COVID-19 on Multinational Companies.” Journal of International Business Studies 53 (8): 1603–1640. https://doi.org/10.1057/s41267-022-00540-8.
- Haddad, K., and B. Lotfaliei. 2019. “Trade-off Theory and Zero Leverage.” Finance Research Letters 31 (C): 165–170. https://doi.org/10.1016/j.frl.2019.04.011.
- Hadlock, C. J., and J. R. Pierce. 2010. “New Evidence on Measuring Financial Constraints: Moving Beyond the KZ Index.” Review of Financial Studies 23 (5): 1909–1940. https://www.jstor.org/stable/40604834.
- Hamada, R. S. 1972. “The Effect of the Firm’s Capital Structure on the Systematic Risk of Common Stocks.” The Journal of Finance 27 (2): 435–452. https://doi.org/10.1111/j.1540-6261.1972.tb00971.x.
- Harris, M., and A. Raviv. 1990. “Capital Structure and the Informational Role of Debt.” The Journal of Finance 45 (2): 321–349. https://doi.org/10.1111/j.1540-6261.1990.tb03693.x.
- Hoberg, G., G. Phillips, and N. Prabhala. 2014. “Product Market Threats, Payouts, and Financial Flexibility.” The Journal of Finance 69 (1): 293–324. https://doi.org/10.1111/jofi.12050.
- Hovakimian, A., G. Hovakimian, and H. Tehranian. 2004. “Determinants of Target Capital Structure: The Case of Dual Debt and Equity Issues.” Journal of Financial Economics 71 (3): 517–540. https://doi.org/10.1016/S0304-405X(03)00181-8.
- Huang, Z., W. Li, and W. Gao. 2016. “Why Do Firms Choose Zero-Leverage Policy? Evidence from China.” Applied Economics 49 (28): 2736–2748. https://doi.org/10.1080/00036846.2016.1245845.
- Huizinga, H., L. Laeven, and G. Nicodeme. 2008. “Capital Structure and International Debt Shifting.” Journal of Financial Economics 88 (1): 80–118. https://doi.org/10.1016/j.jfineco.2007.05.006.
- Jang, Y. 2013. “International Corporate Diversification and Financial Flexibility.” The Review of Financial Studies 30 (12): 4133–4178. https://doi.org/10.1093/rfs/hhx065.
- Jensen, M., and W. Meckling. 1976. “Theory of the Firm: Managerial Behavior, Agency Costs and Ownership Structure.” Journal of Financial Economics 3 (4): 305–360. https://doi.org/10.1016/0304-405X(76)90026-X.
- Jermias, J. 2008. “The Relative Influence of Competitive Intensity and Business Strategy on the Relationship Between Financial Leverage and Performance.” The British Accounting Review 40 (1): 71–86. https://doi.org/10.1016/j.bar.2007.11.001.
- King, G., and L. Zeng. 2001. “Logistic Regression in Rare Events Data.” Political Analysis 9 (2): 137–163. https://doi.org/10.1093/oxfordjournals.pan.a004868.
- Korteweg, A. 2010. “The Net Benefits to Leverage.” The Journal of Finance 65 (6): 2137–2170. https://doi.org/10.1111/j.1540-6261.2010.01612.x.
- Lambrinoudakis, C., G. Skiadopoulos, and K. Gkionis. 2019. “Capital Structure and Financial Flexibility: Expectations of Future Shocks.” Journal of Banking & Finance 104: 1–18. https://doi.org/10.1016/j.jbankfin.2019.03.016.
- Lee, K., and C. Kwok. 1988. “Multinational Corporations vs. Domestic Corporations: International Environmental Factors and Determinants of Capital Structure.” Journal of International Business Studies 19 (2): 195–217. https://www.jstor.org/stable/155022.
- Lee, H., and G. Moon. 2011. “The Long-Run Equity Performance of Zero-Leverage Firms.” Managerial Finance 37 (10): 872–889. https://doi.org/10.1108/03074351111161565.
- Lessard, D. R. 1973. "International Portfolio Diversification: A Multivariate Analysis for a Group of Latin American Countries.” The Journal of Finance 28 (3): 619–633. https://doi.org/10.1111/j.1540-6261.1973.tb01384.x.
- Levy, H., and M. Sarnat. 1970. “International Diversification of Investment Portfolios.” The American Economic Review 60 (4): 668–675. https://www.jstor.org/stable/1818410.
- Li, X., Υ Wang, S. Basu, K. Kumbier, and B. Yu. 2019. “A Debiased MDI Feature Importance Measure for Random Forests." Advances in Neural Information Processing Systems 32.
- Lindner, T., F. Klein, and S. Schmidt. 2018. “The Effect of Internationalization on Firm Capital Structure: A Meta-Analysis and Exploration of Institutional Contingencies.” International Business Review 27 (6): 1238–1249. https://doi.org/10.1016/j.ibusrev.2018.05.005.
- Lotfaliei, B. 2018. “Zero Leverage and the Value in Waiting to Have Debt.” Journal of Banking & Finance 97: 335–349. https://doi.org/10.1016/j.jbankfin.2018.09.010.
- Mahajan, A., and S. Tartaroglu. 2008. “Equity Market Timing and Capital Structure: International Evidence.” Journal of Banking & Finance 32 (5): 754–766. https://doi.org/10.1016/j.jbankfin.2007.05.007.
- Mansi, S. A., and D. M. Reeb. 2002. “Corporate Diversification: What Gets Discounted?” The Journal of Finance 57 (5): 2167–2183. https://doi.org/10.1111/0022-1082.00492.
- Marchica, M. T., and R. Mura. 2010. “Financial Flexibility, Investment Ability, and Firm Value: Evidence from Firms with Spare Debt Capacity.” Financial Management 39 (4): 1339–1365. https://doi.org/10.1111/j.1755-053X.2010.01115.x.
- Marshall, V. C., L. E. Brouthers, and D. L. Keig. 2020. “RIMS: A New Approach to Measuring Firm Internationalization.” Journal of International Business Studies 51 (7): 1133–1141. https://doi.org/10.1057/s41267-020-00320-2.
- Matemilola, B. T., and R. Ahmad. 2015. “Debt Financing and Importance of Fixed Assets and Goodwill Assets as Collateral: Dynamic Panel Evidence.” Journal of Business Economics and Management 16 (2): 407–421. https://doi.org/10.3846/16111699.2013.772916.
- McMillan, D. G., and O. Camara. 2012. “Dynamic Capital Structure Adjustment: Us MNCs & DCs.” Journal of Multinational Financial Management 22 (5): 278–301. https://doi.org/10.1016/j.mulfin.2012.10.001.
- Menze, B. H., B. M. Kelm, R. Masuch, U. Himmelreich, P. Bachert, W. Petrich, and F. A. Hamprecht. 2009. “A Comparison of Random Forest and its Gini Importance with Standard Chemometric Methods for the Feature Selection and Classification of Spectral Data.” BMC Bioinformatics 10 (1): 213. https://doi.org/10.1186/1471-2105-10-213.
- Meyer, K. E., and G. R. G. Benito. 2016. “Where Do MNEs Locate Their Headquarters? At Home!.” Global Strategy Journal 6 (2): 149–159. https://doi.org/10.1002/gsj.1115.
- Miglo, A. 2020. “Zero-Debt Policy Under Asymmetric Information, Flexibility and Free Cash Flow Considerations.” Journal of Risk and Financial Management 13 (12): 296. https://doi.org/10.3390/jrfm13120296.
- Miller, E. M. 1977. “Risk, Uncertainty, and Divergence of Opinion.” The Journal of Finance 32 (4): 1151–1168. https://doi.org/10.1111/j.1540-6261.1977.tb03317.x.
- Minton, B. A., and K. H. Wruck. 2001. “Financial Conservatism: Evidence on Capital Structure from Low Leverage Firms.” AFA 2002 Atlanta; Dice Ctr. Working Paper, No. 2001-6. Accessed January 6, 2016. http://ssrn.com/abstract=269608.
- Mittoo, U. R., and Z. Zhang. 2008. “The Capital Structure of Multinational Corporations: Canadian Versus U.S. Evidence.” Journal of Corporate Finance 14 (5): 706–720. https://doi.org/10.1016/j.jcorpfin.2008.09.012.
- Modigliani, F., and M. Miller. 1958. “The Cost of Capital, Corporation Finance and the Theory of Investment.” The American Economic Review 48 (3): 261–297. https://www.jstor.org/stable/1809766.
- Modigliani, F., and M. Miller. 1963. “Corporate Income Taxes and the Cost of Capital, a Correction.” The American Economic Review 53 (3): 433–443. https://www.jstor.org/stable/1809167.
- Muradoglu, G., and S. Sivaprasad. 2012a. “Capital Structure and Abnormal Returns.” International Business Review 21 (3): 328–341. https://doi.org/10.1016/j.ibusrev.2011.03.007.
- Muradoglu, G., and S. Sivaprasad. 2012b. “Using Firm-Level Leverage as an Investment Strategy.” Journal of Forecasting 31 (3): 260–279. https://doi.org/10.1002/for.1221.
- Myers, S. 1977. “Determinants of Corporate Borrowing.” Journal of Financial Economics 5 (2): 147–175. https://doi.org/10.1016/0304-405X(77)90015-0.
- Myers, S. 1984. “The Capital Structure Puzzle.” The Journal of Finance 39 (3): 575–592.https://doi.org/10.2307/2327916.
- Myers, S., and N. Majluf. 1984. “Corporate Investment and Financing Decisions When Firms Have Information That Investors Do not Have.” Journal of Financial Economics 13 (2): 187–221. https://doi.org/10.1016/0304-405X(84)90023-0.
- Narula, R., and J. H. Dunning. 2000. “Industrial Development, Globalization and Multinational Enterprises: New Realities for Developing Countries.” Oxford Development Studies 28 (2): 141–167. https://doi.org/10.1080/713688313.
- Narula, R., and J. H. Dunning. 2010. “Multinational Enterprises, Development and Globalization: Some Clarifications and a Research Agenda.” Oxford Development Studies 38 (3): 263–287. https://doi.org/10.1080/13600818.2010.505684.
- O’ Hagan-Luff, M., and J. Berrill. 2015. “Why Stay-at-Home Investing Makes Sense” International Review of Financial Analysis 38: 1–14. https://doi.org/10.1016/j.irfa.2015.01.002.
- Park, S. H., J. Suh, and B. Yeung. 2013. “Do Multinational and Domestic Corporations Differ in Their Leverage Policies?” Journal of Corporate Finance 20: 115–139. https://doi.org/10.1016/j.jcorpfin.2012.08.001.
- Penman, S. H., S. A. Richardson, and I. Tuna. 2007. “The Book-to-Price Effect in Stock Returns: Accounting for Leverage.” Journal of Accounting Research 45 (2): 427–467. https://doi.org/10.1111/j.1475-679X.2007.00240.x.
- Rajan, R., and L. Zingales. 1995. “What Do we Know About Capital Structure? Some Evidence from International Data.” The Journal of Finance 50 (5): 1421–1460. https://doi.org/10.1111/j.1540-6261.1995.tb05184.x.
- Reeb, D. M., S. A. Mansi, and J. M. Allee. 2001. “Firm Internationalization and the Cost of Debt Financing: Evidence from Non-Provisional Publicly Traded Debt.” The Journal of Financial and Quantitative Analysis 36 (3): 395–414. https://doi.org/10.2307/2676289.
- Scott, J. H. 1977. “Bankruptcy, Secured Debt, and Optimal Capital Structure.” The Journal of Finance 32 (1): 1–19. https://doi.org/10.1111/j.1540-6261.1977.tb03237.x.
- Shyam-Sunder, L., and S. C. Myers. 1999. “Testing Static Trade Off Against Pecking Order Models of Capital Structure.” Journal of Financial Economics 51 (2): 219–244. https://doi.org/10.1016/S0304-405X(98)00051-8.
- Singh, K., and J. E. Hodder. 2000. “Multinational Capital Structure and Financial Flexibility.” Journal of International Money and Finance 19 (6): 853–884. https://doi.org/10.1016/S0261-5606(00)00038-3.
- Singh, M., and A. Nejadmalayeri. 2004. “Internationalization, Capital Structure, and Cost of Capital: Evidence from French Corporations.” Journal of Multinational Financial Management 14 (2): 153–169. https://doi.org/10.1016/j.mulfin.2003.07.003.
- Stiglitz, J. E., and A. Weiss. 1981. “Credit Rationing in Markets with Imperfect Information.” The American Economic Review 71 (3): 393–410. https://www.jstor.org/stable/1802787.
- Strebulaev, I. A., and B. Yang. 2013. “The Mystery of Zero-Leverage Firms.” Journal of Financial Economics 109 (1): 1–23. https://doi.org/10.1016/j.jfineco.2013.02.001.
- Stultz, R. 1988. “Managerial Control of Voting Rights: Financing Policies and the Market for Corporate Control.” Journal of Financial Economics 20: 25–54. https://doi.org/10.1016/0304-405X(88)90039-6.
- Titman, S., and R. Wessels. 1988. “The Determinants of Capital Structure Choice.” The Journal of Finance 43 (1): 1–19. https://doi.org/10.1111/j.1540-6261.1988.tb02585.x.
- Toplensky, R. 2018. “Multinationals Pay Lower Taxes than a Decade Ago.” The Financial Times, March 11. Accessed February 25, 2021. https://on.ft.com/3mPuDrl.
- Valta, P. 2012. “Competition and the Cost of Debt.” Journal of Financial Economics 105 (3): 661–682. https://doi.org/10.1016/j.jfineco.2012.04.004.
- Whited, T. M., and G. Wu. 2006. “Financial Constraints Risk.” Review of Financial Studies 19 (2): 531–559. https://doi.org/10.1093/rfs/hhj012.
- Williamson, O. E. 1963. “A Model of Rational Managerial Behaviour.” In A Behavioural Theory of the Firm, edited by R. M. Cyert, and J. G. March. Englewook Cliffs, NJ: Prentice-Hall.
- Wooldridge, J. M. 2002. Econometric Analysis of Cross Section and Panel Data. Cambridge, MA: MIT Press.
- Xu, J. 2012. “Profitability and Capital Structure: Evidence from Import Penetration.” Journal of Financial Economics 106 (2): 427–446. https://doi.org/10.1016/j.jfineco.2012.05.015.
Appendix
Table A.1. Definitions of Variables and Key Output
