
Abstract
Objective: To derive a plasma biomarker protein panel from a list of 141 candidate proteins which can differentiate transient ischaemic attack (TIA)/minor stroke from non-cerebrovascular (mimic) conditions in emergency department (ED) settings.
Design: Prospective clinical study (#NCT03050099) with up to three timed blood draws no more than 36 h following symptom onset. Plasma samples analysed by multiple reaction monitoring-mass spectrometry (MRM-MS).
Participants: Totally 545 participants suspected of TIA enrolled in the EDs of two urban medical centres.
Outcomes: 90-day, neurologist-adjudicated diagnosis of TIA informed by clinical and radiological investigations.
Results: The final protein panel consists of 16 proteins whose patterns show differential abundance between TIA and mimic patients. Nine of the proteins were significant univariate predictors of TIA [odds ratio (95% confidence interval)]: L-selectin [0.726 (0.596–0.883)]; Insulin-like growth factor-binding protein 3 [0.727 (0.594–0.889)]; Coagulation factor X [0.740 (0.603–0.908)]; Serum paraoxonase/lactonase 3 [0.763 (0.630–0.924)]; Thrombospondin-1 [1.313 (1.081–1.595)]; Hyaluronan-binding protein 2 [0.776 (0.637–0.945)]; Heparin cofactor 2 [0.775 (0.634–0.947)]; Apolipoprotein B-100 [1.249 (1.037–1.503)]; and von Willebrand factor [1.256 (1.034–1.527)]. The scientific plausibility of the panel proteins is discussed.
Conclusions: Our panel has the potential to assist ED physicians in distinguishing TIA from mimic patients.
Introduction
Minor stroke and transient ischaemic attack (TIA) are at the minor end of the ischaemic stroke continuum (Albers et al. Citation2002, Easton et al. Citation2009). At this end of the spectrum patients’ symptoms have either completely or almost resolved. However, despite relatively minor symptoms, such patients remain at a high risk of recurrent stroke. With over half of recurrent strokes occurring within 48 h of the initial event (Johnston et al. Citation2007), early recognition is paramount in order that appropriate secondary stroke prevention treatments can be implemented to prevent recurrent stroke. The diagnosis of TIA/minor stroke (henceforth, referred to simply as TIA) can be challenging for physician, because numerous other conditions (usually less serious), such as migraine, anxiety, peripheral neuropathy etc. can effectively “mimic” the clinical presentation of TIA, with up to 50% of patients being incorrectly diagnosed with TIA (Ferro et al. Citation1996, Prabhakaran et al. Citation2008, Quinn et al. Citation2009, Sheehan et al. Citation2009, Fonseca and Canhão Citation2010).
The development of a plasma protein blood test to help address the challenge of diagnosing TIA and minor stroke has been an active area of stroke research (Laskowitz et al. Citation2009, Montaner et al. Citation2010, Sharma et al. Citation2014). During ischaemic stroke, a wide range of proteins are differentially expressed in the affected brain region as part of the ischaemic cascade in response to the hypoxia which results from low blood flow (Brouns and Deyn Citation2009). As many TIA patients have evidence of damage on MRI (Kidwell et al. Citation1999, Crisostomo et al. Citation2003) the presumption is that this is also the case in other TIA patients. If the ischaemic event continues to compromise the blood-brain barrier, then ischaemic-regulating proteins may escape into peripheral circulation and be detectable in blood plasma (Fassbender et al. Citation1997, Marchi et al. Citation2004). Non-cerebrovascular conditions, in contrast, are less likely to involve the differential expression of ischaemic-regulating proteins, or correlate with risk factor biomarkers. The hope, therefore, is that a distinctive pattern of protein expression, or a “protein signature,” can be discovered for TIA/minor stroke; ultimately, this signature could be used to help differentiate TIA/minor stroke from mimic patients in clinical situations.
Several studies have seen only modest success investigating protein biomarker panels for the strongly related problem of differentiating ischaemic stroke from mimic conditions in emergency department (ED) settings (Laskowitz et al. Citation2009, Montaner et al. Citation2010, Sharma et al. Citation2014). However, some reviewers have suggested that, to date, no stroke biomarkers have been discovered that achieve clinical usefulness in real-world settings (Whiteley et al. Citation2008, Hasan et al. Citation2012). One possible explanation for this may be that the many aetiologies of stroke (e.g. cardioembolic, small vessel occlusion, large artery atherosclerosis) mean that no individual biomarker will show a consistent pattern of differential abundance across all stroke aetiologies compared to mimic conditions (Whiteley Citation2011). Several studies have proposed biomarker panels comprising multiple proteins as a way to address this problem (Laskowitz et al. Citation2009, Montaner et al. Citation2010, Whiteley et al. Citation2011, Sharma et al. Citation2014) with some improvements in the discriminatory power being reported.
The temporal nature of the ischaemic cascade has presented an additional challenge in the development of biomarker panels for the diagnosis of TIA. The cascade unfolds over the course of several hours, with different proteins involved in various stages of the cascade (anaerobic cellular metabolism, cellular apoptosis, tissue inflammatory response, etc.) (Brouns and Deyn Citation2009). This suggests that the patterns of differential abundance may well change over time relative to the index event, with different proteins being most informative at different time points. In contrast, biomarkers of pre-existing risk factors are likely to remain relatively constant over time.
Our research group – Spectrometry in TIA Rapid Assessment (SpecTRA 2016) – has been conducting a multi-phase, prospective clinical research project with the aim of developing a blood-based, proteomic biomarker panel to differentiate TIA patients from mimic patients. The panel will ultimately be deployed for use in ED settings. To maximise the clinical relevance of our study, patient enrolment has specifically occurred in the ED (cf. Whiteley et al. Citation2008), the same clinical environment for which it is being developed.
In the present study, we provide a descriptive analysis of a large number (n = 141) of candidate protein biomarkers selected from the TIA/minor stroke literature. We also examine the influence of time from symptom onset to blood draw on protein expression. We conclude our analysis by constructing a biomarker panel and describing some of the biological significance of the proteins involved. The potential diagnostic role of this panel will be assessed in a follow-up publication where we will formally evaluate the discriminatory performance of a locked-down algorithm in a validation dataset comprising a second, independent cohort of SpecTRA patients (#NCT03070067) following the PROBE study design (Pepe et al. Citation2008, Institute of Medicine Citation2010).
Clinical significance
A panel of protein biomarkers shows differential abundance between mimic and TIA patients, suggesting the possibility of a diagnostic biomarker based on plasma proteomics.
The predictive ability of the protein biomarkers to differentiate between mimic and TIA patients does not appear to change over time (<24 h from symptom onset).
Significant protein biomarkers for TIA in our study were predominately associated with cardiovascular disease.
A literature review found several proteins to have biologically plausible relations to TIA risk and aetiology.
Methods
Participants
Enrolment into the first phase of the SpecTRA study took place over an 18-month period from December 2013 to May 2015. Patients suspected of TIA or minor stroke were enrolled by stroke study nurses in the EDs of two urban medical hospitals. Stroke nurses recorded patients’ presenting clinical symptoms in the case report form (CRF). Inclusion criteria for enrolment were, (a) patient with suspected TIA or minor stroke, NIHSS <4 (Brott et al. Citation1989, NINDS Citation2003), (b) symptom onset <24 h and (c) age ≥18 years of age. Exclusion criteria were (a) isolated monocular blindness and (b) no access to either magnetic resonance imaging (MRI) within 7 days or computed tomography (CT)/computed tomography angiography (CTA) within 24 h. Symptom onset was defined as the last known time the patient was seen to be normal. Patients received either MRI and/or CTA imaging as part of the study protocol.
Patients with haemorrhagic stroke (intracerebral haemorrhage (ICH) and subarachnoid haemorrhage (SAH)) were not enrolled in the study, as the aim of the study was to focus on the diagnosis of TIA and minor ischaemic stroke. Symptoms of haemorrhagic stroke frequently differ from those of ischaemic stroke, resulting in different criteria for clinical suspicion. Haemorrhagic stroke frequently presents with headache (55.6%) in contrast to ischaemic stroke (22.4%) (Rathore et al. Citation2002). In the case of SAH, headache is the sole presenting symptom in approximately one-third of cases (Ferro et al. Citation1991). Often patients describe the thunderclap headache associated with haemorrhagic stroke as “the worst headache” of their lives (Linn et al. Citation1994, Morgenstern et al. Citation1998). Validated clinical decision rules to detect SAH in patients with severe headache have been developed (Perry et al. Citation2017). Convulsions are also more prevalent in haemorrhagic stroke than ischaemic stroke (Rathore et al. Citation2002), as well as loss of consciousness (Linn et al. Citation1994). Fortunately, non-contrast head computed tomography (CT) has an extremely high sensitivity to detect haemorrhagic stroke (Morgenstern et al. Citation1998, Huisman Citation2005, Perry et al. Citation2011), and is used extensively to rule out the diagnosis (Birenbaum et al. Citation2011). For these reasons, we focussed enrolment only on patients presenting with TIA/minor ischaemic stroke symptoms, as physicians have great difficulty in differentiating between TIA/minor ischaemic stroke and mimic patients based on presenting clinical symptoms (Prabhakaran et al. Citation2008).
Study arms
To examine the effect of time on protein expression two study arms were created. The first study arm (multiple blood draw) consisted of three, timed, blood draws. Draw 1 occurred in the ED, and took place within 6 h of symptom onset. Draw 2 occurred 4–6 h after the first blood draw, and typically occurred when patients were discharged from the ED. Draw 3 occurred 20–32 h after the first blood draw.
The second study arm (single blood draw) consisted of only one blood draw. This blood draw occurred within 24 h of symptom onset. Enrolment into the study arm was based entirely upon the patient’s time of arrival at the ED after symptom onset (i.e. patients arriving at the ED more than 6 h after symptom onset were enrolled in the single blood draw study arm).
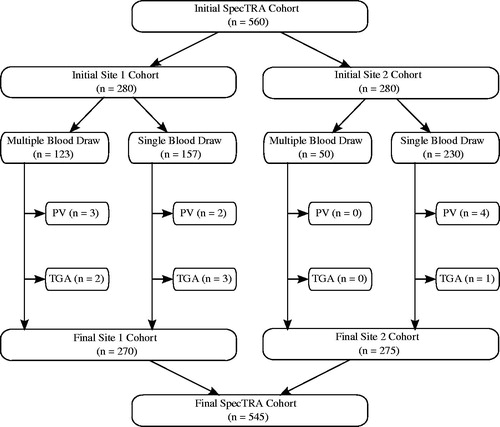
displays the enrolment of participants into the study arms at each of the two enrolling study sites. Competitive enrolment was used to enrol patients into the multiple blood draw study arm; consequently, enrolment was not equally distributed between study sites. A limitation of patient enrolment at site 2 was that the hours of operation of the research lab was restricted to business hours, Monday through Friday. In contrast, site 1 enrolment occurred 7 days a week, and it was therefore logistically easier to enrol patients into the multiple blood draw study arm.
Figure 1. Participant flow diagram for SpecTRA cohorts. PV: protocol violation. TGA: transient global amnesia. PV included: missed imaging (n = 6), no arrival at TIA unit (n = 1), ambiguous diagnosis (n = 1), blood draw out of time window (n = 1).
Plasma collection and preparation
Peripheral blood samples were drawn from the inside of the arm, as per standard of care at each study site. Needle gauge was either 18G or 21G. In an examination of the pre-analytical factors related to differences in blood draw technique at the multi-enrolling sites, some differences in needle gauge on protein abundance were observed for specific proteins; however, none of these were part of the protein panel described in the present study. These observations are consistent with a previous investigation in which phlebotomy technique and needle gauge had little or no effect on protein abundance (Penn et al. Citation2015).
Blood samples were collected into 6.0 mL EDTA vacutainer tubes and immediately placed into an ice bath until processed; samples were processed within 2 h of collection. EDTA tubes were inverted 8–10 times before being centrifuged for 10–15 min at 2500–3000 rpm. Plasma samples were then aliquoted into 500 μL cryo tubes and stored at −80 °C.
Diagnosis and motor/speech deficits
Study participants received full neurological assessments, as per standard of care at each enrolling site. Two study neurologists adjudicated the cases based on both neurological assessments and radiological findings (i.e. MRI and/or CTA), the combination of which has been argued to represent the “gold-standard” in stroke diagnosis (Whiteley et al. Citation2008, Citation2011). If there was disagreement then a third neurologist adjudicated the case. Adjudicated diagnoses were recorded at or after day 90 post-event: (a) Mimic (clinical presentation ultimately inconsistent with TIA and negative imaging results); (b) TIA Possible (clinical presentation consistent with TIA, but negative imaging results); and (c) TIA Definite (positive imaging results: diffusion weighted imaging (DWI) positive or abnormal CTA). For analysis purposes, a binary diagnosis was also derived by combining TIA possible and definite diagnoses (i.e. Mimic versus TIA).
A motor/speech (M/S) deficit variable (0 = absent, 1 = present) was also defined using information from the CRF based on the presence of any of the following clinical symptoms: (a) face droop, (b) unilateral limb weakness, (c) speech deficit and (d) language disturbance. The presence of M/S symptoms is recommended by several Canadian guidelines (Coutts et al. Citation2014, Casaubon et al. Citation2015) as a potential indicator of high-risk TIA. Thus, this variable was created in order to later stratify patients by diagnosis and M/S deficits during statistical analysis.
Final sample
A total of 560 participants were enrolled in the two arms of the first phase of the SpecTRA study. Of the initial sample, nine patients were removed due to protocol violations, such as missing the required brain imaging. In consideration of the medical and clinical ambiguity regarding transient global amnesia (TGA) (Sedlaczek et al. Citation2004) and its potential relation to TIA, an additional six patients were removed from the sample with this diagnosis. In total, 15 patients were excluded from the dataset () used to identify the biomarker panel. displays the demographic characteristics of the final evaluable SpecTRA dataset (n = 545).
Table 1. Demographics.
Proteomic analysis
Collected plasma samples were analysed using multiple reaction monitoring-mass spectrometry (MRM-MS), utilising stable-isotope-labelled internal standard (SIS) peptides. The use of SIS peptides in MRM analyses is considered the “gold standard” in MS quantitation (Ong and Mann Citation2005, Parker and Borchers Citation2014).
The samples were analysed at the Genome British Columbia Proteomics Centre, University of Victoria, BC, Canada. Before MRM-MS analysis was conducted, samples were randomly distributed across the analytic 96-well plates to control for potential batch effects. The randomisation stratified for participant diagnosis, enrolment study site and sex. The Proteomic Centre was blinded to the participants’ final diagnoses at the time of plasma analysis.
Candidate proteins
The initial list of candidate proteins was selected based on a literature review of proteins previously investigated as biomarkers for TIA/minor stroke in acute settings (Supplementary Table S1) or related neurological phenomena (e.g. migraine). Ultimately, the team selected 141 candidate proteins, each represented by a single peptide sequence for MRM analysis, with the exception of matrix metalloproteinase-9 (MMP-9) and thrombospondin-1 (TSP-1), which were measured using three distinct peptide sequences each. Thus, our initial list comprised 141 candidate proteins measured using 145 peptide sequences.
Ethics statement
This study was approved by the local ethics boards of both participating sites. Written informed consent was obtained from all study participants. The SpecTRA study is registered with ClinicalTrials.gov (NCT03050099).
Statistical analysis
Our statistical analysis included the follow steps: (1) data quality control review; (2) time-effect analysis; (3) single-peptide analyses for differential relative abundance; and, (4) identification of a potential proteomic biomarker panel.
Proteomic data imputation and transformation
Our analyses utilised the log2-transformed relative abundance values (i.e. the ratio of the abundance of the natural (NAT) peptide abundance to the abundance of the spiked in stable-isotope-labelled standard (SIS) peptide). This is a unitless, relative measure of peptide abundance in which much of the technical variability of the MRM-MS process has been removed.
To permit the use of the logarithmic transformation, the relative abundance values (ratio of NAT to SIS abundance) reported as zero (i.e. where the abundance of the NAT peptide was observed to be below the limit of quantitation) were imputed using one-half of the minimum observed relative abundance above the lower limit of detection for each peptide. The relative abundance values were then log2-transformed for all statistical analyses.
Quality control
All proteomic data were examined with regards to quality control (QC). QC involved several non-specific filters (i.e. all phases were blinded with respect to participant final diagnosis). Peptides with uniformly low relative abundances (i.e. peptides in which more than 75% of samples had observed relative abundance values below the peptide-specific limits of quantitation) were removed from the list of candidate proteins. We also removed peptides whose distribution of relative abundance values suggested poor resolution: these were peptides where 80% or more of the samples were concentrated in the 10 smallest numerical values reported for that peptide.
As a final QC, a visual blinded-to-diagnosis review of individual spectra for reliable integration was conducted. Peptide values were flagged as being either valid (i.e. integration of the area under the curve was judged to be reliable) or suspect. We then removed peptides where less than 20% of the samples were judged to be valid. Also, the proportion of suspect values for each peptide was retained for use in later statistical analyses as a measure of quality.
Time effect on proteomic expression
Our first statistical analyses examined whether there were important interactions between blood draw time (relative to symptom onset) and diagnosis on the observed peptide level trajectories over time. This analysis included participants who had both single and multiple blood draws through the use of mixed-effects regression models for each peptide. Our full model for the log2-transformed relative abundance levels included terms for time, time2, diagnostic group, MRM-MS plate ID and group-by-time and group-by-time2 interactions. In this full model, time referred to the time between symptom onset and blood draw, and the group variable had three values (Mimic, TIA Possible, TIA Definite). The time2 term permitted assessment of the importance of curvature in the trajectory of peptide levels over time. This model was then sequentially simplified, removing first the group-by-time2 term, then the group-by-time term, and finally the time2 term. At each step, the significance of the terms removed was assessed using likelihood ratio tests and those terms with a false discovery rate (FDR) (Benjamini and Hochberg Citation1995) of 0.2 or less were retained.
As a result of these time-effect analyses (see Results – Time Effect on Proteomic Expression), our subsequent analyses used only the first sample drawn from all participants and the models included only the linear term for time.
Correcting for batch and time effects
In anticipation of possible batch (e.g. variation confounded with the MRM-MS experimental plate) and time effects, the peptide level data were corrected for possible batch and time effects using a linear model. We used the residuals from these models as our final “time-and-batch-corrected” relative abundance values, effectively removing the effect of time and MRM-MS plate ID from the peptide data. For each peptide, we performed our analyses of differential relative abundance using these final corrected peptide values.
Single protein differential relative abundance analyses
To examine differential relative abundance, we used robust generalised linear models (Maechler et al. Citation2016) in a logistic regression model for the binary diagnosis variable (Mimic versus TIA) against the final peptide values for each individual candidate peptide as the single predictor. Odds ratios with 95% confidence intervals were calculated for each peptide and p-values for the peptides were adjusted using an FDR with α = 0.2. We used the robust logistic regression analysis to reduce the impact of aberrant individual peptide levels on the resulting p-values.
Biomarker panel construction
After the single peptide analyses, we constructed a proteomic biomarker panel using Lasso logistic regression (Friedman et al. Citation2010) in conjunction with bootstrapping to measure variable importance (Efron and Gong Citation1983); the procedure is comparable to that proposed by Wang et al. (Citation2011). To create the panel, we measured variable importance by performing bootstrap sampling analysis of the Lasso regression model. That is, we created 300 bootstrap samples using data from the first-drawn samples from all 545 participants. These bootstrap samples were selected with replacement after stratifying by diagnostic group (Mimic, TIA Possible, TIA Definite) and the presence of M/S deficits. This stratification strategy was used as it is likely that peptide expression values could be directly related to lesion volume and location (Fassbender et al. Citation1997, Wunderlich et al. Citation2004), which in turn would be related to TIA severity and the certainty of diagnosis (TIA Possible versus TIA Definite). Stratifying by diagnostic level, therefore, ensured each bootstrap sample remained representative of the distribution of lesion volumes in the overall sample. Similarly, stratification by M/S deficits ensured that the distribution of low- and high-risk TIA cases also remained representative.
Next, for each of the 300 bootstrap samples, we fitted a logistic Lasso regression model (Friedman et al. Citation2010) that included all remaining candidate peptides. We then extracted the first 15 peptides selected by the Lasso model in each case. We chose to limit the models to 15 predictors to reduce the chance of overt over-fitting and to follow the “10-cases-per-predictor” heuristic (Vittinghoff and McCulloch Citation2007), at least approximately. We fit the Lasso model using the proportion of QC-valid values as the weights for the regression penalty for each peptide, thereby preferentially selecting peptides that were “more reliably measured”. Finally, using the 300 resulting fitted models, we measured the variable importance for each peptide as the proportion of fitted models for which the peptide was selected. Although, each of the 300 models contains only 15 peptides, the individual peptides selected can vary between models. As a result, when the frequency of peptide selection is tallied across the 300 models, it is possible for more or less than 15 peptides to have a frequency of selection equal to or greater than one-third of the number of fitted models. The final panel size, therefore, is ultimately determined by the proportion of models selecting the peptides, and is not a property of any individual model.
Analyses were completed using the ROCR (v1.0.7) (Sing et al. Citation2005), pROC (v1.10.0) (Robin et al. Citation2011), glmnet (v2.0.13) (Friedman et al. Citation2010), robustbase (v0.92.7) (Maechler et al. Citation2016), nmle (v3.1.131) (Pinheiro et al. Citation2016), Hmisc (v4.0.3) (Harrell and Dupont Citation2016), rms (v5.1.1) (Harrell Citation2016) and ggplot2 (v2.2.1) (Wickham Citation2009) libraries in the R statistical language (v3.4.3) (R Core Team Citation2016).
Results
Quality control – phase 1
In the first phase of QC, two peptides (one of the MMP-9 sequences and the proteotypic peptide for creatine kinase B-type) were removed from the candidate list for having ≥75% of values below the limit of quantitation; 36 more peptides were removed from the candidate list for poor resolution (having ≥80% of the observations occurring in the lowest 10 values of the peptide measurements). A total of 107 of the initial 145 candidate peptides remained after these QC steps.
Time effect on proteomic expression
Examination of the FDR-adjusted p-values for the likelihood tests of the group-by-time2 interaction term did not indicate any significant effect of the interaction on peptide expression (α = 0.2). For the group-by-time interaction analysis, three peptides were found to have significant interactions: (a) Apolipoprotein A-IV, (b) B-cell scaffold protein with ankyrin repeats, and (c) Collagen alpha-1(I) chain. The time2 interaction terms were found to be non-significant. However, though group-by-time and the time2 effects did not appear significant, we did observe a significant main effect of time for 26 proteins, confirming the desirability of adjusting protein levels for time in subsequent analyses (results not shown).
To further investigate the role of time on peptide expression, we conducted a post-hoc sub-analysis repeating the time effect analysis previously outlined on patient blood draws <6 h from symptom onset. The motivation for this analysis was to determine if any time-by-protein effects would be observed within the critical time window during which tissue plasminogen activator (tPA) therapy must be administered to be effective. After FDR correction, no effect of time on peptide expression or main effects of time were observed (results not shown).
Adjustment for time and plate effects
Because only three peptides out of the 107 candidate peptides that passed the first phase of QC demonstrated a significant interaction effect between time and diagnostic group, we decided that it was not necessary to include this interaction term in the linear model which corrected for batch effects.
Before continuing with further analyses the data set was restricted to only the participants’ first blood draw to render measurements for each peptide independent (i.e. removing blood draws 2 and 3 for patients with multiple blood draws). Because restriction of the data reduced the number of data points available per peptide, we repeated the first phase steps of QC on the peptide values for the first blood draw (n = 545 participants). A total of 105 peptides passed the repeated first phase QC for the first blood draw.
Quality control – phase 2
After a manual review of the mass spectra for the 105 peptides passing the first phase of QC for the first blood draw (i.e. 545 participants ×105 peptides =57,225 individual peptide data), a total of 59 peptides (corresponding to 59 distinct proteins) were judged to be appropriate for further statistical analyses; 46 peptides were removed from the candidate list for having less than 20% valid proteomic values. Figure S1 in the supplement displays box plots for these 59 peptides.
Single-protein differential relative abundance analyses
Robust single-predictor logistic regression models for diagnosis of mimic versus TIA were fit to each of the 59 peptides passing QC. Fifteen peptides were found to be differentially abundant between the mimic and TIA patients after FDR adjustment (α = 0.2). Supplementary Table S2 shows the results of the model fits (n = 59 peptides), along with FDR adjusted p-values.
Construction of the proteomic panel
Prior to conducting the bootstrapping feature-selection procedure, we made the analytic decision to alter the penalty factor utilised by the Lasso model. Specifically, we fixed the Lasso penalty for insulin-like growth factor-binding protein 3 (IGFBP-3) so that IGFBP-3 would always be included in each bootstrap model. We based this decision upon the systematic review of the stroke protein biomarker literature by Whiteley et al. (Citation2009) who found that insulin-like growth factor consistently emerges as a significant stroke biomarker in multiple studies. In addition, we incorporated the QC proportion of unreliable integration as a penalty factor in the Lasso model.
shows the final proteomic panel (n = 16 peptides) with frequency of selection by the bootstrapping procedure. A logistic regression model predicting the binary diagnosis of mimic versus TIA was fit to the data using the final proteomic panel. The standardised coefficients of the model, along with p-values, are reported in as descriptive indicators of the significance of each peptide in the panel for differentiating mimic from TIA, adjusted for the presence of the other panel peptides. A positive coefficient value implies that the estimated probability of TIA is higher for patients with higher relative abundance of the corresponding peptide, when all other peptides are held fixed, and vice versa for a negative coefficient value. With the exception of IGFBP-3, the signs of the coefficients (i.e. positive or negative) for the peptides in the panel are consistent with the odds ratios reported in Supplementary Table S2 for the robust single-predictor logistic regression analysis.
Table 2. Peptides selected by bootstrap Lasso procedure with frequency of peptide selection across bootstrap samples (n = 300).
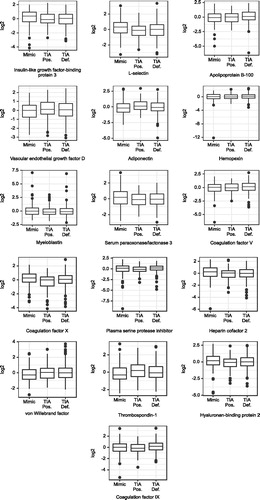
shows box plots for the selected peptides. The final biomarker panel included 9 of the 15 peptides that were found to have a significant single-predictor relation (FDR <0.2) to the binary diagnosis outcome (TIA versus Mimic): (a) L-selectin (LSEL), (b) IGFBP-3, (c) Coagulation factor X (FX), (d) Serum paraoxonase/lactonase 3 (PON3), (e) Thrombospondin-1 (TSP-1), (f) Hyaluronan-binding protein 2 (HABP2), (g) Heparin cofactor 2 (HCII), (h) Apolipoprotein B-100 (Apo B-100) and (i) von Willebrand factor (vWF).
Figure 2. Box plots of proteins in the biomarker panel. TIA Pos.: TIA Possible; TIA Def.: TIA Definite; log2: log2 of relative abundance (ratio of abundance of NAT/SIS).
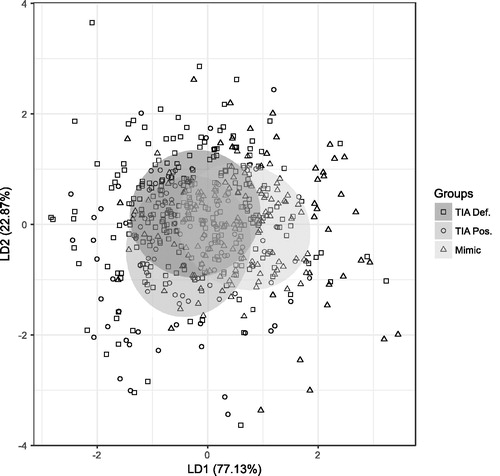
shows a linear discriminant analysis plot of the final panel.
Figure 3. Linear discriminant analysis plot of proteins in the biomarker panel, with 50% confidence ellipses. TIA Pos.: TIA Possible; TIA Def.: TIA definite.
Discussion
The final panel selected consisted of 16 proteins of which 9 were also significant univariate predictors of TIA (FDR <0.2). To better contextualise the scientific relevance of the proteins in our panel, we briefly discuss some of the significant proteins in the panel in light of previous studies.
In our study, higher plasma levels of L-selectin (LSEL) were observed to be predictive of mimic conditions. Previous studies have observed that LSEL is a potential cardiac disease marker, with higher levels being predictive of cardiovascular disease (Savoia and Schiffrin Citation2007). Haught et al. (Citation1996), however, found patients with coronary artery disease to have lower levels of LSEL than controls. Haught et al. (Citation1996) demonstrated, in vitro, that stimulation of leukocytes resulted in a rapid down-regulation of surface LSEL to levels comparable to that of leukocytes from cardiovascular patients. Haught et al. (Citation1996) posit that leukocyte stimulation caused by the atherosclerotic inflammatory process may account for the lower levels of LSEL observed in cardiovascular patients. The findings of our study would be consistent with this hypothesis, given the vascular aetiologies of TIA.
Hyaluronan-binding protein 2 (HABP2) is known for its role in coagulation and activation of coagulation factor VII (FVII) and pro-urokinase (pro-uPA) (Bustamante et al. Citation2016). Due to its role in coagulation, HABP2 has been implicated in a number of atherosclerotic diseases. A polymorphism of the HABP2 gene, known as Marburg I, is present in 5% of the Caucasian population (McVey Citation2012) and has been associated with increased risk of ischaemic stroke (Trompet et al. Citation2011), carotid stenosis (Willeit et al. Citation2003), atherosclerosis (Ireland et al. Citation2004) and venous thromboembolism (Hoppe et al. Citation2005). Parahuleva et al. (Citation2008), have also found increased levels of HABP2 in unstable atherosclerotic plaque. In a study investigating the relation between HABP2 levels and the effectiveness of tPA on post-stroke recanalization, Bustamante et al. (Citation2016) found that lower plasma levels of HABP2 were associated with greater recanalization. Hanson et al. (Citation2012) found higher plasma levels of HABP2 to be associated with ischaemic stroke compared to controls; elevated HABP2 levels were observed both in the acute phase and 3 months post-stroke. In our study, higher plasma levels of HABP2 were significantly associated with lower TIA risk. This finding is contrary to previously reported results which would instead suggest an increase in TIA risk with increasing plasma levels. Although we cannot account for this discrepancy, HABP2 was still a significant univariate predictor in our study, suggesting a physiological relation between HABP2 and TIA status.
In our panel, increased levels of vascular endothelial growth factor D (VEGF-D) were predictive of TIA/minor stroke. Previous studies have found expression of VEGF to be up-regulated following ischaemic events (Lennmyr et al. Citation1998, Faller Citation1999, Plate et al. Citation1999, Conway et al. Citation2003), often within 1–3 h and reaching peak levels 24–48 h after the event (Croll and Wiegand Citation2001), with up-regulation localised primarily at the site of ischaemia (Zhang and Chopp Citation2002).
We found increased levels of adiponectin (ADPN) to be predictive of TIA/minor stroke. Increased levels of ADPN have been associated with atherosclerotic damage (Hernández-Romero et al. Citation2012), persistent atrial fibrillation (Shimano et al. Citation2008), increased risk of atrial fibrillation in elderly patients (Macheret et al. Citation2015) and increased stroke risk (Prugger et al. Citation2012). Atrial fibrillation is a recognised risk factor for ischaemic stroke (Wolf et al. Citation1991). Although other studies have found decreased levels of ADPN post-ischaemic event (Efstathiou et al. Citation2005, Marousi et al. Citation2010, Pera et al. Citation2013), our study focussed on patients whose ischaemic events occurred within 24 h of blood collection (median: 6.75 h; IQR =3.42–16.97). For this reason, we speculate that the role of ADPN in our panel is as a marker of vascular damage prior to the ischaemic event, rather than as a prognostic marker of longer term outcome, and that it may be related to an anti-inflammatory effect (Efstathiou et al. Citation2005, Marousi et al. Citation2010). The significant finding of ADPN in our study is in agreement with previous studies of stroke protein biomarkers which have also reported a consistent relationship between adiponectin and ischaemic stroke (Whiteley et al. Citation2009).
In our panel, higher plasma levels of serum paraoxonase/lactonase 3 (PON3) were significantly associated with a reduced risk of TIA. PON3 is one of the three paraoxonase proteins, and has been found to have antioxidant effects and to be involved in the inflammatory process (Bourquard et al. Citation2008). In humans, the main site of PON3 production is the liver (Bourquard et al. Citation2008), with PON3 associated with circulating high-density lipoprotein (HDL) (Ng et al. Citation2005). PON3 has been observed to both prevent the oxidation of low-density lipoprotein (LDL) and to inactivate already oxidised LDL (Reddy et al. Citation2001). Marsillach et al. (Citation2015) have also found patients with sub-clinical atherosclerosis to have lower levels of PON3 associated with HDL. In transgenic mice (i.e. mice with the human PON3 gene), Shih et al. (Citation2007) observed reduced development of atherosclerotic lesions and obesity in male transgenic mice compared to control mice. Given these findings, several researchers have hypothesised that PON3 serves an important role in the prevention of atherosclerotic disease (Shih et al. Citation2007, Bourquard et al. Citation2008, Marsillach et al. Citation2015). The results of our study further support the association of decreased PON3 levels with atherosclerotic disease, via the aetiological role of atherosclerosis in the development of TIA.
Coagulation factor X (FX) is a known marker of cardiac disease (Redondo et al. Citation1999). In our study, increased levels of FX were found to be predictive of TIA/minor stroke. FX has been found to be significantly higher in acute-phase ischaemic stroke patients compared to stroke patients 1–4 years post-event (Gissel et al. Citation2010), as well as in stroke patients 2 months post-event compared to healthy controls (Biasiutti et al. Citation2003).
Heparin cofactor II (HCII) functions to inactive thrombin and is therefore involved in the modulation of blood coagulation. HCII is responsible for approximately 20–30% of thrombin inactivation during coagulation (Rau et al. Citation2007, Bhakuni et al. Citation2016). HCII is unique in that, in the extravascular lumen, it inhibits only thrombin and no other proteins involved in the coagulation process (Parker and Tollefsen Citation1985). Plasma concentrations of HCII have been found to decrease with age (Aihara et al. Citation2004), with higher levels associated with reduced risk of peripheral arterial disease in the elderly (Aihara et al. Citation2009). Higher levels of HCII may also be preventative of ischaemic stroke (Toulon et al. Citation2008). Aihara et al. (Citation2004) found that after controlling for patient age, sex and diabetes status, higher HCII levels were more negatively correlated with carotid atherosclerosis than with HDL in elderly patients. The finding in our study that higher HCII levels were predictive of mimic conditions is in keeping with the results of these previous studies.
Plasma serine protease inhibitor, also known as protein C inhibitor (PCI), is primarily created in the liver and participates in haemostasis and fibrinolysis to modulate coagulation (Rau et al. Citation2007). PCI may function as either an anticoagulant in the presence of heparin, or as a procoagulant in the presence of thrombomodulin (Pike et al. Citation2005). PCI is a known inhibitor of the anticoagulant protease, activated protein C (APC) (Pike et al. Citation2005). Previous studies have linked the complex of APC and PCI (i.e. APC-PCI), to atherosclerosis (Kölbel et al. Citation2006). Elevated plasma levels of PCI have been associated with myocardial infarction, acute coronary events and risk of reinfarction (Carroll et al. Citation1997), as well the development of thrombosis (Meijers et al. Citation2002). PCI has also been found to inhibit fibrinolysis by inhibiting urokinase-type plasminogen activator (uPA) and tPA (Suzuki Citation2008). The finding in our study that higher PCI levels were predictive of TIA conditions is in keeping with the results of these previous studies.
In our study, we found vWF to be a significant univariate predictor of TIA/minor stroke, with higher levels of vWF being associated with diagnoses of TIA/minor stroke. Moreover, vWF was also selected by the Lasso procedure as a predictor in our biomarker panel. vWF is physiologically involved in hemostatis and platelet adhesion (Luo et al. Citation2012), and in the context of TIA/minor stroke, has been viewed as a marker of endothelial dysfunction (Lip and Blann Citation1997, Wieberdink et al. Citation2010). Previous studies have demonstrated a relationship between higher levels of vWF and transient ischaemic attack and stroke (Qizilbash et al. Citation1997, Bongers et al. Citation2006, Lip et al. Citation2006, Menih et al. Citation2017). In a prospective study, Wieberdink et al. (Citation2010) found elevated plasma levels of vWF to be a prognostic biomarker of stroke risk in patients >55 years of age who were stroke-free at baseline assessments. High plasma levels of vWF have also been associated with heart disease, and myocardial infarction (Lip et al. Citation2006, Kraft et al. Citation2014). Lip and Blann (Citation1997) found elevated levels of vWF to be associated with atrial fibrillation, with vWF levels unaffected by use of anticoagulation medication. In contrast to prior studies, Bustamante et al. (Citation2017) did not observe vWF to be a significant predictor of stroke in a large validation cohort of 767 patients. Our study, like that of Bustamante et al., also employed a relatively larger sample size (n = 545) than that commonly observed in prior studies (n < 200). The results of our study, nevertheless, are consistent with those of previous studies. Our finding that higher levels of vWF are associated with TIA/minor stroke contributes to the scientific understanding of the relation between vWF and TIA/minor stroke, although further replication appears to be required to clarify the relation.
In our study, we found IGFBP-3 to be a significant univariate predictor of TIA/minor stroke, with higher levels of IGFBP-3 predictive of mimic conditions. Previous studies have found lower levels of IGFBP-3 to be associated with cardiovascular disease (Kaplan et al. Citation2007), and ischaemic stroke (Schwab et al. Citation1997, Johnsen et al. Citation2005). Our results are consistent with those reported by previous studies. In contrast, Bustamante et al. (Citation2017) did not observe a significant relation between IGFBP-3 levels and diagnosis of stroke. However, Bustamante et al reported that measurements of IGFBP-3 evidenced an inter-assay coefficient of variation >20% between their interim and validation datasets. This variability in measurement may account for the differences in findings between their study and prior studies.
Conclusion
Our aim in the current study was to investigate a large number (n = 141) of candidate plasma protein biomarkers for evidence of differential relative abundance between mimic and TIA patients seen in an ED setting, and to construct a biomarker classifier panel using a smaller number of these proteins. We examined the role of time from symptom onset to blood draw on plasma protein levels in relation to diagnosis of TIA. Our study did not find any substantial relationship between the timing of blood draw and the ability of protein levels to differentiate mimic from TIA conditions. Of the 59 peptides passing QC, we then constructed a biomarker panel of 16 proteins which showed differential abundance between mimic and TIA patients. We will validate this proposed biomarker panel in the second phase of the SpecTRA study (n = 600).
Our biomarker panel contains a large number of cardiac protein biomarkers which are consistent with previous biomarker studies (Whiteley et al. Citation2009). As Whiteley (Citation2011) has suggested, the heterogeneity of stroke aetiologies likely precludes the possibility of finding an individual protein biomarker that is consistently associated with all stroke sub-types. Extrapolating upon this idea, cardiac and vascular risk factors for stroke are likely associated with multiple stroke aetiologies, which would account for their consistent inclusion in biomarker panels across multiple studies, including our own. Although we excluded patients with haemorrhagic stroke in our study, it is very likely that our biomarker panel may also be relevant to this patient population, as both ischaemic and haemorrhagic share common cardiovascular risk factors. Future research would be needed to confirm this supposition.
A limitation of our study is that 82 of our initial candidate proteins were difficult to measure reliably because – even with the added sensitivity of MRM – their proteotypic peptides were below the limit of detection for one-dimensional LC/MRM-MS. These candidate proteins may, however, still be potential biomarkers of TIA if measured using a different, more sensitive quantitation technique which included enrichment of the target peptides or proteins (e.g. enzyme-linked immunosorbent assay). Both SISCAPA (stable isotope standards and capture by anti-peptide antibodies) (Anderson et al. Citation2004) and immuno-tandem mass spectrometry (iMALDI) (Jiang et al. Citation2007, Popp et al. Citation2017), for example, utilise enrichment of the target peptides by anti-peptide antibodies. Both methods avoid the problem of antibody cross-reactivity because they utilise mass spectrometric detection of the target peptides and thus provide a higher level of analyte specificity. However, because of the high cost of antibody production, methods involving enrichment may be better suited for validation of a smaller number of biomarkers, rather than projects involving biomarker discovery (Whiteaker et al. Citation2007, Paulovich et al. Citation2008, Makawita and Diamandis Citation2009, Borchers and Parker Citation2010, Rodriguez et al. Citation2010, Addona et al. Citation2011).
The fact that the targeted peptide was based on an assay for biomarker detection in non-depleted and non-enriched plasma on a 1D-LC/MRM-MS platform may also account for the large number of cardiac protein biomarkers within our panel. It is likely that proteins related to the ischaemic cascade would be of low abundance in plasma, as their site of production and up-regulation would be localised to the affected brain region. Further, the abundance of such ischaemic proteins in peripheral circulation would be a direct function of the extent of blood-brain barrier damage. For this reason, such proteins may be difficult to accurately measure in plasma without quantitation techniques utilising enrichment. In contrast, cardiac protein biomarkers could be expected to be encountered in greater abundance in blood plasma as (a) the site of their production potentially involves the entire circulatory system (e.g. systemic atherosclerotic inflammatory processes), and (b) such biomarkers are endogenous to the circulatory system (i.e. no intervening blood-brain barrier).
In conclusion, our study has identified a panel of 16 plasma protein biomarkers with which to differentiate mimic from TIA patients in ED settings. A strength of our study is that our sample consisted of presenting patients enrolled directly in the ED, and therefore represents the target population in which a blood test for TIA would be clinically used. Several of the proteins in our panel are known to have scientifically plausible associations with TIA. Our study adds to the literature on TIA plasma protein biomarkers by corroborating and replicating the findings of other studies. Specifically, our study confirms the findings that adiponectin, heparin cofactor II, and von Willebrand factor are reliable predictors of TIA and stroke. Future work will validate the diagnostic performance of our panel in an independent cohort of ED patients.
Supplemental Material
Download PDF (721.6 KB)Disclosure statement
C. H. B. is the CEO of MRM Proteomics, Inc. The other authors report no conflict of interest.
Additional information
Funding
Related Research Data
References
- Addona, T.A., et al., 2011. A pipeline that integrates the discovery and verification of plasma protein biomarkers reveals candidate markers for cardiovascular disease. Nature biotechnology, 29 (7), 635–643.
- Aihara, K., et al., 2009. Heparin cofactor II is an independent protective factor against peripheral arterial disease in elderly subjects with cardiovascular risk factors. Journal of atherosclerosis and thrombosis, 16 (2), 127–134.
- Aihara, K., et al., 2004. Heparin cofactor II is a novel protective factor against carotid atherosclerosis in elderly individuals. Circulation, 109 (22), 2761–2765.
- Albers, G.W., et al., 2002. Transient ischemic attack-proposal for a new definition. The New England journal of medicine, 347 (21), 1713–1716.
- Anderson, N.L., et al., 2004. Mass spectrometric quantitation of peptides and proteins using stable isotope standards and capture by anti-peptide antibodies (SISCAPA). Journal of proteome research, 3 (2), 235–244.
- Benjamini, Y. and Hochberg, Y., 1995. Controlling the false discovery rate: a practical and powerful approach to multiple testing. Journal of the Royal Statistical Society. Series B, statistical methodology, 57 (1), 289–300.
- Bhakuni, T., et al., 2016. Role of heparin and non heparin binding serpins in coagulation and angiogenesis: a complex interplay. Archives of biochemistry and biophysics, 604, 128–142.
- Biasiutti, F.D., et al., 2003. Hemostatic risk factors in ischemic stroke. Thrombosis and haemostasis, 90 (6), 1094–1099.
- Birenbaum, D., Bancroft, L.W., and Felsberg, G.J., 2011. Imaging in acute stroke. The Western journal of emergency medicine, 12 (1), 67–76.
- Bongers, T.N., et al., 2006. High von Willebrand factor levels increase the risk of first ischemic stroke: influence of ADAMTS13, inflammation, and genetic variability. Stroke. 37 (11), 2672–2677.
- Borchers, C.H. and Parker, C.E., 2010. Improving the biomarker pipeline. Clinical chemistry, 56 (12), 1786–1788.
- Bourquard, N., et al., 2008. The role of PON2 and PON3 in atherosclerosis and related traits. In: B. Mackness, et al., eds. The paraoxonases: their role in disease development and xenobiotic metabolism. Dordrecht, NLD: Springer Netherlands, 103–128.
- Brott, T., et al., 1989. Measurements of acute cerebral infarction: a clinical examination scale. Stroke, 20 (7), 864–870.
- Brouns, R. and Deyn, P.D., 2009. The complexity of neurobiological processes in acute ischemic stroke. Clinical neurology and neurosurgery, 111 (6), 483–495.
- Bustamante, A., et al., 2016. Factor seven activating protease (FSAP) predicts response to intravenous thrombolysis in acute ischemic stroke. International journal of stroke, 11 (6), 646–655.
- Bustamante, A., et al., 2017. Blood biomarkers for the early diagnosis of stroke: the stroke-chip study. Stroke, 48 (9), 2419–2425.
- Carroll, V.A., et al., 1997. Plasma protein C inhibitor is elevated in survivors of myocardial infarction. Arteriosclerosis, thrombosis, and vascular biology, 17 (1), 114–118.
- Casaubon, L.K., et al., 2015. Canadian stroke best practice recommendations: hyperacute stroke care guidelines, update 2015. International journal of stroke, 10 (6), 924–940.
- Conway, E.M., et al., 2003. Survivin-dependent angiogenesis in ischemic brain. American journal of pathology, 163 (3), 935–946.
- Coutts, S.B., et al., 2014. Canadian stroke best practice recommendations: secondary prevention of stroke guidelines, update 2014. International journal of stroke, 10 (3), 282–291.
- Crisostomo, R.A., Garcia, M.M., and Tong, D.C., 2003. Detection of diffusion-weighted MRI abnormalities in patients with transient ischemic attack: correlation with clinical characteristics. Stroke, 34 (4), 932–937.
- Croll, S.D. and Wiegand, S.J., 2001. Vascular growth factors in cerebral ischemia. Molecular neurobiology, 23 (2–3), 121–136.
- Easton, J.D., et al., 2009. Definition and evaluation of transient ischemic attack: a scientific statement for healthcare professionals. Stroke, 40 (6), 2276–2293.
- Efron, B. and Gong, G., 1983. A leisurely look at the bootstrap, the jackknife, and cross-validation. The American statistician, 37 (1), 36–48.
- Efstathiou, S.P., et al., 2005. Plasma adiponectin levels and five-year survival after first-ever ischemic stroke. Stroke, 36 (9), 1915–1919.
- Faller, D.V., 1999. Endothelial cell responses to hypoxic stress. Clinical and experimental pharmacology and physiology, 26 (1), 74–84.
- Fassbender, K., et al., 1997. Leakage of brain-originated proteins in peripheral blood: temporal profile and diagnostic value in early ischemic stroke. Journal of neurological sciences, 148 (1), 101–105.
- Ferro, J., et al., 1996. Diagnosis of transient ischemic attack by the nonneurologist: a validation study. Stroke, 27 (12), 2225–2229.
- Ferro, J.M., et al., 1991. Investigation into the causes of delayed diagnosis of subarachnoid hemorrhage. Cerebrovascular diseases, 1 (3), 160–164.
- Fonseca, A.C. and Canhão, P., 2010. Diagnostic difficulties in the classification of transient neurological attacks. European journal of neurology, 18 (4), 644–648.
- Friedman, J.H., Hastie, T., and Tibshirani, R., 2010. Regularization paths for generalized linear models via coordinate descent. Journal of statistical software, 33 (1), 1–22.
- Gissel, M., et al., 2010. Plasma factor and inhibitor composition contributes to thrombin generation dynamics in patients with acute or previous cerebrovascular events. Thrombosis research, 126 (4), 262–269.
- Hanson, E., et al., 2012. Plasma factor VII-activating protease antigen levels and activity are increased in ischemic stroke. Journal of thrombosis and haemostasis, 10 (5), 848–856.
- Harrell, F.E. Jr. 2016. rms: regression modeling strategies. Available from: https://CRAN.R-project.org/package=rms.
- Harrell, F.E. Jr. and Dupont, C., 2016. Hmisc: Harrell miscellaneous. Available from: https://CRAN.R-project.org/package=Hmisc.
- Hasan, N., et al., 2012. Towards the identification of blood biomarkers for acute stroke in humans: a comprehensive systematic review. British journal of clinical pharmacology, 74 (2), 230–240.
- Haught, W.H., et al., 1996. Alterations in circulating intercellular adhesion molecule-1 and L-selectin: further evidence for chronic inflammation in ischemic heart disease. American heart journal, 132 (1), 1–8.
- Hernández-Romero, D., et al., 2012. The prognostic role of the adiponectin levels in atrial fibrillation. European journal of clinical investigation, 43 (2), 168–173.
- Hoppe, B., et al., 2005. Marburg I polymorphism of factor VII–activating protease is associated with idiopathic venous thromboembolism. Blood, 105 (4), 1549–1551.
- Huisman, T.A.G.M., 2005. Intracranial hemorrhage: ultrasound, CT and MRI findings. European radiology, 15 (3), 434–440.
- Institute of Medicine. 2010. Evaluation of biomarkers and surrogate endpoints in chronic disease. Washington, DC: The National Academies Press.
- Ireland, H., et al., 2004. The factor VII activating protease G511E (Marburg) variant and cardiovascular risk. Thrombosis and haemostasis, 92 (5), 986–992.
- Jiang, J., et al., 2007. Development of an immuno tandem mass spectrometry (iMALDI) assay for EGFR diagnosis. Proteomics – clinical applications, 1 (12), 1651–1659.
- Johnsen, S.P., et al., 2005. Insulin-like growth factor (IGF) I, -II, and IGF binding protein-3 and risk of ischemic stroke. The journal of clinical endocrinology & metabolism, 90 (11), 5937–5941.
- Johnston, S.C., et al., 2007. Validation and refinement of scores to predict very early stroke after transient ischaemic attack. The Lancet, 369 (9558), 283–292.
- Kaplan, R.C., et al., 2007. Association of total insulin-like growth factor-I, insulin-like growth factor binding protein-1 (IGFBP-1), and IGFBP-3 levels with incident coronary events and ischemic stroke. The journal of clinical endocrinology & metabolism, 92 (4), 1319–1325.
- Kidwell, C.S., et al., 1999. Diffusion MRI in patients with transient ischemic attacks. Stroke, 30 (6), 1174–1180.
- Kölbel, T., et al., 2006. Activated protein C-protein C inhibitor complex: a new biological marker for aortic aneurysms. Journal of vascular surgery, 43 (5), 935–939.
- Kraft, P., et al., 2014. Von Willebrand factor regulation in patients with acute and chronic cerebrovascular disease: a pilot, case-control study. PLoS One, 9 (6), e99851.
- Laskowitz, D.T., et al., 2009. Clinical usefulness of a biomarker-based diagnostic test for acute stroke: the biomarker rapid assessment in ischemic injury (BRAIN) study. Stroke, 40, 77–85.
- Lennmyr, F., et al., 1998. Expression of vascular endothelial growth factor (VEGF) and its receptors (Flt-1 and Flk-1) following permanent and transient occlusion of the middle cerebral artery in the rat. Journal of neuropathology and experimental neurology, 57 (9), 874–882.
- Linn, F., et al., 1994. Prospective study of sentinel headache in aneurysmal subarachnoid haemorrhage. The Lancet, 344 (8922), 590–593.
- Lip, G. and Blann, A., 1997. Von Willebrand factor: a marker of endothelial dysfunction in vascular disorders? Cardiovascular research, 34 (2), 255–265.
- Lip, G.Y., et al., 2006. Additive role of plasma von Willebrand factor levels to clinical factors for risk stratification of patients with atrial fibrillation. Stroke, 37 (9), 2294–2300.
- Luo, G.P., et al., 2012. Von Willebrand factor: more than a regulator of hemostasis and thrombosis. Acta haematologica, 128 (3), 158–169.
- Macheret, F., et al., 2015. Higher circulating adiponectin levels are associated with increased risk of atrial fibrillation in older adults. Heart, 101 (17), 1368–1374.
- Maechler, M., et al., 2016. robustbase: basic robust statistics. Available from: http://CRAN.R-project.org/package=robustbase.
- Makawita, S. and Diamandis, E.P., 2009. The bottleneck in the cancer biomarker pipeline and protein quantification through mass spectrometry-based approaches: current strategies for candidate verification. Clinical chemistry, 56 (2), 212–222.
- Marchi, N., et al., 2004. Peripheral markers of blood–brain barrier damage. Clinica Chimica Acta, 342 (1–2), 1–12.
- Marousi, S., et al., 2010. Serum adiponectin acutely after an ischemic stroke: implications for a long-lasting, suppressed anti-inflammatory role. Acta neurologica scandinavica, 121 (4), 277–284.
- Marsillach, J., et al., 2015. Paraoxonase-3 is depleted from the high-density lipoproteins of autoimmune disease patients with subclinical atherosclerosis. Journal of proteome research, 14 (5), 2046–2054.
- McVey, J.H., 2012. Factor seven-activating protease: does it do what it says on the tin? Journal of thrombosis and haemostasis, 10 (5), 857–858.
- Meijers, J.C.M., et al., 2002. Protein C inhibitor (plasminogen activator inhibitor-3) and the risk of venous thrombosis. British journal of haematology, 118 (2), 604–609.
- Menih, M., Križmarić, M., and Fabjan, T.H., 2017. Clinical role of von Willebrand factor in acute ischemic stroke. Wiener klinische wochenschrift, 129 (13–14), 491–496.
- Montaner, J., et al., 2010. A panel of biomarkers including caspase-3 and D-dimer may differentiate acute stroke from stroke-mimicking conditions in the emergency department. Journal of internal medicine, 270 (2), 166–174.
- Morgenstern, L., et al., 1998. Worst headache and subarachnoid hemorrhage: prospective, modern computed tomography and spinal fluid analysis. Annals of emergency medicine, 32 (3), 297–304.
- Ng, C.J., et al., 2005. The paraoxonase gene family and atherosclerosis. Free radical biology and medicine, 38 (2), 153–163.
- NINDS. 2003. Stroke scales and related information. Bethesda, MD: National Institute of Neurological Disorders; Stroke. Available from: https://www.ninds.nih.gov/Stroke-Scales-and-Related-Information.
- Ong, S.E. and Mann, M., 2005. Mass spectrometry-based proteomics turns quantitative. Nature chemical biology, 1 (5), 252–262.
- Parahuleva, M.S., et al., 2008. Factor seven activating protease (FSAP) expression in human monocytes and accumulation in unstable coronary atherosclerotic plaques. Atherosclerosis, 196 (1), 164–171.
- Parker, C.E. and Borchers, C.H., 2014. Mass spectrometry based biomarker discovery, verification, and validation – quality assurance and control of protein biomarker assays. Molecular oncology, 8 (4), 840–858.
- Parker, K.A. and Tollefsen, D.M., 1985. The protease specificity of heparin cofactor II. Inhibition of thrombin generated during coagulation. Journal of biological chemistry, 260 (6), 3501–3505.
- Paulovich, A.G., et al., 2008. The interface between biomarker discovery and clinical validation: the tar pit of the protein biomarker pipeline. Proteomics - clinical applications, 2 (10–11), 1386–1402.
- Penn, A.M., et al., 2015. Exploring phlebotomy technique as a pre-analytical factor in proteomic analyses by mass spectrometry. Genome, 58 (12), 569–576.
- Pepe, M.S., et al., 2008. Pivotal evaluation of the accuracy of a biomarker used for classification or prediction: standards for study design. Journal of the National Cancer Institute, 100 (20), 1432–1438.
- Pera, J., et al., 2013. Temporal changes of adiponectin plasma levels in patients with acute ischemic stroke. Neurological research, 35 (9), 988–991.
- Perry, J.J., et al., 2017. Validation of the Ottawa Subarachnoid Hemorrhage Rule in patients with acute headache. Canadian Medical Association journal, 189 (45), E1379–E1385.
- Perry, J.J., et al., 2011. Sensitivity of computed tomography performed within six hours of onset of headache for diagnosis of subarachnoid haemorrhage: prospective cohort study. BMJ, 343 (1), d4277–d4277.
- Pike, R.N., et al., 2005. Control of the coagulation system by serpins. FEBS journal, 272 (19), 4842–4851.
- Pinheiro, J., et al., 2016. nlme: Linear and nonlinear mixed effects models. Available from: https://CRAN.R-project.org/package=nlme.
- Plate, K.H., et al., 1999. Cell type specific upregulation of vascular endothelial growth factor in an MCA-occlusion model of cerebral infarct. Journal of neuropathology & experimental neurology, 58 (6), 654–666.
- Popp, R., et al., 2017. Immuno-MALDI (iMALDI) for quantifying AKT1 and AKT2 in breast and colorectal cancer cell lines and tumors. Analytical chemistry, 89 (19), 10592–10600.
- Prabhakaran, S., et al., 2008. Misdiagnosis of transient ischemic attacks in the emergency room. Cerebrovascular diseases (Basel, Switzerland), 26 (6), 630–635.
- Prugger, C., et al., 2012. Adipocytokines and the risk of ischemic stroke: the PRIME study. Annals of neurology, 71 (4), 478–486.
- Qizilbash, N., et al., 1997. Von Willebrand factor and risk of ischemic stroke. Neurology, 49 (6), 1552–1556.
- Quinn, T.J., et al., 2009. ABCD2 scores and prediction of noncerebrovascular diagnoses in an outpatient population: a case-control study. Stroke, 40 (3), 749–753.
- R Core Team. 2016. R: a language and environment for statistical computing. Vienna, Austria: R Foundation for Statistical Computing. Available from: https://www.R-project.org.
- Rathore, S.S., et al., 2002. Characterization of incident stroke signs and symptoms: findings from the Atherosclerosis Risk in Communities Study. Stroke, 33 (11), 2718–2721.
- Rau, J.C., et al., 2007. Serpins in thrombosis, hemostasis and fibrinolysis. Journal of thrombosis and haemostasis, 5(Suppl.1), 102–115.
- Reddy, S.T., et al., 2001. Human paraoxonase-3 is an HDL-associated enzyme with biological activity similar to paraoxonase-1 protein but is not regulated by oxidized lipids. Arteriosclerosis, thrombosis, and vascular biology, 21 (4), 542–547.
- Redondo, M., et al., 1999. Coagulation factors II, V, VII, and X, prothrombin gene 20210G→A transition, and factor V leiden in coronary artery disease: high factor V clotting activity is an independent risk factor for myocardial infarction. Arteriosclerosis, thrombosis, and vascular biology, 19 (4), 1020–1025.
- Robin, X., et al., 2011. pROC: an open-source package for R and S + to analyze and compare ROC curves. BMC bioinformatics, 12 (1), 77.
- Rodriguez, H., et al., 2010. Reconstructing the pipeline by introducing multiplexed multiple reaction monitoring mass spectrometry for cancer biomarker verification: an NCI-CPTC initiative perspective. Proteomics – clinical applications, 4 (12), 904–914.
- Savoia, C. and Schiffrin, E.L., 2007. Vascular inflammation in hypertension and diabetes: molecular mechanisms and therapeutic interventions. Clinical science, 112 (7), 375–384.
- Schwab, S., et al., 1997. Plasma insulin-like growth factor I and IGF binding protein 3 levels in patients with acute cerebral ischemic injury. Stroke, 28 (9), 1744–1748.
- Sedlaczek, O., et al., 2004. Detection of delayed focal MR changes in the lateral hippocampus in transient global amnesia. Neurology, 62 (12), 2165–2170.
- Sharma, R., et al., 2014. A blood-based biomarker panel to detect acute stroke. Journal of stroke and cerebrovascular diseases, 23 (5), 910–918.
- Sheehan, O.C., et al., 2009. Diagnostic usefulness of the ABCD2 score to distinguish transient ischemic attack and minor ischemic stroke from noncerebrovascular events. Stroke, 40 (11), 3449–3454.
- Shih, D.M., et al., 2007. Decreased obesity and atherosclerosis in human paraoxonase 3 transgenic mice. Circulation research, 100 (8), 1200–1207.
- Shimano, M., et al., 2008. Circulating adiponectin levels in patients with atrial fibrillation. Circulation journal, 72 (7), 1120–1124.
- Sing, T., et al., 2005. ROCR: visualizing classifier performance in R. Bioinformatics (Oxford, England), 21 (20), 3940–3941.
- Spectrometry in TIA Rapid Assessment [SpecTRA], 2016. Available from: http://www.viha.ca/rnd/current/spectra.htm.
- Suzuki, K., 2008. The multi-functional serpin, protein C inhibitor: beyond thrombosis and hemostasis. Journal of thrombosis and haemostasis, 6 (12), 2017–2026.
- Toulon, P.A., et al., 2008. Heparin cofactor II (HCII) levels and the risk of ischemic stroke. No deleterious role of HCII deficiency but potential protective role of high plasma level. Blood, 112 (11), 5344.
- Trompet, S., et al., 2011. Factor VII activating protease polymorphism (G534E) is associated with increased risk for stroke and mortality. Stroke research and treatment, 2011, 424759.
- Vittinghoff, E. and McCulloch, C.E., 2007. Relaxing the rule of ten events per variable in logistic and Cox regression. American Journal of Epidemiology, 165 (6), 710–718.
- Wang, S., et al., 2011. Random lasso. The annals of applied statistics, 5 (1), 468–485.
- Whiteaker, J.R., et al., 2007. Integrated pipeline for mass spectrometry-based discovery and confirmation of biomarkers demonstrated in a mouse model of breast cancer. Journal of proteome research, 6 (10), 3962–3975.
- Whiteley, W., 2011. Identifying blood biomarkers to improve the diagnosis of stroke. The journal of the Royal College of Physicians of Edinburgh, 41, 152–154.
- Whiteley, W., et al., 2009. Blood markers for the prognosis of ischemic stroke: a systematic review. Stroke, 40 (5), e380–e389.
- Whiteley, W., Tseng, M.-C., and Sandercock, P., 2008. Blood biomarkers in the diagnosis of ischemic stroke: a systematic review. Stroke, 39, 2902–2909.
- Whiteley, W., et al., 2011. Blood biomarkers for the diagnosis of acute cerebrovascular diseases: a prospective cohort study. Cerebrovascular diseases, 32, 141–147.
- Wickham, H., 2009. ggplot2: elegant graphics for data analysis. New York, NY: Springer-Verlag.
- Wieberdink, R.G., et al., 2010. High von Willebrand factor levels increase the risk of stroke: the Rotterdam study. Stroke, 41 (10), 2151–2156.
- Willeit, J., et al., 2003. Marburg I polymorphism of factor VII–activating protease: a prominent risk predictor of carotid stenosis. Circulation, 107 (5), 667–670.
- Wolf, P.A., Abbott, R.D., and Kannel, W.B., 1991. Atrial fibrillation as an independent risk factor for stroke: the Framingham Study. Stroke, 22 (8), 983–988.
- Wunderlich, M.T., Wallesch, C.-W., and Goertler, M., 2004. Release of neurobiochemical markers of brain damage is related to the neurovascular status on admission and the site of arterial occlusion in acute ischemic stroke. Journal of neurological sciences, 227 (1), 49–53.
- Zhang, Z. and Chopp, M., 2002. Vascular endothelial growth factor and angiopoietins in focal cerebral ischemia. Trends in cardiovascular medicine, 12 (2), 62–66.