
ABSTRACT
Micropsia is a rare condition in which patients perceive the outside world smaller in size than it actually is. We examined a patient who, after a right occipito-parietal stroke, subjectively reported perceiving everything at seventy percent of the actual size. Using experimental tasks, we confirmed the extent of his micropsia at 70%. Visual half-field tests showed an impaired perception of shape, location and motion in the left visual field. As his micropsia concerns the complete visual field, we suggest that it is caused by a higher-order compensation process in order to reconcile the conflicting information from the two hemifields.
Introduction
A distorted perception of the outside world, also referred to as metamorphopsia, is one of the intriguing visual disorders that may occur as a consequence of cortical damage. Patients with metamorphopsia may perceive objects as being smaller or larger than they actually are (micropsia and macropsia respectively). Other forms of metamorphopsia include the perception of curved instead of straight lines and, in its most dramatic forms, as distorted face perception or an upside down perception of the outside world (Nijboer, Ruis, van der Worp, & De Haan, Citation2008; Young, de Haan, Newcombe, & Hay, Citation1990). These distortions are different from hallucinations or illusions (Blom, Citation2016). Distortions are the result of deformations in sensory perceptions in one specific dimension, i.e., perceiving the outside world differently, for instance smaller (micropsia) or curved, while illusions are a momentary misinterpretation of a particular stimulus or situation while the sensory perception is still intact (Blom, Citation2016). Hallucinations are, in contrast to illusions and distortions, not based on an external stimulus (Waters et al., Citation2014). Metamorphopsia is often transient and is usually only present for several hours or days post-stroke (Blom, Citation2016). In rare occasions, symptoms can last longer (e.g., Ceriani, Gentileschi, Muggia, & Spinnler, Citation1998).
Micropsia is the most common form of metamorphopsia (Bender & Teuber, Citation1949a). Objects can be perceived smaller in one hemifield only (Cohen, Gray, Meyrignac, Dehaene, & Degos, Citation1994; Kassubek et al., Citation1999), but it is more common that both visual fields are equally affected (Ceriani et al., Citation1998; Mullan & Penfield, Citation1959; Russell & Whitty, Citation1955; Smith, Citation1980). Damage to the occipito-temporo-parietal brain region has been found to be related to micropsia (Brumm et al., Citation2010; Ceriani et al., Citation1998; Cohen et al., Citation1994). More specifically, a lesion affecting Brodmann area (BA) 19 has been found to cause hemimicropsia (Kassubek et al., Citation1999). However, details about the lesion localization in cases of whole-field micropsia remain unclear.
There is still controversy about the theories explaining micropsia. It has been put forward that micropsia is caused by a disturbance in the underlying mechanism responsible for size-constancy (Bender & Teuber, Citation1947; Kassubek et al., Citation1999). The principle of size constancy entails the perception of an object as being equally large, irrespective of the viewing distance. If this underlying mechanism would be disturbed in patients with micropsia, we would expect them to perceive objects smaller at greater viewing distances. However, Ceriani et al. (Citation1998) did not find support for this hypothesis in their study. Their patient with micropsia perceived objects smaller than they were in reality, regardless of the viewing distance. This indicates that it is more likely to be a higher-order processing problem, especially when both hemifields are affected (Nijboer et al., Citation2008). Ceriani et al. (Citation1998) explained the micropsia in their patient with another theory of Bender and Teuber (Citation1949b), in which it was suggested that the unilateral brain damage causes a conflict in what is perceived by the damaged right hemisphere versus what is perceived by the intact left hemisphere. This misbalance or rivalry in the visual perceptual network somehow causes a “micropsic bias” (Ceriani et al., Citation1998). However, details about the underlying mechanism for this bias remain unknown.
Thus, much is still unknown and a thorough examination of cases with micropsia is needed. In the current study, we examine a case of a patient with micropsia after suffering a stroke in the right posterior brain region. We conducted three experiments, in which we aimed to find an objective way to quantify the extent of the micropsia, to investigate grasping behavior in this patient and to investigate whether the micropsia involved both visual fields. In line with the theory of a functional rivalry, we expect that the micropsia affects both hemifields. Furthermore, we experimentally tested the visual functions separately for each hemifield. By means of this, we aimed to determine possible lateralized visual sensory deficits as a source of the functional rivalry in the visual perceptual network. Lastly, we used structural Magnetic Resonance Imaging (MRI) to ascertain the responsible brain lesion.
Case report
Ethics statement
This study was approved by an ethics committee and performed in accordance with the principles of the Helsinki Declaration and the Medical Research Involving Human Subjects Act (WMO). A written informed consent was obtained.
Case summary
DN, a 64-year-old man with higher vocational education, was admitted to the hospital with a hemiparesis of his left arm on 28 December 2017. Eleven days before this admission, DN already had complaints of temporary loss of vision (amurosis fugax) after which an MRI-scan was made (17 December 2017). This MRI-scan showed an infarction in the right occipital and parietal lobe. The CT-scan performed on 28 December 2017 showed an increase of infarction, affecting a larger area of the right occipito-parietal region.
After 28 December 2017, DN described seeing everything at seventy percent of the actual size. This included both objects and persons. When looking in the mirror, he also perceived himself at seventy percent of his actual size. His estimation of seventy percent was based on prior, pre-stroke knowledge about the original, true sizes of objects. Therefore, his micropsia was especially noticeable when perceiving familiar objects, of which the actual sizes were known. It particularly affected objects in relation to himself. For example, he constantly thought that his clothes would not fit him anymore, because they were perceived as too small. In clothing stores, he would choose clothes in size XL instead of M (his actual size) when the size label was not apparent. We suggest that this conflict occurs as he is comparing the size of the observed shirt with the recalled size from his memory, before an actual comparison between the shirt and his body is made. His micropsia made him insecure. Everything was perceived smaller, including distances and passages (“do I fit through this hallway?”). Despite this insecurity, he did not experience difficulties with biking and grasping objects in everyday life. Objects did not seem to be curved or distorted. The micropsia was constantly present and was not influenced by the position of his head. It did not relate to specific objects, such as faces or cars.
Colors were perceived normally. Shortly after the stroke on 28 December 2017, DN had the impression that he saw colors less vividly when watching television. However, after reconsideration, he concluded that this was caused by his disappointment that his television looked much smaller than before, reducing the “experience” when watching television.
Lastly, DN sometimes had a decreased attention for his left visual field. When reading, he sometimes noticed that a sentence “was missing words”. He then reread the sentence and found that he had accidentally skipped the first few words on the left side of the page. Explicitly focusing on the left side on the page helped him to overcome these problems.
Apart from his visual complaints, most things went well. The initial problems with his left arm were improving. After three months, he still tired easily but this was also getting better.
Imaging
The first MRI (17 December 2017, before the onset of the micropsia) showed several subacute infarcts in the right parietal and occipital lobe ()). On the second MRI (8 February 2018), there was an increase in size and extension of the several Fluid Attenuated Inversion Recovery (FLAIR) hyperintens (sub)cortical regions throughout the right parietal and occipital lobe, as can be seen in . The new lesions involved mainly the cuneus, occipital pole, inferior parietal lobule and the angular gyrus. There was also an increase in surrounding confluent white matter hyperintensity with atrophy in the right parietal and occipital lobe. In conclusion, there was an increase in size and extension of infarction throughout the right parietal and occipital lobe.
Figure 1. FLAIR MRI images of DN’s brain. (a1-b2) Comparisons of axial scans between December 2017, before the onset of the micropsia (a1 and b1) and February 2018, after the onset of the micropsia (a2 and b2). An increased size of the infarction throughout the occipital and parietal lobe can be seen. (c) Sagittal view. (d) Coronal view.
Neuropsychological assessment
Neuropsychological assessment showed intact orientation in time and place (Cognitive Screening Test). DN’s premorbid verbal intelligence was estimated at above average (National adult reading test). The memory span and working memory capacity were below average (subtest Digit Span of the Wechsler Adult Intelligence Scale-IV). DN showed intact performance on tasks assessing episodic memory (Rey Auditory Verbal Learning Test), language (Boston Naming Test and semantic and phonological fluency), executive functioning (Trail Making Test A and B and the subtest Rule Shift of the Behavioral Assessment of the Dysexecutive Syndrome) and emotion recognition (Ekman 60 Faces test of the Facial Expressions of Emotion: Stimuli and Test).
With respect to visuoperception and visuoconstructive functioning, a cancelation test (Bells test) and a line bisection test (Schenkenberg) did not show evidence for unilateral neglect. The spontaneous drawings of a house, cube, bike and clock were adequate. His copy of the Rey Complex Figure was poorly organized and the relations between the different elements were incorrect. Furthermore, performance on the Visual Object and Space Perception Battery (VOSP)-subtests incomplete letters, position discrimination and dot counting was below cutoff. Other VOSP-subtests were within the normal range. Performance on the judgement of line orientation test was also normal.
Taken together, DN showed impairments in his visuoperception and visuoconstructive functioning. The other cognitive functions were intact.
Visual sensory functions
To assess DN’s visual functions in more detail, separately for each hemifield, DN was assessed with a series of computer tasks. Our motivation for this assessment was to determine possible lateralized visual sensory deficits which could underlie the micropsia. A previous study has found impaired motion perception in a patient with hemimicropsia (Kassubek et al., Citation1999), but this study did not control for eye movement. Furthermore, no studies investigating (hemi)micropsia have assessed multiple visual features. Our tasks were based on the tasks developed by De Haan, Heywood, Young, Edelstyn, and Newcombe (Citation1995), which were also used by Nijboer et al. (Citation2008). In every task, one aspect of visual perception was assessed: color (ranging from red to green), shape (square versus rectangle), location (location of a dot in a circle) and correlated motion. These tasks were performed six weeks post-stroke (6 February 2018 and 8 February 2018).
Before the series of tasks, DN was assessed with the acuity test of the Freiburg Acuity and Contrast Test (FrACT; Bach, Citation1996) to screen for possible acuity problems. The observer distance was 200 centimeters. DN also performed a screening test to assess possible visual field deficits.
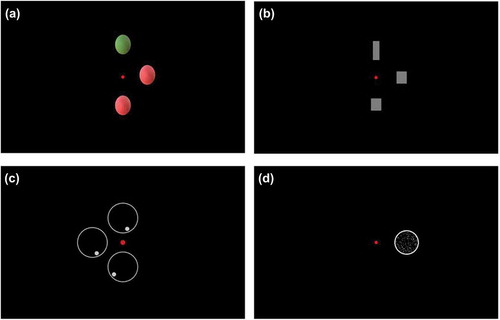
For the series of tasks, DN was positioned behind a 21.5 inch, 1920 × 1080 resolution computer screen (Benq GL2240) with his chin on a chinrest. The viewing distance was 66 centimeters. Every task started with a red fixating point in the middle of the screen. Then, in case of color, shape and location perception, a target picture was shown on the horizontal midline on either the left or the right side at 5 degrees from the fixating point. Subsequently, two response pictures appeared on the screen: one at 5 degrees above and one at 5 degrees below the red fixating point. One of these response pictures (the odd response picture) differed from the target picture on one aspect: color ()), shape () or location (). The other response picture was identical to the target picture on the midline. DN was instructed to indicate which picture was similar to the target picture on the midline. The stimuli used to assess color perception (colored circles) and location perception (circles with a dot in it) had a diameter of 3.5 degrees. The stimuli used to assess shape perception differed in length and width, but always had the same area (6cm2). In case of a square, sides were 2 degrees. To assess motion perception, a circle with 200 moving dots (diameter: 4.5 degrees) was presented in either the left of right hemifield at 6 degrees from the fixation point (). DN was asked to indicate whether the dots were moving upwards or downwards. A joystick was used to input the responses.
Figure 2. Stimuli used to assess (a) color perception, (b) shape perception, (c) location perception and (d) motion perception. The small red dot in the middle of each picture is the fixating point.
Eyelink 1000 was used to register and control for eye fixation and eye movement. The target picture in either the right or left visual field moved along with the eye movement. For example, if the target picture was presented in the right hemifield and DN moved his eyes to the right, the picture shifted along to the right. This way, the target picture always stayed in the respective visual hemifield.
Every task consisted of 24 trials per hemifield. In case of color, shape and location perception, the threshold for each hemifield was determined by adaptively changing the difference value between the target picture and the odd response picture. The procedure was largely similar to the procedure described by Nijboer et al. (Citation2008). The difference value was set on 23 (color), 26 (shape) or .46 (location). After three right or three wrong responses, the difference value became smaller or larger, respectively, with an initial stepsize of 4 (color and shape) or .08 (location). When a difference value of 11 (color), 14 (shape) or .22 (location) had been reached, the stepsize was reduced to 1 (color and shape) or .02 (location). The threshold was the lowest difference value, on which at least three correct responses had been given. In case of motion perception, the percentage coherence of the 200 moving dots was adaptively changed. The percentage coherence was set on 56% and after three right or wrong responses, this percentage became smaller or larger, respectively, with 8%. When a percentage coherence of 32% had been reached, the stepsize was reduced to 4%. The threshold was the percentage coherence of these moving dots on which at least three correct responses had been given. The thresholds were compared to a cutoff score (mean + (1.64*SD)), based on the thresholds of a healthy control group with 33 (color), 27 (location), 29 (shape) and 35 (motion) participants. These controls were tested in the context of a related study looking at subtle visual deficits in stroke patients. Exclusion criteria for controls consisted of neurological or psychiatric disorders or substance abuse.
The results from the screening tasks showed no visual acuity or visual field problems; DN’s performance on the FrAct (Bach, Citation1996) was above average (decVA = 1.5 and log of the minimum angle of resolution (logMAR) = −.18) and in the visual field task, DN’s performance was within the normal range.
The results from the tasks assessing color, shape, location and motion perception are presented in . Cutoff scores were equal for the left and right hemifield. A threshold below the cutoff score indicates intact performance and a threshold above the cutoff score indicates impaired performance. As can be seen in , DN performed below the cutoff score in both the left and right visual field on the task assessing color perception, indicating intact color perception. On the tasks assessing shape, location and motion perception, DN performed well above the cutoff score in the left visual field, whereas he performed only slightly above (shape perception) or below (location and motion perception) the cutoff score in his right visual field. That is, in case of shape and location perception in his left visual field, DN needed a higher difference value between the target picture and the odd response picture to be able to detect this difference adequately. In case of motion perception, DN needed higher percentages coherence of motion in his left visual field in comparison to controls and in comparison to his right visual field to be able to detect the direction of the dots.
Table 1. Thresholds and cutoff scores for color, shape, location and motion perception.
To conclude, DN showed an impaired perception of shape, location and motion especially in his left visual field, which extends the findings of Kassubek et al. (Citation1999). This was not caused by visual field or acuity problems, since performance on the respective tasks was normal.
Micropsia experiments
We conducted three experiments in order to (a) investigate DN’s grasping behavior, where we expected him to open his hands not wide enough when picking up objects, because of the perceived reduction in size of objects, (b) determine whether DN perceived objects as being smaller in size than they actually are in one of the hemifields or in both hemifields and (c) find an objective way to quantify the extent of the micropsia. These tasks were performed on 8 March 2018 and 21 March 2018.
Experiment 1. delayed grasping (8 March 2018)
In this experiment, five cubes of different sizes, sides ranging from 3.8 centimeters to 9.2 centimeters, were presented in isolation in a random order on a table in front of DN. DN was instructed to inspect the cube for five seconds, subsequently close his eyes and then grasp the cube with his right hand while his eyes remained closed. This was repeated for his left hand.
In this task, DN consistently opened his hand too wide, spreading his entire hand, even when the sides of the cube were only a few centimeters. When we queried him about this, DN told us that he was compensating for the fact the he was unsure about the exact size of the cubes.
Experiment 2. across visual field comparisons (8 March 2018 and 21 March 2018)
In this experiment, we investigated whether DN was able to perceive the different sizes of two cubes, one in each hemifield, in relation to each other. In this task, four cubes were used in total, ranging from 7.2 to 13.9 centimeters. There were fourteen trials in total. In five trials, the cube in the left visual field was larger, in five trials, the cube in the right visual field was larger and in four trials, both cubes were equally large. The sequence of stimulus-cubes is presented in . DN was asked to focus on a central bar in front of him and indicate whether the two cubes were equally large or that they differed and, in the latter case, which one was the largest. We performed this task two times: on 8 March 2018 and on 21 March 2018.
Table 2. Stimuli and responses of experiment 2 on 8 March 2018 and on 21 March 2018. Stimuli sizes are presented in centimeters. Incorrect responses are bold.
DN’s responses on this task on both 8 March 2018 and 21 March 2018 are presented in . The responses in bold typeface are incorrect responses. As can be seen in this table, on March 8, DN made seven mistakes. In six out of these seven mistakes, he underestimated the size of the left cube: in five occasions, he thought that the right cube was larger than the left cube, while in reality the left cube was larger (trials 11 and 14) or equally large (trials 5, 8 and 12) and in one occasion he thought that the cubes were equally large, while in reality the left cube was larger (trial 3). On March 21 (presented in the rightmost column of ), DN only made four mistakes. In only two of these mistakes, he underestimated the left cube (trials 5 and 8).
Experiment 3. size estimation (21 March 2018)
Ten cubes of different sizes, ranging from 3.8 to 13.9 centimeters, were presented in isolation in a random order in front of DN. The actual sizes of the stimulus cubes are presented in . The viewing distance was 1.5 meter. DN was instructed to close his eyes when the cubes were placed on the table so he would not see the experimenter holding the cube. We asked DN to open his eyes and to estimate the size of one side of the cube in centimeters. Eleven healthy controls with comparable age and education also performed this test. Mean age of healthy controls was 61.6 years (SD = 9.6) and mean educational level was 5.5 (SD = 0.5, range 5–6) on a scale ranging from 1 (primary school education) to 7 (university education). DN had educational level 6 (higher vocational education).
Table 3. Stimuli and responses from experiment 3, including tests on differences between DN and controls and percentages of DN’s estimation in comparison to estimations of controls. Stimulus sizes and responses are presented in centimeters.
The responses of DN and the mean responses of the healthy controls are shown in . As can be seen, DN underestimated the size of the cubes most of the times. DN’s estimations were on average at 89 percent of the actual size of the cubes. Estimations of controls were on average at 121 percent of the actual size. To compare estimations of DN with controls, Wilcoxon signed rank tests (because of non-parametric data) between DN and healthy controls were performed for each trial. As can be seen in , DN’s estimations were significantly smaller than the estimations of controls for all trials, except for trial 3 and trial 7. The percentages of the estimations of DN relative to the estimations of controls are presented in the rightmost column of . DN’s estimations were on average at 73 percent of the estimations of healthy controls.
To conclude, the micropsia seemed to involve both hemifields, although it appeared to be more pronounced in the left hemifield in the beginning (as found during the visit on 8 March 2018). Another explanation for the underestimation of the cubes in the left visual field in the beginning (Experiment 2) is that it might be related to the impaired perception of shape in the left visual field (as found in the visual sensory computer tasks described earlier). DN’s claim of perceiving everything at seventy percent was confirmed by the finding that he estimated the cubes at 73 percent of the average estimated size by the healthy controls. This suggests to us that DN has a good grasp of what his vision was like and what it looks like now. The observation that the healthy controls over-estimated the sizes of the blocks is in line with findings of Chen, Jayawardena, and Goodale (Citation2015) in which healthy subjects also overestimated the size of seen blocks when they had to indicate the size with their hand. DN’s performance on the delayed grasping task shows that, although he was well aware of his micropsia, he found it difficult to compensate with level of precision. He always opened his hands as wide as possible when picking up any block.
General discussion
We examined a case of a patient (DN), who suffered a stroke in the right occipito-parietal region. He complained of seeing everything at seventy percent of the actual size. Neuropsychological assessment showed impairments in visuoperception and visuoconstructive functions, but intact other cognitive functions. A detailed assessment of visual functions showed an impaired perception of shape, location and motion particularly in his left visual field. Color perception was intact. Furthermore, in line with the subjective estimate, our experiments also indicated a reduction in size perception of about seventy percent. The micropsia appeared to involve both hemifields, although it seemed to be more pronounced in the left visual field in the beginning.
The responsible right occipito-parietal lesion location is largely consistent with previous studies describing patients with metamorphopsia and micropsia (Brumm et al., Citation2010; Ceriani et al., Citation1998; Cohen et al., Citation1994; Kassubek et al., Citation1999; River, T. Ben, & Steiner, Citation1998). However, most studies point to an occipito-temporal involvement, while our patient had an occipito-parietal lesion. The micropsia started after increased infarction in the cuneus, inferior parietal lobule and the angular gyrus, so especially these areas might have been sufficient to produce the whole-field micropsia. However, because of the large size of the lesion, it remains difficult to identify which specific areas are related to the micropsia. Still, the unilateral lesions in the right posterior brain region are in line with the impaired shape, location and motion perception in mainly the left visual field (Ffytche, Blom, & Catani, Citation2010).
The micropsia was related to everything, not only to specific objects or to faces. Although DN noticed it more clearly with known objects, he also showed the phenomenon with, for instance, simple blocks. As a result, all objects were relatively speaking in proportion. For instance, he did not perceive (parts of) himself being disproportionally large or small, as is the case with macrosomatognosia, which is one of the characteristics of the Alice in Wonderland Syndrome (named after “Alice’s adventures in wonderland” by Lewis Carroll) (Blom, Citation2016; Carroll, Citation1865). Furthermore, the micropsia was always present; the viewing distance or head position did not change the perception. Because of this, it is unlikely that the micropsia could be attributed to an impairment in the underlying mechanism responsible for size-constancy, which is in line with the findings of Ceriani et al. (Citation1998).
The finding that everything was perceived smaller but still in proportion shows that there was a mismatch between DN’s conscious perception and DN’s pre-stroke knowledge of sizes of the world around him. What was the origin of this mismatch? In contrast to findings of Nijboer et al. (Citation2008), the micropsia in DN could not be described as a consequence of only a low-level visual processing impairment. The patients in the study of Nijboer et al. (Citation2008) had unilateral metamorphopsia, resulting in a distorted perception of only the left side of faces. Moreover, these patients had only impaired unilateral “low-level” shape perception, whereas motion perception was intact. In DN, on the other hand, both shape, location and motion perception were severely affected in the contralesional visual field and the micropsia was related to both hemifields, despite a slight indication of a more pronounced micropsia in the left visual field in the beginning. Taken together, DN’s micropsia cannot sufficiently be explained by low-level visual impairment, which is also in line with Ettlinger (Citation1956) and De Haan et al. (Citation1995).
In addition, an expansion of the theory of a functional rivalry between the damaged right hemisphere and the intact left hemisphere might be a possible explanation for the micropsia in DN (Bender & Furlow, Citation1945; Bender & Teuber, Citation1949b). DN had unilateral brain damage and we furthermore found unilateral impairments in shape, location and motion perception. These impairments were not consciously experienced by DN. Therefore, we hypothesize that DN’s brain might have tried to correct for these unilateral impairments by ignoring the impaired parts of this visual field and by recreating a new complete visual construct, based on the remaining visual information. The result is apparently a smaller, but symmetrical and meaningful representation of the outside world. According to Coren, Ward, and Enns (Citation2004), our conscious perception of the outside world is a continuously changing hypothesis, based on interpretations of the things we perceive at that moment and the relationships among these things. A change of these interpretations influences our conscious perception of the outside world (Coren et al., Citation2004).
A limitation of our experiments investigating the extent of the micropsia is that we were not able to perform more trials or to perform more repeats of the tasks, because of tiredness of our patient as a consequence of the stroke.
In sum, we suggest that the unilateral occipito-parietal infarction in our patient has caused contra-lesional visual sensory impairments, for which an unconscious, higher-order process tries to compensate at the price of creating a “shrunken” world.
Disclosure statement
No potential conflict of interest was reported by the authors.
Additional information
Funding
Related Research Data
References
- Bach, M. (1996). The freiburg visual acuity test - automatic measurement of visual acuity. Optometry and Vision Science, 73, 49–53.
- Bender, M. B., & Furlow, L. T. (1945). Phenomenom of visual extinction in homonymous fields ans psychologic principles involved. Archives of Neurology and Psychiatry, 53, 29.
- Bender, M. B., & Teuber, H. L. (1947). Spatial organization of visual perception following injury to the brain. Archives of Neurology and Psychiatry, 58, 721–739.
- Bender, M. B., & Teuber, H. L. (1949a). Disturbances in visual perception following cerebral lesions. The Journal of Psychology, 28, 223–233.
- Bender, M. B., & Teuber, H. L. (1949b). Psychopathology of vision. In Spiegel (Ed.), Progress in neurology and psychiatry (pp. 163–192). New York: Grune and Stratton.
- Blom, J. D. (2016). Het Alice in Wonderland-syndroom; wat weten wij na 60 jaar?. Tijdschrift Voor Psychiatrie, 58, 281–291.
- Brumm, K., Walenski, M., Haist, F., Robbins, S. L., Granet, D. B., & Love, T. (2010). Functional magnetic resonance imaging of a child with alice in wonderland syndrome during an episode of micropsia. Journal of AAPOS, 14, 317–322.
- Carroll, L. (1865). Alice’s adventures in wonderland. London: Macmillan & Co.
- Ceriani, F., Gentileschi, V., Muggia, S., & Spinnler, H. (1998). Seeing objects smaller than they are: Micropsia following right temporo-parietal infarction. Cortex, 34, 131–138.
- Chen, J., Jayawardena, S., & Goodale, M. A. (2015). The effects of shape crowding on grasping. Journal of Vision, 15, 6.
- Cohen, L., Gray, F., Meyrignac, C., Dehaene, S., & Degos, J. D. (1994). Selective deficit of visual size perception: Two cases of hemimicropsia. Journal of Neurology Neurosurgery and Psychiatry, 57, 73–78.
- Coren, S., Ward, L. M., & Enns, J. T. (2004). Consciousness. In Sensation and perception (6th., pp. 420–448). Hoboken, NJ: John Wiley & Sons Inc.
- De Haan, E. H. F., Heywood, C. A., Young, A. W., Edelstyn, N., & Newcombe, F. (1995). Ettlinger revisited: the relation between agnosia and sensory impairment. Neurosurgery, and Psychiatry, 58, 350–356.
- Ettlinger, G. (1956). Sensory deficits in visual agnosia. Journal of Neurology, Neurosurgery, and Psychiatry, 19, 297–307.
- Ffytche, D. H., Blom, J. D., & Catani, M. (2010). Disorders of visual perception. Journal of Neurology, Neurosurgery and Psychiatry, 81, 1280–1287.
- Kassubek, J., Otte, M., Wolter, T., Greenlee, M., Mergner, T., & Lücking, C. (1999). Brain imaging in a patient with hemimicropsia. Neuropsychologia, 37, 1327–1334.
- Mullan, S., & Penfield, W. (1959). Illusions of comparative interpretation and emotion; production by epileptic discharge and by electrical stimulation in the temporal cortex. A.M.A. Archives of Neurology and Psychiatry, 81, 269–284.
- Nijboer, T. C., Ruis, C., van der Worp, H. B., & De Haan, E. H. (2008). The role of funktionswandel in metamorphopsia. Journal of Neuropsychology, 2, 287–300.
- River, Y., T. Ben, H., & Steiner, I. (1998). Reversal of vision metamorphopsia: Clinical and anatomical characteristics. Archives of Neurology, 55, 1362–1368.
- Russell, W. R., & Whitty, C. W. (1955). Studies in traumatic epilepsy. 3 visual fits. Journal of Neurology, Neurosurgery, and Psychiatry, 18, 79–96.
- Smith, D. L. (1980). Micropsia: an uncommon pediatric Symptom. Clinical Pediatrics, 19, 297–298.
- Waters, F., Collerton, D., Ffytche, D. H., Jardri, R., Pins, D., Dudley, R., … Laroi, F. (2014). Visual hallucinations in the psychosis spectrum and comparative information from neurodegenerative disorders and eye disease. Schizophrenia Bulletin, 40, S233–S245.
- Young, A. W., de Haan, E. H. F., Newcombe, F., & Hay, D. C. (1990). Facial neglect. Neuropsychologia, 28, 391–415.