
 ?Mathematical formulae have been encoded as MathML and are displayed in this HTML version using MathJax in order to improve their display. Uncheck the box to turn MathJax off. This feature requires Javascript. Click on a formula to zoom.
ABSTRACT
This study assessed pseudoneglect using line bisection and perceptual landmark tasks in two matched online sessions. Line bisection bias was characterized by the traditional measure of Directional Bisection Error (DBE), and by Endpoint Weightings Bias (EWB), derived from an “endpoint weightings” analysis, made possible by the independent manipulation of left and right endpoints. EWB is proposed to index the relative attentional allocation to the two ends of the line. The expected leftward bias (pseudoneglect) was found, with larger effect sizes for EWB (d = −0.34 in both sessions) than for DBE (−0.22 in Session 1 and −0.14 in Session 2). Although EWB was slightly less reliable than DBE, it was more sensitive to pseudoneglect, and the endpoint weightings method has further advantages, including the option of an additional measure of non-lateralized attention. A substantial proportion of participants had difficulty following the instructions for the landmark task, which highlights the need for clear instructions and performance checks for this task. This study shows that line bisection can be used to measure pseudoneglect online, and provides grounds to suggest that the task should routinely include the independent manipulation of left and right endpoints, so that an endpoint weightings analysis can be performed.
Introduction
Pseudoneglect in line bisection tasks
Line bisection is a simple task used to study lateral asymmetries of spatial attention. In the standard version, participants are shown a horizontal line and asked to mark its midpoint. Traditionally, the deviation from the true midpoint, the directional bisection error (DBE), is the index of bias. Patients with left-sided neglect show a large rightward DBE, suggesting a relative lack of attention (or action) to the left side (Heilman & Valenstein, Citation1979; Marshall & Halligan, Citation1990; Schenkenberg, Bradford, & Ajax, Citation1980). Neurotypical young adults show a more subtle leftward bias known as “pseudoneglect”, observed originally for a tactile version of the task (Bowers & Heilman, Citation1980), and then for visually-presented lines (see Jewell & McCourt, Citation2000). The present study will test whether pseudoneglect can be measured reliably using line bisection tasks administered via an online platform, using different measures of spatial bias.
Standard line bisection involves a manual response, so spatial biases could be influenced by motor/intentional as well as by perceptual/attentional factors. A more purely perceptual version is the landmark task, in which participants make forced-choice responses about pre-transected lines, judging which side of the line is longer (or shorter), and responding verbally, or with buttons or pedals, to reduce directional motor demands. Some brief versions of the landmark task quantify how often the left side is chosen as longer (or shorter) on critical trials in which the stimulus line is accurately bisected (e.g., Milner, Brechmann, & Pagliarini, Citation1992). More-refined versions of the task vary the transection position across many trials and fit a logistic function to estimate the Point of Subjective Equality (PSE) at which the probability of reporting either side of the line as longer/shorter is 50% (e.g., McCourt, Garlinghouse, & Slater, Citation2000, Citation2001). Landmark tasks are often administered with supra-second or unlimited viewing, but McCourt and colleagues have advocated for a tachistoscopic method, with very brief viewing durations (<200 ms), which eliminate any influence of overt scanning (McCourt, Citation2001; McCourt et al., Citation2000, Citation2001; McCourt & Garlinghouse, Citation2000; McCourt & Jewell, Citation1999; McCourt & Olafson, Citation1997).
Twenty years after the first report of pseudoneglect (Bowers & Heilman, 1980), Jewell and McCourt (Citation2000) published a meta-analysis of visual and tactile bisection biases of 2191 participants across 73 studies, bringing order to “considerable between-study variability and inconsistency” (pg. 93). Their random effects model showed that pseudoneglect was modulated by various participant and task factors. A much larger pseudoneglect effect size was estimated for the landmark task than for standard line bisection (d = −1.18 vs −0.31). Notably, the landmark studies included in the meta-analysis were all tachistoscopic, so it is unclear if this result implies a higher sensitivity to pseudoneglect for the landmark task in general, or perhaps that perceptual biases are strongest in the first few hundred milliseconds of viewing (see also Thomas, Loetscher, & Nicholls, Citation2012).
Test-retest reliability, and inter-task correlations
Line bisection and landmark tasks both tap into pseudoneglect, but their demands differ, so they may not provide equivalent information. It is unclear how strong we should expect the correlations to be between these tasks, but this will likely be constrained by the test-retest reliability of each. For a sample of 24 participants, Luh (Citation1995, Experiment 2) reported good reliability between a paper-based line bisection task and a mouse-controlled computerized version (r = .71); and both bisection tasks correlated moderately with landmark bias (r = .42 and .54). In a slightly larger sample (n = 43), Dellatolas, Vanluchene, and Coutin (Citation1996) found less good reliability between paper-based and computerized versions of line bisection (r = .40 or .50, depending on the hand used), and between paper-based and computerized landmark tasks (r = .52). The correlation between computerized bisection and landmark tasks was at approximately the same level (r = .49). Much more impressive test-retest reliabilities were reported by Varnava, Dervinis, and Chambers (Citation2013), for computerized bisection and landmark tasks (r = .84 and .80 respectively), with a respectable inter-task correlation (r = .65), but in a small participant sample (n = 24). These three studies used landmark tasks that were similar to line bisection in being unspeeded, but the measures of landmark bias were based on aggregated judgements across relatively few trials (<50), rather than reflecting PSE estimated across many trials.
In the largest repeated-test sample reported to date (n = 50), Learmonth, Gallagher, Gibson, Thut, and Harvey (Citation2015) estimated PSE for a tachistoscopic landmark task (136 trials), and DBE for a mouse-controlled bisection task (108 trials), with a second test session at least 24 h after the first. Test-retest reliability was excellent for DBE (r = .85), and more modest for PSE (r = .60), but the cross-task correspondence was very low (r = .27), leading the authors to suggest that the two tasks tap into distinct components of pseudoneglect. A similar conclusion was proposed by Mitchell, Harris, Benstock, and Ales (Citation2020), who administered a touchscreen-based line bisection task (90 trials) and a tachistoscopic forced-choice landmark task (180 trials) across four sessions in 28 participants. Cronbach’s alpha was excellent for landmark PSE (.80) but extremely poor for bisection DBE (−.11). Given that DBE itself was entirely unreliable in this study, it is unsurprising that it did not correlate with PSE (r = .02).
A recent study of the online measurement of lateral perceptual biases (for dichotic listening, facial emotion processing, and other tasks) adopted r ≥ .65 as a criterion level of test-retest reliability, for a task to be potentially useful for studying individual differences (Parker, Woodhead, Thompson, & Bishop, Citation2021). In the pseudoneglect studies reviewed above, test-retest reliabilities above this level have been reported for line bisection (Learmonth et al., Citation2015; Luh, Citation1995; Varnava et al., Citation2013), and also for the landmark task (McCourt, Citation2001; Mitchell et al., Citation2020; Varnava et al., Citation2013), but reliability estimates are often lower than this, and the inter-task correlations are usually modest or poor. Further interpretation of this literature is hampered by the variety of versions of the tasks used, and the modest sample sizes involved (n ≤ 50). Such restricted samples would be insufficient for stable estimates of reliability, even assuming true (population) correlations as high as .70; and for true correlations of .35 or less, more than 200 participants would be desirable (Schönbrodt & Perugini, Citation2013). The present study aims to implement these tasks in an online format, facilitating the testing of larger samples.
End-point weightings method
This study will also evaluate an “endpoint weightings” method that has been proposed for the line bisection task, and which may have advantages over the traditional method that focuses on bisection error relative to the objective midpoint (McIntosh, Citation2006, Citation2018; McIntosh, Schindler, Birchall, & Milner, Citation2005, Citation2017). The endpoint weightings method exploits trial-by-trial modulations in the participant’s response when the left and right endpoints of the line are manipulated independently. In a basic endpoint weightings design, there might be four stimulus lines, created by factorially crossing two left endpoint positions (−50 mm, −100 m from the centre of the workspace) with two right endpoint positions (50, 100 mm from the centre of the workspace). The resulting line configurations (A-D) are depicted in a, and each line is presented individually multiple times, with the participant asked to mark the midpoint. Within a traditional bisection framework, lines A and D would be described as shorter and longer (100 and 200 mm), and B and C would be lines of intermediate length (150 mm) shifted 25 mm towards left and right space respectively.
Figure 1. (a) Stimulus lines for a basic endpoint weightings design. Four line configurations (A-D) are created by the factorial crossing of two left endpoint positions (−50, −100 mm) with two right endpoint positions (50, 100 mm), coded relative to the horizontal midline (dotted line). (b) An example bisection response for a line of configuration C, bisected by a mouse-controlled cursor on a monitor. The horizontal coordinates of the two endpoints (L and R) and the response position (P) are all coded relative to the centre of the display. In this example, the line has been bisected accurately (bisection error is zero) but the response position P would be recorded as +25 mm. For illustrative purposes, the hand cursor-icon has been over-scaled, and the alphabetic labels and dotted midline have been added.
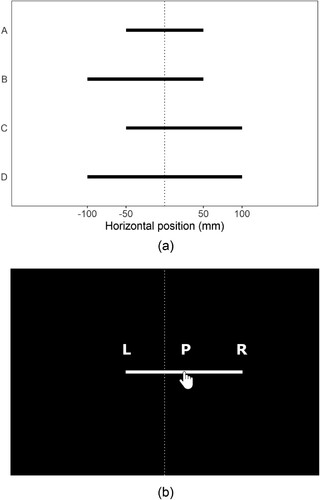
The first difference of the endpoint weightings approach is that the stimulus lines are not conceived in terms of the independent variables of length and spatial position, but according to a more fundamental Euclidian conception of a line segment, defined by two endpoint positions (L and R). The second difference is that the participant’s response is not coded as an error relative to the objective midpoint, but as a horizontal position (P), within the same co-ordinate system as the endpoints (i.e., relative to the centre of the workspace). b schematically illustrates the horizontal positions of L, R and P for a line of configuration C that has been accurately bisected. A third difference is that the critical performance measures for the endpoint weightings method do not occur at the level of each response, but are extracted from an analysis of how P changes across stimuli with different positions of L and R (see below). The dependent measures in an endpoint weightings analysis capture regularities of behaviour that transcend the particular set of stimuli presented.
Conceptually, the left and right endpoint weightings index the influence that each endpoint has on bisection responses. Numerically, they are given by the change in P when the (left or right) endpoint is varied, expressed as a proportion of the endpoint shift. If we take as an example, an arithmetical calculation of the right endpoint weighting would be mean P when the right endpoint is at its far position (lines C and D) minus mean P when the right endpoint is at its near position (lines A and B), divided by the difference between the far and near endpoint positions (50 mm). The left endpoint weighting would be mean P for lines B and D minus mean P for lines A and C, divided by 50. A more flexible method is to run a linear regression of P on the left and right endpoint positions (P ∼ L + R), with the slope coefficients of the best-fitting straight line giving the left and right endpoint weightings (see Methods for full details). However, the critical dependent measures for describing bisection behaviour are not the endpoint weightings themselves, but two further composite measures, which are derived from the endpoint weightings.
First, the symmetry (or asymmetry) of performance is indexed by the Endpoint Weightings Bias (EWB), given by the right endpoint weighting minus the left endpoint weighting. Positive EWB values indicate a stronger influence of the right endpoint, and negative values a stronger influence of the left. If an endpoint weighting can be interpreted as a measure of attention allocated to that end of the line (McIntosh, Citation2018), then EWB is literally the difference between the attention allocated to the right and left ends. EWB has been shown to be more sensitive to spatial neglect than is the traditional measure of DBE (McIntosh, Citation2018; McIntosh et al., Citation2005, Citation2017). For instance, in a sample of 30 neglect patients, 22 exceeded the cut-off for left neglect using EWB, compared to only 15/30 for DBE (McIntosh et al., Citation2005). In the same study, the age-matched control group (n = 30) showed a statistically stronger pseudoneglect when measured by EWB (mean 0.03, 95% CI 0.05–0.01, Cohen’s d = 0.60) than when measured by DBE (mean – 54 mm, 95% CI −1.23–0.15, Cohen’s d = 0.29). Similarly, when the endpoint weightings analysis was applied to younger adults, EWB showed pseudoneglect with a large effect size (mean −0.02, 95% CIs −0.03 to −0.02, Cohen’s d = −0.95), while DBE did not (mean −0.41, 95% CIs −0.93–0.11, Cohen’s d = 0.27) (Experiment 2 of McIntosh, Brown, & Young, Citation2019). The endpoint weightings method may thus be more sensitive than traditional line bisection to pseudoneglect in neurotypical samples, as well as to neglect in clinical samples.
Second, the endpoint weightings method also offers a non-lateralized index of bisection performance (McIntosh, Citation2018; McIntosh et al., Citation2005): the Endpoint Weightings Sum (EWS), which is the left endpoint weighting plus the right endpoint weighting. If an endpoint weighting can be interpreted as the amount of attention allocated to each end of the line, then EWS would measure the total attention allocated to the task. Clinical data lend some plausibility to this idea, because patients with spatial neglect are known to have reduced overall attentional resources (Husain & Rorden, Citation2003; Robertson, Citation1993), and they also tend to have lower EWS scores than controls (McIntosh et al., Citation2005). The possible utility of EWS as a non-lateralized measure of attention for line bisection has not yet been addressed in neurotypical participants, but we will explore this idea in the present study.
The present study
We set out to assess the validity and reliability of alternative measures of pseudoneglect for line bisection and landmark tasks, using an online platform. To our knowledge, this is the first investigation of the feasibility of doing so, and of the data quality that can be expected. The vast majority of bisection data in the literature has come from left-to-right reading cultures, and the leftward bias of pseudoneglect may be reduced or even reversed in right-to-left readers (Chokron & De Agostini, Citation1995; Chokron & Imbert, Citation1993; Muayqil et al., Citation2021; Rinaldi, Di Luca, Henik, & Girelli, Citation2014; but see Nicholls & Roberts, Citation2002, for a contrary result). To test the validity of our online tasks for the measurement of pseudoneglect, we will concentrate on left-to-right (dextrad) readers, for whom we can most confidently expect a leftward bias. We will evaluate measures of spatial bias derived from the traditional and the endpoint weightings analyses of line bisection (DBE and EWB respectively), and a measure of bias from the landmark task (PSE). By testing participants twice, we will be able to estimate the test-retest reliability for each measure, in addition to the strength of inter-task correlations. Finally, we will speculatively explore the possible validity of a non-lateralized measure of attention (EWS), derived from the endpoint weightings analysis of the line bisection task.
Methods
Open science and ethics statement
We report how we determined our sample size, all data exclusions, all inclusion/exclusion criteria, whether these criteria were established prior to data analysis, all manipulations, and all measures in the study. Task materials, full data and analysis code are archived online at https://osf.io/kj8h2/. The study was approved by the Psychology Research Ethics Committee at the University of Edinburgh.
Participants
In total, 253 verified participants were recruited from Testable MindsFootnote1: 156 were male, 96 were female and one identified as “other”. The mean age was 30.6 years (SD = 8.8, range 18–58). The Testable Minds participant pool is advertised as having 85% of participants from countries with English as a first language, and all recruitment and study information was in English. First language information was available for 243 participants, and covered 30 different languages, all of which have dextrad (left-to-right) scripts; the four most common were English (55.9%), Spanish (6.1%), Italian (5.7%) and Portugese (5.7%).
Participants completed an online version of the Edinburgh Handedness Inventory (Oldfield, Citation1971), from which we computed a short-form Laterality Quotient (LQ) (Veale, Citation2014). LQ ranged from −100 (fully left-handed) to 100 (fully right-handed), with a median of 87.5. By conventional cut-offs, 23 participants would be classified as left-handed (LQ < −60), 24 as mixed-handers (−60 ≥ LQ ≤ 60), and 206 as right-handed (LQ > 60).
The mean duration of each test session was 19.9 min (SD 4.8, median 19.3), and participants were offered $7 to complete two sessions (∼ US$10.88 per hour), or US$2.5 for just one session (∼ US$7.77 per hour). If participants did not pass initial data quality checks for the first session, they were not invited to a second session.
Sample size rationale
The largest meta-analysis in this area (Jewell & McCourt, Citation2000) estimated a standardized effect size, for pseudoneglect in a standard line bisection task, of d = −0.31 (random-effects model). This was lower than the corresponding estimate for a (tachistocopic) landmark method (d = −1.18). A sample size of 138 would provide .95 power to detect an effect size of 0.31, with a two-tailed alpha of .05, setting a minimum desirable sample size for a high-powered confirmatory test of pseudoneglect. However, our main concern is with parameter estimation, so we recruited the largest sample that resources would cover (n = 253). After data exclusions, the sample sizes per analysis ranged from 210 to 229. These sample sizes should allow stable estimates for true (population) correlations as low as .3, where stability is defined as 80% confidence that the estimated correlation is within .1 of the true population value (see Table 1 of Schönbrodt & Perugini, Citation2013).
Tasks and procedure
Two identical sessions spaced nine days apart were performed in a full-screen browser on a desktop or laptop computer. The session began with the Testable screen-size calibration step, which instructed the participant to adjust a horizontal line to match the length of a credit card (or similar). This allows for the standardization of stimulus sizes across different combinations of display size and screen resolution. Participants then responded to nine of the ten hand preference items from the Edinburgh Handedness Inventory (Oldfield, Citation1971),Footnote2 and also reported the hand and device they were using. The vast majority (96%) of participants reported using their right hand; 58% reported using a mouse, 39% a trackpad or trackball, and 3% a touchscreen. Different response devices were treated as equivalent in our analyses.
Participants completed one block each of a line bisection and a landmark task, with task order counterbalanced across participants. Task order in Session 2 was similarly counterbalanced, but was unrelated to the task order used for Session 1. Line stimuli were 1 mm thick, presented in white on a black background, at the vertical midline of the screen. Each line was preceded by a dot in the lower part of the screen, displaced by 15 mm to the left or right, which the participant was instructed to click on, in order to reset the cursor position. Written instructions for each task were given at the beginning of the relevant task block.
Line bisection
In the line bisection task participants were required to click the middle of a horizontal line. To enable an endpoint weightings analysis, line bisection stimuli were created by the factorial combination of two left endpoint locations (−50 and −100 mm from the screen centre) with two right endpoint locations (50 and 100 mm from the screen centre). a (see Introduction) shows these four line configurations, and b schematically illustrates an example trial. The four lines were shuffled within each epoch of four trials, so no line could appear more than twice in a row. Participants completed 22 epochs, with the first two epochs discarded as practice, yielding 20 experimental trials for each of the four lines (80 trials).
Landmark task
In the landmark task, all lines were 200 mm long, centred on the screen, and transected at one of twelve positions (.2, .6, 1, 2, 4 and 8 mm to left and right of centre). In the online environment, we could not rigorously control fixation position, and we did not attempt to use a tachistoscopic method that would eliminate eye movements. We gave participants no instructions regarding eye position or eye movements. However, we restricted the viewing duration for each line to one second. After line presentation, two buttons appeared, labelled “Left” and “Right”, in the lower part of the screen. The participants were required to click one button to indicate which side of the line was longer, or shorter, depending on the instruction. The instruction was counterbalanced across participants and across task order, but was unrelated across sessions. The twelve differently-transected lines were shuffled within each epoch of twelve trials, so no line could appear more than twice in a row. Participants completed 10 epochs, preceded by five trials discarded as practice, yielding 10 experimental trials for each transection position (120 trials).
Initial data processing and exclusions
Calibration and consistency checks
The scaling of stimuli and dependent measures for these spatial tasks depends upon the participant performing the Testable calibration step accurately. It is not possible to confirm this definitively, but we can screen the calibration scaling factors for implausible values. The pixels-per inch (PPI) values estimated from the observed calibration factors ranged from 61–256 PPI, except for one implausible outlying value of 362 PPI for one participant in Session 1 (this session was removed for this participant, see Data exclusions).
We asked the same demographic questions at the start of each session, and this provided a global means to assess consistency of responding. Sex was always reported consistently across sessions, and age was reported consistently, but with a difference of one year for ten participants, and of two years for one participant. We ascribed these minor differences to birthdays falling between test sessions and/or to typos, and we used mean age across sessions per participant. LQ was calculated for the Edinburgh Handedness Inventory based on the four items of the short-form version (writing, throwing, toothbrush, spoon) (Veale, Citation2014). LQ was always directionally consistent across sessions, and correlated at r = .98 between sessions. We used mean LQ across sessions per participant. These initial checks provided confidence that participants were responding to questions in a consistent way.
Task durations
The total number of trials for the line bisection and landmark tasks (88 and 125 respectively) had been intended to approximately equate the durations of the task blocks (∼10 min, based on piloting). In practice, participants performed the (self-paced) line bisection task faster than the landmark task, in which stimulus exposure duration was fixed. The mean block duration for participants returning valid data (see Data exclusions) for the line bisection task was 6.4 min (SD = 2.6, median 5.9), whereas for the landmark task it was 10.0 min (SD = 2.7, median 9.5).
Line bisection task
For each trial in the line bisection task, the horizontal position (P) of the response was recorded, and two alternative analyses were run. First, Directional Bisection Error (DBE) was encoded as the deviation of P (in mm) from the objective midpoint of the line, where negative values represent a leftward bias and positive values a rightward bias. The (unweighted) mean DBE was then calculated across the four line configurations for each block and participant.
Second, an endpoint weightings analysis was conducted, by fitting a linear regression for each block and participant, with the left endpoint (L) and the right endpoint (R) positions as predictors of P:
(1)
(1) In this equation, dPL (left endpoint weighting) is the best-fitting slope coefficient for the left endpoint, whilst dPR (right endpoint weighting) is the best-fitting slope coefficient for the right endpoint, and k is an intercept constant (see Discussion). The Endpoint Weightings Bias (EWB) was then calculated as the right endpoint weighting minus the left endpoint weighting, such that negative values of EWB indicate a stronger influence of the left endpoint, and positive values a stronger influence of the right endpoint:
(2)
(2) Additionally, a possible non-lateralized index of total attention (EWS: Endpoint Weightings Sum) was calculated by summing the left and right endpoint weightings:
(3)
(3)
Landmark task
For the landmark task, a binary logistic regression with a logit link function was fitted for each block and participant to predict the response from the transection position. The best-fitting model was used to estimate the Point of Subjective Equality (PSE): the transection position (in mm) at which the probability of choosing either side of the line as longer/shorter is 50%, where negative values represent a leftward bias and positive values a rightward bias. The Just Noticeable Difference (JND) was also extracted from this model, as half of the absolute difference (in mm) between the transection positions producing 25% and 75% responding. By convention, this is an estimate of the smallest change of transection position that the participant can reliably notice. The JND reflects the steepness of the slope of the psychophysical function, around the 50% crossover point, and can be regarded as a measure of the precision of perceptual discrimination. A smaller JND implies a steeper slope, and higher precision, and a larger JND implies a shallower slope, and lower precision.
Data exclusions
According to pre-defined criteria, line bisection data were deemed invalid if the endpoints regression accounted for less than 70% of the variance in P (r2 < .7), indicating that responses were not well-related to stimuli, or if the analysis yielded an implausibly large magnitude of EWB (absolute EWB > .5), or an implausibly low EWS (<.5). Landmark data were deemed invalid if the binary logistic regression was not significant, according to the Wald test (p > .05), or yielded an implausibly large magnitude of PSE (<−20 mm or >20 mm).
Of the 253 participants in Session 1, 22 had invalid line bisection data, and 26 had invalid landmark data, giving an exclusion rate of around 10% for both tasks. Only participants with valid data for at least one task in Session 1 were invited to participate in Session 2 (n = 226). Two of these participants produced invalid bisection data in Session 2, and six produced invalid landmark data in Session 2.
Further exclusions were based on criteria decided during data analysis. One participant was excluded from Session 1 due to an outlying calibration factor (362 DPI), as described in Consistency checks. For the test-retest reliability analyses, five participants were excluded for being inconsistent in the hand used across sessions.
Sample size for each sub-analysis is reported within results.
Results
Landmark task
Spatial bias for the landmark task was quantified using the Point of Subjective Equality (PSE), and precision of judgement using the Just Noticeable Difference (JND). shows descriptive statistics for each measure and each session, accompanied by a one-sample t-test against zero for PSE. Clearly, the expected pattern of pseudoneglect was not obtained for this online version of the landmark task. However, this result should be treated with caution, because an unexpected issue came to light during the analysis, as described below.
Table 1. Descriptive statistics for measures of landmark task performance for each session, with a one-sample t-test against zero, and a standardized effect size estimate (Cohen’s d) for the measure of perceptual bias, PSE.
When analysing the data from the landmark task, it was noted that psychophysical functions were quite often reversed relative to the direction expected: some participants who were asked to indicate the shorter end of the line had instead indicated the longer end, or vice-versa. Of the 447 valid psychophysical fits across the two sessions, 22% were reversed, and these reversals were three times as common when the instruction was to indicate which side was shorter (33%) rather than which side was longer (11%) (). Participants producing reversed fits responded systematically, but as if they had been given the opposite instruction. Post-hoc checks of the experiment code confirmed that the correct instruction had been given to these participants.
Table 2. Number of valid psychometric fits showing correct and reversed patterns of performance according to the landmark task instruction (indicate which is “shorter” or “longer”) and test session.
Further analysis suggested no differences between the correct and reversed psychophysical fits in terms of the PSE or JND, suggesting that the response quality was equally good for the reversed and correct fits (see Supplementary Material, Table S1). Nonetheless, this compliance issue undermines the credibility of our landmark task, particularly because the expected pattern of pseudoneglect was not observed in either session. The main conclusion from this task is a practical one, that our instruction screen presented at the start of the landmark task was insufficient to fix the required judgement firmly in the participants’ minds. Future versions of the task should more strongly emphasize the judgement required, possibly even as a prompt shown with the response options on every trial. It might also be wise to include practice trials in which obviously asymmetrical transections are presented, to check that participants are responding as instructed. Full quantitative data for the landmark task are reported in Supplementary Materials.
Line bisection task
Spatial bias for the line bisection task was quantified using Directional Bisection Error (DBE) and Endpoint Weightings Bias (EWB), and Endpoint Weightings Sum (EWS) was used as a possible non-lateralized measure of attention (see Introduction). Descriptive statistics in are accompanied by a one-sample t-test against zero, and a standardized effect size estimate (d), for the two measures of bisection bias. Each measure of bias can be classed as a valid measure of pseudoneglect if a significant (p < .05) leftward bias is found in both sessions, with no correction for multiple comparisons.Footnote3 DBE and EWB both provided valid measures of pseudoneglect by this criterion, but the effect sizes were substantially larger for EWB. These patterns are clearly visible in the marginal histograms in a and b. and c also show that the central tendency of EWS is slightly higher than one.
Figure 2. Scattergrams relating Session 1 and 2 scores for: two measures of bias for the line bisection task, DBE (panel a) and EWB (panel b); and a proposed non-lateralized measure of attention for the line bisection task, EWS (panel c). The Pearson correlation (r) is reported as a measure of test-retest reliability, and the Concordance Correlation Coefficient (CCC) as a measure of test-retest agreement. The dotted line is the line of identity, and the solid line is the line of best fit (±1SE shaded area). Marginal histograms depict the distributions of scores per session.
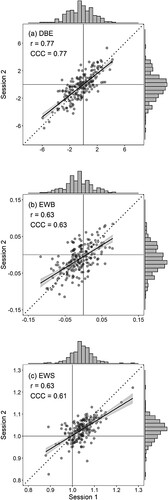
Table 3. Descriptive statistics for measures of line bisection performance, for each test session, with a one-sample t-test against zero, and a standardized effect size estimate (Cohen’s d) for the two measures of bisection bias, DBE and EWB.
Relationships between measures of bisection performance
shows that DBE and EWB were correlated robustly but far from perfectly in both sessions (r = .57 and .62). Thus, although these two measures of lateral bias are extracted from the same set of bisection responses, they are not equivalent measures. It is also worth noting that EWS is uncorrelated with both measures of bisection bias, consistent with the idea that this is a non-lateralized measure of total attention that is independent of lateral bias.
Table 4. Correlations [95% CIs] are Pearson’s r between measures of bisection performance for Session 1 (above the diagonal, n = 229) and Session 2 (below the diagonal, n = 224).
Exploratory analysis of endpoint weightings sum (EWS)
To explore the possible validity of EWS as a measure of non-lateralized attention, we analysed the effect of time-on-task. EWS was extracted separately for the first half-block (trials 1–40) and the second half-block (trials 41-80) of each session. A repeated measures ANOVA was then conducted with the factors of half-block (first, second) and session (Session 1, Session 2), for participants with valid line bisection data for both half-blocks in both sessions (n = 215). There were significant main effects of half-block (F1,214 = 41.23, p = 9e−10, partial η2 = .16, generalized η2 = .01) and session (F1,214 = 23.02, p = 3e−6, partial η2 = .10, generalized η2 = .02), with no significant interaction. a shows that EWS reduced from the first to the second half-block (mean reduction 0.01, SD 0.03, d = 0.44), consistent with an effect of declining arousal and engagement due to time on task. EWS also reduced from Session 1 to Session 2 (mean reduction 0.01, SD 0.04, d = 0.33).
Figure 3. (a) Mean EWS by half-block and session. (b) Mean bisection response time by half-block and session. The y-axis is on a logarithmic scale, but the axes ticks and labels are given in seconds, for ease of interpretation. In both plots, error bars show 95% confidence intervals for within-subject effects (Morey, Citation2008).
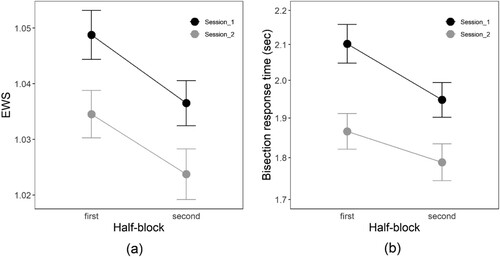
The reduction of EWS across sessions would not be explicable in terms of continuous time-on-task. However, participants may pay less attention to the bisection task in the second session because it is already familiar to them. We explored this idea by analysing the average bisection response time, extracting the median latency between line onset and bisection response, for each participant in each half block. Across participants, the distribution of median response times was positively skewed, with a long rightward tail, similar to typical reaction time distributions. To moderate the influence of the slowest participants, we log transformed these data prior to analysis. b shows that the pattern of (log) response times approximately mirrored that of EWS, reducing from first to second half-blocks, and between sessions. The main effects of session (F1,214 = 27.62, p = 4e−7, partialη2 = .11, generalized η2 = .01) and half-block (F1,214 = 69.82, p = 8e−15, partial η2 = .24, generalized η2 = .004) were both significant. In this case, however, there was also a slight interaction, suggesting that the effect of half-block was less pronounced in the second session (F1,214 = 5.54, p = .019, partial η2 = .03, generalized η2 = .0003). However, although the reductions in EWS and bisection response time are broadly parallel, there was no significant correlation in the change scores between EWS and bisection response time, either across half-blocks (r = .01, 95% CIs −.12 to .14) or sessions (r = −.09, 95% CIs −.22 to .04).
Efficiency of measures of bisection bias
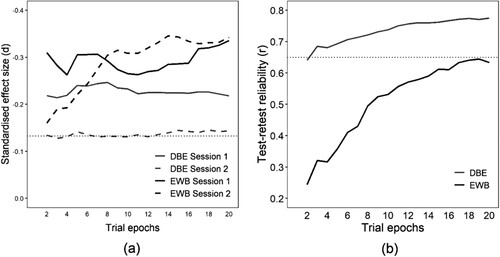
As a final exploratory step, we investigated sensitivity to pseudoneglect, and test-retest reliability, as a function of the number of trials completed. DBE and EWB were recalculated according to the methods already established, but with the analysis restricted to different numbers of sequential trial epochs (2-20). Each trial epoch comprises four trials, within which each bisection stimulus appears once; so two epochs is the first eight bisection trials, and 20 epochs is all 80 trials. We might expect the estimate of bisection bias per participant to become more stable with more epochs, and more stable estimates should reduce between-participant variability, potentially increasing the standardized effect size and enhancing reliability.
a shows the standardized effect size (d) for pseudoneglect in both sessions, and b shows the test-retest reliability across sessions, as a function of the number of epochs. EWB is much more affected by number of epochs than is DBE, both in terms of standardized effect size (dotted black line in a) and test-retest reliability (b). This may be because EWB is a higher-order measure, estimated from the slope coefficients of a linear model fitted across stimuli, whereas DBE is a simple first-order aggregate, and the higher-order measure requires more observations for stable estimation.
Figure 4. (a) Standardized effect size of pseudoneglect for each session for DBE and EWB, as a function of the number of trial epochs from which they are estimated. The dotted horizontal line represents the critical effect size for significance at the conventional level (p < .05), assuming a sample size of 222 (the lowest number of participants with valid bisection data for any of these analyses). (b) Test-retest reliability (r) of DBE and EWB as a function of the number of epochs from which they are estimated. The dotted horizontal line is at .65, a nominal threshold for practically useful reliability (Parker et al., Citation2021).
Discussion
In this study, we showed that it is feasible to administer line bisection and landmark tasks online, with around 90% of participants in either task producing valid responses according to our data exclusion criteria. The online implementation of these tasks facilitates larger-scale data collection, and the sample size for the present study (n = 253) was around five times that of the largest previous lab-based study that analysed the test-retest reliability of bisection-based measures of pseudoneglect (Learmonth et al., Citation2015). Our analysis focused upon the line bisection task, because the landmark task was compromised by a surprisingly low-level of compliance with instructions. Overall, 22% of valid psychophysical functions for the landmark task were reversed, indicating that participants were making the judgement opposite to the one instructed. This suggests that the response instruction needs to be repeated regularly, rather than just given at the start of the task. The data from the landmark task are presented and discussed in Supplementary Material, and we now focus instead on the line bisection task, which showed the expected pattern of pseudoneglect.
Measures of line bisection bias (DBE and EWB)
One of our main aims was to compare the traditional measure of line bisection bias (DBE) with an alternative measure (EWB) from an endpoint weightings analysis. The outcomes were curiously mixed. On the one hand, EWB outperformed DBE in detecting pseudoneglect, giving a stable group estimate with raw and standardized effects sizes nearly identical across sessions (EWB = −0.01 and d = 0.34 in both sessions; see ). For DBE, pseudoneglect was weaker in both sessions (d = 0.22 and d = 0.14 in Sessions 1 and 2 respectively). On the other hand, EWB did less well than DBE in terms of test-retest reliability (r = .63 vs. .77), falling just short of the .65 criterion level suggested for a measure to be practically useful for investigating individual differences (Parker et al., Citation2021). A central conundrum of our results is how EWB can be more sensitive than DBE to pseudoneglect, yet less reliable between sessions.
In considering this conundrum, it is important to understand the nature of the relation between DBE and EWB. Within our endpoint weightings analysis, the bisection response is not coded relative to the centre of the line, but as a position (P) in the workspace, relative to the horizontal midline of the screen. This means that P is equal to DBE for any line that is centred on the screen (and, if the set of stimulus lines is symmetrical around the screen centre, then the mean P will be equal to the mean DBE). The endpoint weighting analysis fits a linear model to relate P to the left and right endpoint positions (L and R) (Equation 1, Methods). For centred lines that vary only in length, L and R will always have the same magnitude, being the half-length of the line, and DBE will be given by:
(4)
(4) EWB is thus equal to the slope of the linear relationship between bisection error (DBE) and stimulus half-length within a traditional bisection framework; or alternatively, EWB is twice the slope of the relationship between bisection error and line length (see Figure 7 of McIntosh et al., Citation2005, for a graphical illustration). A negative EWB means that DBE becomes more leftward for longer lines, but the DBE obtained for any given line length depends also on intercept k.Footnote4 The greater sensitivity of EWB to pseudoneglect implies that the tendency for neurotypical participants to make more leftward errors for longer lines is more consistent than their tendency to make leftward bisection errors per se. This is essentially a restatement of the well-established pattern that a leftward DBE is more likely for longer stimulus lines (e.g., Jewell & McCourt, Citation2000). We can see from Equation (4) that this pattern arises because longer lines will increase the relative influence of a consistently leftward component (EWB) over a less consistently leftward component (k).
These considerations are also relevant to the second side of our conundrum, that EWB has lower test-retest reliability than DBE. Whereas EWB is one component of bisection behaviour, DBE is additionally determined by a second component (k), and the (weighted) combination of these two components (Equation 4) may capture more idiosyncratic variability in performance to drive test-retest reliability. We could liken this to the difference between a metallic element and an alloy: if EWB is the elemental leftward component of pseudoneglect, then DBE is an alloy that mixes it with a small amount of k, making it less pure but more stable. If we want a robust, standardized measure of pseudoneglect, which has a clean theoretical interpretation as an asymmetry of attention, then we should choose EWB. If, for practical purposes, we want higher test-retest reliability, then DBE may be the better choice. The disparity in reliability between measures diminishes as we approach 80 trials, although the ceiling for reliability of EWB in our online task is around .65. It is possible that the reliability of EWB would be improved under better-controlled testing conditions.
When comparing the psychometric properties of EWB and DBE, it is important to bear in mind a fundamental difference between these two measures. DBE will differ depending upon the particular stimulus lines used, for instance their length or spatial position; by contrast, EWB is a higher-order measure that is independent of the particular stimulus set. Therefore, whilst it may be possible to make general statements about the properties of EWB, the properties of DBE will always be contingent on the particular lines presented. Broadly, the properties of DBE will become more similar to those of EWB if longer stimulus lines are used. This follows from Equation (4), in which the influence of EWB is weighted by the line half-length. In the present study, the stimulus set included a 100 mm line and a 200 mm line presented centrally (lines A and D in a). If we consider DBE for the 100 mm line alone, the sensitivity to pseudoneglect is very poor (Session 1: −0.18 mm, SD 1.34, d = −0.14; Session 2: −0.10 mm, SD 1.41, d = −0.07); but for the 200 mm line, it is considerably improved (Session 1: −0.82 mm, SD 2.46, d = −0.33; Session 2: −0.73 mm, SD 2.58, d = −0.28), and beginning to approach the effect size observed using EWB (d = −0.34 in both sessions). So, to maximize the sensitivity of DBE to pseudoneglect, one could selectively present long stimulus lines, but note that this would also tend to result in the test-retest reliability becoming more similar to that of EWB.
Endpoint weightings sum (EWS)
The endpoint weightings analysis additionally allows for the extraction of EWS, a potential measure of total attentional engagement. Our exploratory analyses of EWS are consistent with this characterization, in that this measure was reduced between the first and second half –blocks of each session (a). One previous study that applied an endpoint weightings analysis to neurotypical young adults, noted a similar reduction in EWS across the course of an extended test session (McIntosh et al., Citation2019, Experiment 2). However, although this within-session effect might be ascribed to a reduction in attention or arousal with time-on-task, there was also a cross-session reduction that would not be explicable in this way. Instead, the cross-session reduction in EWS could suggest that familiarity and repetition also lead to reduced engagement. This is supported circumstantially by a broadly parallel reduction in bisection response time within and across sessions (b). However, the changes in EWS and trial duration did not correlate across participants, and the present interpretation remains speculative. To more convincingly validate EWS as a non-lateralized measure of attentional resources, experimental evidence from explicit manipulation of arousal/attention may be required.
Further considerations and conclusions
EWB is a more pure and sensitive measure of pseudoneglect than is DBE, mirroring its sensitivity to neglect in patients with right hemisphere stroke (McIntosh et al., Citation2005, Citation2017). Counterintuitively, the relative purity of EWB may make it less reliable across time than DBE, because DBE taps into an additional source of individual difference (k). However, there may be further reasons to prefer an endpoint weightings analysis of line bisection, over and above its greater sensitivity to spatial bias. One such reason is that EWB is inherently a standardized, proportional measure, which is independent of the particular lines presented and so directly comparable across studies. By contrast, as noted earlier, DBE is contingent on the length (and position) of the particular lines used. Sometimes, researchers seek to standardize DBE by expressing it as a proportion of the line half-length, a step introduced by Schenkenberg et al. (Citation1980). Equation (4) shows that this would only be fully effective if intercept k were equal to zero, in which case the standardized DBE would be identical with EWB.
Some might find the proportional units of EWB to be less concrete or intuitive than DBE, which is expressed in mm. This concern may dissipate with increased experience of using EWB; but if it we did wish to convert EWB into units of distance, then a simple step would be to multiply it by 100. This would convert a proportion to a percentage, so the standardized interpretation would not be lost, but it would also be interpretable as the change in bisection position for a 200 mm increase in line length (Equation 4). The mean EWB of −0.01 in the present experiment is equivalent to a leftward shift of 1 mm on a 200 mm line. This (perhaps) gives a more concrete sense of the scale of the bias that EWB measures in neurotypical participants. In patients with severe neglect, values of EWB as high as 0.9 have been observed (McIntosh et al., Citation2005), equivalent to a rightward bias of 90 mm on a 200 mm line.
A further benefit of the endpoint weightings method is that it allows for robust data quality checks, via the fit of the endpoints regression at the participant level. In the present study, this enabled the exclusion of participants whose responses were insufficiently related to the stimuli, indicating a lack of meaningful task engagement. Specifically, we excluded participants with r2 less than .7, or who had clearly implausible endpoint weightings. These participants were clicking quasi-randomly, or always in the same position regardless of the line presented. These disengaged participants made up 10% of the sample, but all bar one of them (0.3% of the sample) had plausible average DBEs, because they tended to respond close to the screen centre. This data-hygiene benefit provides another incentive to adopt an endpoint weightings design, particularly for online administration, even if the analysis will focus on DBE.
The present study indicates that it is feasible to administer line bisection and landmark tasks online, but modifications to our version of the landmark task would be necessary to make it fit for purpose. Line bisection performed online does provide a valid assessment of pseudoneglect, but different measures of bias can be obtained from the task, depending upon whether a traditional or an endpoint weightings analysis is applied. The former may allow higher test-retest reliability, but the latter is more sensitive to pseudoneglect. The endpoint weightings method has several further advantages over the traditional approach, including the option of a non-lateralized measure of general attention, albeit this measure requires further validation. However, the two approaches are not mutually exclusive, and both analyses can be applied, provided only that the left and right endpoints of the stimulus lines have been manipulated independently, enabling the extraction of endpoint weightings. We recommend that this simple design contingency should become standard practice for the line bisection task, whether administered online or otherwise.
Disclosure statement
No potential conflict of interest was reported by the author(s).
Correction Statement
This article has been republished with minor changes. These changes do not impact the academic content of the article.
Notes
2 The tenth item (opening a box lid) was omitted due to a coding error. This did not affect our calculation of LQ, which was based on the four items of the short-form version (writing, throwing, toothbrush, spoon) (Veale, Citation2014).
3 Correction for multiple comparisons is not necessary here, because the separate hypothesis tested for each measure (that it is a valid measure of pseudoneglect), is supported only if a significant result is obtained in both sessions. There are thus three separate hypotheses, each of which depends upon a conjunction of two outcomes, for which multiple correction is inappropriate (Rubin, Citation2021).
4 Theoretically, constant intercept k is the predicted response position for a line of zero extent. We did not present any formal analyses of k in the Results section, but k was positive on average (mean k in Session 1 = 0.56 mm, SD 2.32; mean k in Session 2 = 0.68 mm, SD 2.21).
References
- Bowers, D., & Heilman, K. M. (1980). Pseudoneglect: Effects of hemispace on a tactile line bisection task. Neuropsychologia, 18(4–5), 491–498.
- Chokron, S., & De Agostini, M. (1995). Reading habits and line bisection: A developmental approach. Cognitive Brain Research, 3(1), 51–58. https://doi.org/10.1016/0926-6410(95)00018-6
- Chokron, S., & Imbert, M. (1993). Influence of reading habits on line bisection. Cognitive Brain Research, 1(4), 219–222. https://doi.org/10.1016/0926-6410(93)90005-P
- Dellatolas, G., Vanluchene, J., & Coutin, T. (1996). Visual and motor components in simple line bisection: An investigation in normal adults. Cognitive Brain Research, 4(1), 49–56. https://doi.org/10.1016/0926-6410(96)00019-5
- Heilman, K. M., & Valenstein, E. (1979). Mechanisms underlying hemispatial neglect. Annals of Neurology, 5(2), 166–170. https://doi.org/10.1002/ana.410050210
- Husain, M., & Rorden, C. (2003). Non-spatially lateralized mechanisms in hemispatial neglect. Nature Reviews Neuroscience, 4(1), 26–36. https://doi.org/10.1038/nrn1005
- Jewell, G., & McCourt, M. E. (2000). Pseudoneglect: A review and meta-analysis of performance factors in line bisection tasks. Neuropsychologia, 38(1), 93–110. https://doi.org/10.1016/S0028-3932(99)00045-7
- Learmonth, G., Gallagher, A., Gibson, J., Thut, G., & Harvey, M. (2015). Intra- and inter-task reliability of spatial attention measures in pseudoneglect. PLOS ONE, 10(9), e0138379. https://doi.org/10.1371/journal.pone.0138379
- Luh, K. E. (1995). Line bisection and perceptual asymmetries in normal individuals: What you see is not what you get. Neuropsychology, 9(4), 435–448. https://doi.org/10.1037/0894-4105.9.4.435
- Marshall, J. C., & Halligan, P. W. (1990). Line bisection in a case of visual neglect: Psychophysical studies with implications for theory. Cognitive Neuropsychology, 7(2), 107–130. https://doi.org/10.1080/02643299008253438
- McCourt, M. E. (2001). Performance consistency of normal observers in forced-choice tachistoscopic visual line bisection. Neuropsychologia, 39(10), 1065–1076. https://doi.org/10.1016/S0028-3932(01)00044-6
- McCourt, M. E., Freeman, P., Tahmahkera-Stevens, C., & Chaussee, M. (2001). The influence of unimanual response on pseudoneglect magnitude. Brain and Cognition, 45(1), 52–63. https://doi.org/10.1006/brcg.2000.1255
- McCourt, M. E., & Garlinghouse, M. (2000). Asymmetries of visuospatial attention are modulated by viewing distance and visual field elevation: Pseudoneglect in peripersonal and extrapersonal space. Cortex, 36(5), 715–731. https://doi.org/10.1016/S0010-9452(08)70548-3
- McCourt, M. E., Garlinghouse, M., & Slater, J. (2000). Centripetal versus centrifugal bias in visual line bisection focusing attention on two hypotheses. Frontiers in Bioscience, 5, D58–D71. https://doi.org/10.2741/A496
- McCourt, M. E., & Jewell, G. (1999). Visuospatial attention in line bisection: Stimulusmodulation of pseudoneglect. Neuropsychologia, 37(7), 843–855. https://doi.org/10.1016/S0028-3932(98)00140-7
- McCourt, M. E., & Olafson, C. (1997). Cognitive and perceptual influences on visual line bisection: Psychophysical and chronometric analyses of pseudoneglect. Neuropsychologia, 35(3), 369–380. https://doi.org/10.1016/S0028-3932(96)00143-1
- McIntosh, R. D. (2006). The eyes have it: Oculomotor exploration and line bisection in neglect. Cortex, 42(5), 692–698. https://doi.org/10.1016/S0010-9452(08)70406-4
- McIntosh, R. D. (2018). The end of the line: Antagonistic attentional weightings in unilateral neglect. Cortex, 107, 220–228. https://doi.org/10.1016/j.cortex.2017.07.011
- McIntosh, R. D., Brown, B. M. A., & Young, L. (2019). Meta-analysis of the visuospatial aftereffects of prism adaptation, with two novel experiments. Cortex, 111, 256–273. https://doi.org/10.1016/j.cortex.2018.11.013
- McIntosh, R. D., Ietswaart, M., & Milner, A. D. (2017). Weight and see: Line bisection in neglect reliably measures the allocation of attention, but not the perception of length. Neuropsychologia, 106, 146–158. https://doi.org/10.1016/j.neuropsychologia.2017.09.014
- McIntosh, R. D., Schindler, I., Birchall, D., & Milner, A. D. (2005). Weights and measures: A new look at bisection behaviour in neglect. Cognitive Brain Research, 25(3), 833–850. https://doi.org/10.1016/j.cogbrainres.2005.09.008
- Milner, A. D., Brechmann, M., & Pagliarini, L. (1992). To halve and to halve not: An analysis of line bisection judgements in normal subjects. Neuropsychologia, 30(6), 515–526. https://doi.org/10.1016/0028-3932(92)90055-Q
- Mitchell, A. G., Harris, J. M., Benstock, S. E., & Ales, J. M. (2020). The reliability of pseudoneglect is task dependent. Neuropsychologia, 148, 107618. https://doi.org/10.1016/j.neuropsychologia.2020.107618
- Morey, R. D. (2008). Confidence intervals from normalized data: A correction to cousineau (2005). Tutorials in Quantitative Methods for Psychology, 4(2), 61–64. https://doi.org/10.20982/tqmp.04.2.p061
- Muayqil, T. A., Al-Yousef, L. M., Al-Herbish, M. J., Al-Nafisah, M., Halawani, L. M., Al-Bader, S. S., … Alanazy, M. H. (2021). Culturally influenced performance on tasks of line bisection and symbol cancellation in arabs. Applied Neuropsychology: Adult, 28(3), 257–268. https://doi.org/10.1080/23279095.2019.1627359
- Nicholls, M. E., & Roberts, G. R. (2002). Can free-viewing perceptual asymmetries be explained by scanning, pre-motor or attentional biases?. Cortex, 38(2), 113–136.
- Oldfield, R. C. (1971). The assessment and analysis of handedness: The Edinburgh inventory. Neuropsychologia, 9(1), 97–113. https://doi.org/10.1016/0028-3932(71)90067-4
- Parker, A. J., Woodhead, Z. V. J., Thompson, P. A., & Bishop, D. V. M. (2021). Assessing the reliability of an online behavioural laterality battery: A pre-registered study. Laterality, 26(4), 359–397. https://doi.org/10.1080/1357650X.2020.1859526
- Rinaldi, L., Di Luca, S., Henik, A., & Girelli, L. (2014). Reading direction shifts visuospatial attention: An interactive account of attentional biases. Acta Psychologica, 151, 98–105. https://doi.org/10.1016/j.actpsy.2014.05.018
- Robertson, I. H. (1993). The relationship between lateralised and non-lateralised attentional deficits in unilateral neglect. In Unilateral neglect: Clinical and experimental studies (pp. 257–275). Hove (UK), Hillsdale (USA): Lawrence Erlbaum Associates, Inc.
- Rubin, M. (2021). When to adjust alpha during multiple testing: A consideration of disjunction, conjunction, and individual testing. Synthese, 199(3–4), 10969–11000. https://doi.org/10.1007/s11229-021-03276-4
- Schenkenberg, T., Bradford, D. C., & Ajax, E. T. (1980). Line bisection and unilateral visual neglect in patients with neurologic impairment. Neurology, 30(5), 509–509. https://doi.org/10.1212/WNL.30.5.509
- Schönbrodt, F. D., & Perugini, M. (2013). At what sample size do correlations stabilize? Journal of Research in Personality, 47(5), 609–612. https://doi.org/10.1016/j.jrp.2013.05.009
- Thomas, N. A., Loetscher, T., & Nicholls, M. E. R. (2012). Central fixations with rightward deviations: Saccadic eye movements on the landmark task. Experimental Brain Research, 220(1), 29–39. https://doi.org/10.1007/s00221-012-3113-9
- Varnava, A., Dervinis, M., & Chambers, C. D. (2013). The predictive nature of pseudoneglect for visual neglect: Evidence from parietal theta burst stimulation. PLOS ONE, 8(6), e65851. https://doi.org/10.1371/journal.pone.0065851
- Veale, J. F. (2014). Edinburgh handedness inventory – Short form: A revised version based on confirmatory factor analysis. Laterality: Asymmetries of Body, Brain and Cognition, 19(2), 164–177. https://doi.org/10.1080/1357650X.2013.783045