
ABSTRACT
The main objective of the image enhancement is to process an image with suitable technique to produce better visibility for a specific application. To identify key features like transition temperatures, clear phase identification in the liquid crystalline images, we require some novel image processing techniques. Characterisation and mesomorphic behaviour in pure and 1% ZnO nano-dispersed liquid crystalline N-(p-n-decyloxybenzylidene)-p-n-hexyloxy anilines, 10O.O6 compounds are carried out using a polarising microscope and images are preserved for enhancement. Both the compounds exhibits NACIG (nematic, smectic-A, smectic-C, smectic-I, smectic-G) phases and the transition temperatures of the 1% ZnO nano-dispersed 10O.O6 are reduced compared with pure 10O.O6. Further, in this paper, a novel image enhancement technique of combined unsharp masking is proposed on pure and 1% ZnO nano-dispersed 10O.O6 liquid crystalline compounds for better visibility of phases at transition temperatures. The proposed method is used to identify the uniform regions and to detect the defects which may not be clearly observed from the textures that are recorded by polarising microscope.
1. Introduction
Liquid crystals (LCs) are soft condensed matter and nowadays play a wide role in various branches of technology such as optical switches, mobile phones, smart cards, and information and integrated display devices. [Citation1]. So, the identification and characterisation of these mesophases will provide a very important information on the pattern and texture of different phases like nematic, smectic and cholesteric. Suspensions of various nanoparticles to LCs recently gained momentum because they combine the fluidity and anisotropy of LCs with specific properties of particles that strongly affect the dielectric properties of the system.
Contrast enhancement is one of the requirements to visualise and understand the microscopic image content [Citation2–Citation12]. LCD crystal microscopic imaging has been around for some time now. Microscopic images of LCD palettes allow researchers to study and analyse the internal patterns during nano-doping. The primary disadvantage of microscopic imaging is the absence of ambient light of the order 6000 lumens while capturing the image. This was handled at our laboratory by placing an incandescent bulb of 300 lumens, which is far below the light required for producing good contrast images. However, photographing with high-lumen light bulbs will make the images look whitish and hence lost details. Therefore, image processing algorithms were adapted to enhance the quality of the images captured under low-light conditions on a microscope [Citation13]. Contrast enhancement is a major area of research for the past few decades. Recent advancements in computer algorithms prompted researches to explore new and improved contrast enhancement algorithms for low-contrast images without altering the feel of the image [Citation14]. Adaptive histogram equalisation (AHE) is the most common contrast enhancement used in many image processing applications. But for very-low-contrast images having colour content and high texture content, the AHE resulting images hide most of the information. In this research, we propose a method of unsharp masking for enhancing contrast by preserving colour and texture of the microscopic images.
Generally, two types of algorithms are extensively developed for contrast enchantment of images. Type I deals with the process of enhancing the pixels in spatial domain [Citation15] and Type II concentrates by transformed pixels in frequency domain [Citation16]. Type I, spatial domain enhancement is most widely used for contrast enhancement of digital images. The powerful technique used in many applications is global histogram equalisation (GHE) [Citation17]. GHE distributes the pixel intensities according to a uniform distributer taking in a non-uniform distribution of pixels. The technique uses full range of pixels and at times tends to produce noisy images. Hence, AHE is proposed to improve on the drawback of GHE. AHE [Citation18,Citation19] uses a window of pixels on which the histogram equalisation (HE) is applied. These adaptive algorithms do enhance the image progressively well compared to GHE, but the results need to be post-processed to remove blocking artefacts that are caused by inconsistent variations between blocks of enhanced pixels. Type II contrast enhancement operates on sub-bands of frequency coefficients of pixels to modify globally and locally the desired frequency components [Citation20,Citation21]. These algorithms are complex to execute and require additional steps to reorganise the sub-bands for inverse transformation. The process of transformation degrades the image.
2. Methodology
2.1. Liquid crystal and synthesis
The present compound 10O.O6 is synthesised following the established procedure given in [Citation22]. The corresponding ingredients are imported from Sigma-Aldrich Laboratories (Sigma-Aldrich Chemicals Limited, Bangalore, India). The purity of the compounds is about 99%; ZnO nanoparticles are also procured from Sigma-Aldrich Laboratories and used without any further purification. For uniform dispersion of ZnO nanoparticles into N-(p-n-decyloxybenzylidene)-p-n-hexyloxy aniline, 10O.O6, LC compound, the nanoparticles are first dissolved in ethyl alcohol, stirred well about 45 min and later introduced in the isotropic state of a mesogenic material in the ratio of 1 wt%. After cooling, the nano-dispersed 10O.O6 compound is subjected to study the textural and phase transition temperatures using polarising optical microscope with the hot stage in which the substance (sandwiched between a glass plate and coverslip) can be placed along with the thermometer. The cells used in this study possess 4-µm thickness and the alignment used is planar. Textural and phase transition temperatures are studied after preparation of the sample and observations are made again to understand the stability of ZnO nanoparticles. Differential scanning calorimeter (DSC; Perkin Elmer Diamond DSC; Perkin Elmer Instruments, Shelton, CT, USA) is used to obtain the transition temperatures and the enthalpy values given in . This DSC can be used for exothermic as well as endothermic regime. The image processing programme was coded in MATLAB tool for computational analysis.
Table 1. Phase variants, transition temperatures and enthalpy values of 10O.O6 pure and 1% ZnO nano-dispersed compounds.
2.2. Procedure for image processing
Unsharp masking is a filter-based approach. From the image, an unsharp mask is constructed by subtracting the original image from the filtered image. The filter generates a low-pass image. The mask contains the local brightness variations of the image. The original image is contrast enhanced with AHE. Using the weighted addition approach, a set of three images, that is, the local brightness mask, the original image and histogram equalised image, is added in proportions to create a high-contrast colour image. This method prevents the edges, colour and texture information of the image for better image analysis.
Depending on the width of the filter kernels, different properties are induced. For small kernels, there is an increase in sharpness resulting in almost no contrast enhancement to the original image. Large kernels impose blur, but alter the appearance of contrast in a large extent. The proposed method is demonstrated in .
Figure 1. Proposed unsharp masking technique for contrast enhancement of LCD microscopic images. (a) original image, (b) filtered image, (c) contrast mask, (d) histogram equalised image and (e) contrast-enhanced image with weighted HE combined unsharp masking.
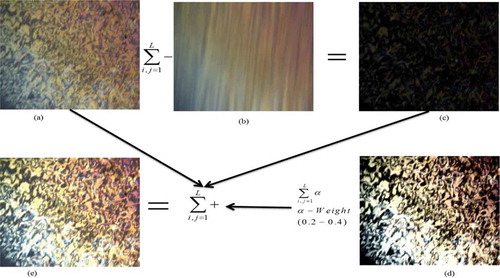
The weight of pixels used from histogram equalised image is around 0.2–0.4 depending on the distribution of darkness in the original image. If the distribution of darkness is more, the weight parameter is upscaled and vice versa. The darkness parameter is computed by summing the values of pixels in the original image and dividing it with maximum value of brightness in the original image.
The images which we collected from polarising microscopy may not produce high-contrast and high-quality images because of different reasons like non-informality of LC sample over glass plate, thickness variation, low-quality camera and improper placement of lenses. The proposed method will do the enhancement of image quality with unsharp masking technique, through which we can identify the phase transitions in a better way with crystal clear quality.
3. Results and discussion
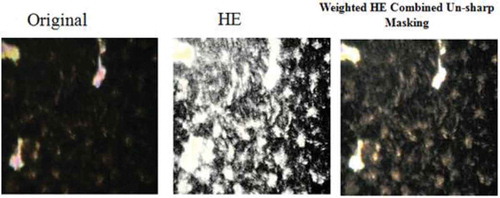
The weight vector for most of the liquid crystalline images is around 0.2–0.4. shows the proposed method compared with AHE method. From the below results, it can be noticed that weighted HE combined with unsharp masking produces high-contrast images compared with AHE. The images are also tested with unsharp masking-based contrast enhancement, which produced artefacts on colour images in the darker portions of the image. By combining unsharp masking with HE, these artefacts are eliminated and clear, coloured texture preserving contrast enhancement is achieved.
Figure 2. Isotropic-nematic transition in 10O.O6 pure compound at 110.3°C.
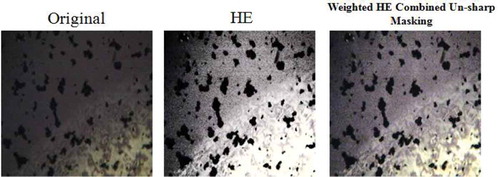
– show the resultant enhanced images of pure 10O.O6 compound with HE and using proposed combined unsharp masking technique at transition temperatures. – show the images of 1% ZnO nano-dispersed 10O.O6 compound at transition temperatures.
Figure 3. Nematic-smectic-A transition in 10O.O6 pure compound at 105.6°C.
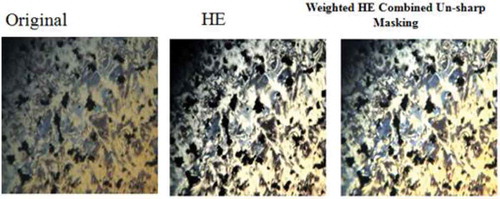
Figure 4. Smectic-A–smectic-C transition in 10O.O6 pure compound at 94°C.
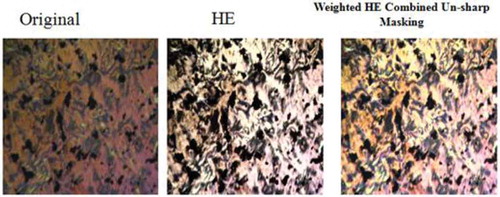
Figure 5. Smectic-C–smectic-I transition in 10O.O6 pure compound at 89°C.
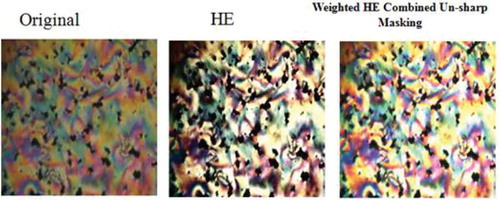
Figure 6. Smectic-I–smectic-G transition in 10O.O6 pure compound at 84.2°C.
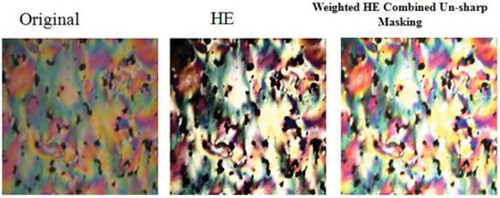
Figure 7. smectic-G-solid transition in 10O.O6 pure compound at 74.1°C.
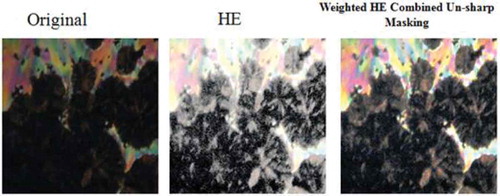
Figure 8. Nematic transition in 1% ZnO nano-dispersed 10O.O6 compound at 109.5°C.
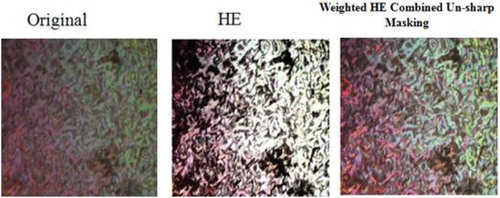
Figure 9. Nematic-smectic-A in 1% ZnO nano-dispersed 10O.O6 compound at 104.5°C.
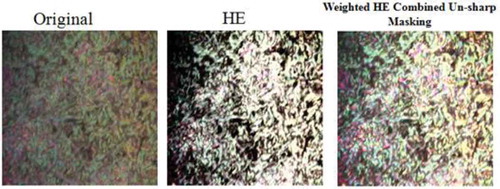
Figure 10. Smectic-A–smectic-C in 1% ZnO nano-dispersed 10O.O6 compound at 93.3°C.
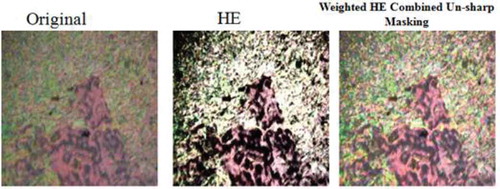
Figure 11. Smectic-C–smectic-I in 1% ZnO nano-dispersed 10O.O6 compound at 91.5°C.
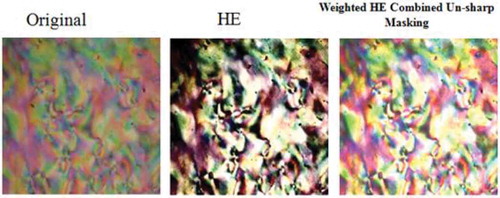
Figure 12. Solid phase in 1% ZnO nano-dispersed 10O.O6 compound at 74°C.
3.1. Experimental results
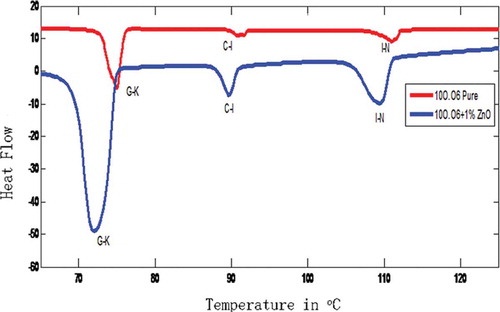
shows the DSC curve of proposed pure and 1% ZnO nano-dispersed 10O.O6 compounds. The transition temperatures of the pure and nano-dispersed compound can be observed from DSC curve and shows the enthalpy values for both the cases.
Figure 13. DSC curve for 10O.O6 pure and 10O.O6 + 1% ZnO compounds.
4. Conclusion
Unsharp masking technique is proposed in this paper to enhance the image quality of pure and 1% ZnO nano-dispersed liquid crystalline compound 10O.O6. It has been noticed that weighted HE combined with unsharp masking produces high-contrast images compared with HE. The proposed method holding combination of the local brightness mask, original image and histogram equalised image in proper proportions to create a high-contrast colour image.
Acknowledgements
The authors like to express their gratitude towards the Department of ECE and the management of K L University for their support and encouragement during this work. One of the author RKNR Manepalli thanks the management of The Hindu College for giving support during the work.
Disclosure statement
No potential conflict of interest was reported by the authors.
Additional information
Funding
References
- Priestley EB, Wojtowicz PJ, Sheng P. Introduction to liquid crystals. Princeton (NJ): RCA Laboratories; 1974.
- Madhav BTP, Pardhasaradhi P, Manepalli RKNR, et al. Homomorphic filtering textural analysis technique to reduce multiplicative noise in the 11Oba nano-doped liquid crystalline compounds. Phase Transit. 2015;88(7):735–744. DOI:10.1080/01411594.2015.1025781
- Madhav BTP, Pardhasaradhi P, Manepalli RKNR, et al. Histogram equalisation technique to analyse induced cholesteric phase in nanodoped liquid crystalline compound. Liq Cryst. 2015;42(7):989–997. DOI:10.1080/02678292.2015.1012752
- Madhav BTP, Pardhasaradhi P, Manepalli RKNR, et al. Image enhancement using virtual contrast image fusion on Fe3O4 and ZnO nanodispersed decyloxy benzoic acid. Liq Cryst. 2015;42:1329–1336. DOI:10.1080/02678292.2015.1050704
- Madhav BTP, Gopala Rao MV, Pisipati VGKM. Multispectral correlations technique for finding phase transition temperatures in 7O.Om series. Liq Cryst Today. 2015;24(2):38–46. DOI:10.1080/1358314X.2014.1001614
- Rambabu M, Prasad KRS, Venu Gopala Rao M, et al. Thermal and phase behaviour studies of hydrogen-bonded compounds (SA:nOBA) using POM, DSC and image-processing techniques. Liq Cryst Today. 2015;24(3):81–92. DOI:10.1080/1358314X.2015.1039195
- Madhav BTP, Gopala Rao MV, Pisipati VGKM. Identification of liquid crystalline phases in 7O.O9 compound based on structural similarity index measure. Liq Cryst. 2015;42(2):198–203. DOI:10.1080/02678292.2014.975290
- Pardhasaradhi P, Madhav BTP, Gopala Rao MV, et al. Gradient measurement technique to identify phase transitions in nano dispersed liquid crystalline compounds. Phasetransitions. 2015. DOI:10.1080/01411594.2015.1091074
- Sastry SS, Mallika K, Vishwam T, et al. Image analysis method to study electro-optic parameters of nematogens. Liq Cryst. 2014;41:558–571. DOI:10.1080/02678292.2013.865798
- Sreeramakavacham SS, Rao BGS, Mallika K, et al. Novel method for order parameter of ferroelectric liquid crystals by image analysis. Liq Cryst. 2013;40:384–390. DOI:10.1080/02678292.2012.754960
- Sreehari Sastry S, Mallika K, Gouri Shankara Rao B, et al. Identification of phase transition temperatures by statistical image analysis. Liq Cryst. 2012;39:695–700. DOI:10.1080/02678292.2012.672661
- Sreehari Sastry S, Mallika K, Gouri Shankara Rao B, et al. Liquid crystal textural analysis based on histogram homogeneity and peak detection algorithm. Liq Cryst. 2012;39:415–418. DOI:10.1080/02678292.2011.652198
- Daniel E, Anitha J. Optimum green plane masking for the contrast enhancement of retinal images using enhanced genetic algorithm. Optik Int J Light Electron Opt. 2015 Sep;126(18):1726–1730. ISSN 0030-4026. DOI:10.1016/j.ijleo.2015.05.027
- Song J, Zhao Z, Wang J, et al. Evaluation of contrast enhancement by carbon nanotubes for microwave-induced thermoacoustic tomography. IEEE Trans Biomed Eng. 2015 Mar;62(3):930–938. DOI:10.1109/TBME.2014.2373397
- Celik T. Spatial entropy-based global and local image contrast enhancement. IEEE Trans Image Process. 2014 Dec;23(12):5298–5308. DOI:10.1109/TIP.2014.2364537
- Mukherjee J, Mitra SK. Enhancement of color images by scaling the DCT coefficients. IEEE Trans Image Process. 2008 Oct;17(10):1783–1794. DOI:10.1109/TIP.2008.2002826
- Sengee N, Sengee A, Choi H-K. Image contrast enhancement using bi-histogram equalization with neighborhood metrics. IEEE Trans Consum Electron. 2010 Nov;56(4):2727–2734. DOI:10.1109/TCE.2010.5681162
- Santhi K, WahidaBanu RSD. Adaptive contrast enhancement using modified histogram equalization. Optik Int J Light Electron Opt. 2015 May 14;126:1809–1814. ISSN 0030-4026. DOI:10.1016/j.ijleo.2015.05.023
- Lee C, Kim J-H, Lee C, et al. Optimized brightness compensation and contrast enhancement for transmissive liquid crystal displays. IEEE Trans Circ Syst Video Technol. 2014 Apr;24(4):576–590. DOI:10.1109/TCSVT.2013.2276154
- Kishore PVV, Rajesh Kumar P. A model for real time sign language recognition system. Int J Adv Res Comput Sci Softw Eng. 2012 Jun;2(6):29–35. ISSN 2277-6451.
- Kishore PVV, Rajesh Kumar P. Segment, track, extract, recognize and convert sign language videos to voice/text. Int J Adv Comput Sci Appl. 2012 Jun;3(6). ISSN (Print)-2156 5570. DOI:10.14569/IJACSA.2012.030608
- Godzwon J, Sienkowska MJ, Galewski Z. Smectic polymorphism of 4-decyloxybenzylidene-4ʹ-alkyloxyanilines and their mixtures with polar standards of mesophases. Phase Transit. 2007;80:217–229. DOI:10.1080/01411590601111371