
 ?Mathematical formulae have been encoded as MathML and are displayed in this HTML version using MathJax in order to improve their display. Uncheck the box to turn MathJax off. This feature requires Javascript. Click on a formula to zoom.
ABSTRACT
Very fast full vehicle simulations through the use of effective, but drastically simplified digital models is a topic of great interest to automotive manufacturers and research communities. A non-conventional modelling and simulation approach using the macro-element methodology, embedded in Visual Crash Studio (VCS), is assessed. Modelling practices for converting finite element models to macro-element models are developed and presented. A large number of automotive systems, ranging from components and sub-systems to full vehicle models, is investigated. Numerical results obtained from VCS and the finite element code LS-DYNA compared moderately in the majority of the cases. The accuracy and efficiency of the macro-element methodology for vehicle crashworthiness analysis as well as the necessity for model corrections are discussed. Through improved functionality and accuracy, the macro-element methodology could potentially enable engineers to evaluate multiple conceptual designs in shorter times and revolutionise the vehicle development phase.
1. Introduction
Vehicle crash safety regulations and tests are continuously evolving to resemble real-world crash circumstances and reduce fatalities and severe injuries (e.g. new NHTSA roof strength regulation, IIHS small overlap frontal test). More than ever, automotive manufacturers are working towards increasing the safety rating of their vehicles according to assessment protocols for different markets (e.g. US-NCAP, Euro-NCAP, C-NCAP) without compromising their unique brand aesthetics. The number and variety of safety tests are imposing a significant burden to vehicle manufacturers, who nowadays rely heavily on virtual engineering modelling and simulation techniques to accelerate their product design and development phase.
In order to meet the regulatory requirements and internal performance targets, manufacturers are investigating a number of designs during the concept selection and development phase. This number is subject to given time and resources constraints, inhibiting product innovation. In addition, each design investigation is lengthy as it usually requires the preparation of CAD models, the creation and assessment of a finite element model for each load case/physical test. Therefore, of great business interest is the delivery of very fast whole body structure simulations using non-conventional approaches and models.
The most common modelling methodologies for crashworthiness vehicle design used across the virtual product development cycle can be split into four categories, namely, (1) lumped mass-spring (LMS) systems and equivalent mechanisms, (2) collapsible beams, (3) multi-body systems (with rigid and flexible bodies) and (4) finite element models (hybrid, reduced-order, sub-models and detailed).
In 1970, one-dimensional LMS models were introduced by Kamal [Citation15] to approximate vehicle performance in front crash scenarios. Despite the recent advancements in digital modelling, more sophisticated LMS models with non-linear springs and contacts are still used by researchers and crash engineers in the automotive industry (e.g. [Citation28]). Front and side LMS models are mainly utilised by experts to obtain an estimate of the vehicle crash pulse and thereafter inform the detailed design process of the load-carrying structures and occupant environment [Citation7]. More recently, Hamza and Saitou enhanced the LMS model definition, developing equivalent mechanisms [Citation14]. The suggested mechanisms were a set of rigid links with lumped masses connected with kinematic joints and non-linear springs, resembling the vehicle front sub-structure.
In the area of collapsible beams, Wierzbicki and Abramowicz in 1983 [Citation33] and 1989 [Citation4] first introduced the macro-element methodology and the concept of the ‘super-folding element’ and ‘super-beam’. They were inspired by Alexander's work in 1960 [Citation5] on an approximate theory for calculating the collapse load of cylindrical tubes under axial load. This methodology is currently implemented in the software package Visual Crash Studio (VCS) by Impact Design [Citation31], which evolved from the computer program CRASH-CAD [Citation32]. Recently, the macro-element methodology was used via VCS for the structural analysis of a body-in-white (BiW) according to the Euro NCAP side pole test [Citation20]. This work was funded through the FP7 EU-project ‘SmartBatt’ [Citation12] and was focused on battery housing development and integration for an electric energy storage system. Parallel efforts were also made by Mahmood et al. in 1986 to propose an analytical technique in order to predict crush responses of thin wall structural components [Citation21]. This technique, named SECOLLAPSE, formed the core of the computer program VCRUSH, which is however not broadly accessible.
Multi-body vehicle modelling for crashworthiness analysis is based on the plastic hinge concept, introduced by Nikravesh [Citation27], to analyse plastic deformations of structures. In 1994, Dias and Pereira were among the first to demonstrate the use of this concept to create a multi-body system of a vehicle structure during impact [Citation11]. The main challenge in developing multi-body systems resides in modelling the constitutive behaviour of the plastic hinges and validating it against reference responses. Therefore, in order to represent the vehicle dynamics and structural deformations accurately, recent studies had focused on model identification methods with the use of optimisation algorithms to create reliable multi-body systems (e.g. [Citation8]).
Finally, finite element models of different complexity and fidelity (hybrid, reduced-order, sub-models and detailed) have been used extensively in the automotive industry from 1980. For example, simplified hybrid models built with beam and shell elements were suggested by Dai and Duan for crashworthiness analysis of front-end vehicle assemblies, where the beam properties were characterised using artificial neural networks [Citation10]. Similarly, Mundo et al. proposed an engineering approach for the replacement of beam-like structures and joints of a BiW that can be used in Noise, Vibration and Harshness (NVH) analyses, based on geometric analysis of cross-sections and static analysis of joints [Citation23]. In addition, Chase et al. in Ref. [Citation9] demonstrated the use of sub-models with boundary conditions taken from the full vehicle model in a roof crush optimisation study.
To authors’ best knowledge, there is limited published work on full scale vehicle modelling and simulation for crashworthiness using the macro-element methodology and on numerical results comparison between macro-element and finite element models [Citation20,Citation30]. This paper addresses this literature gap. For the purpose of this study, the old vehicle model Jaguar XJ (X351) was used (not currently in production).
The organisation of this paper is as follows. Initially, in Section 2, a brief description of the macro-element methodology is provided. In Section 3, techniques suitable for creating macro-element models are presented. While, in Section 4, this non-conventional modelling and simulation approach is applied to representative examples from the automotive industry, ranging from components and sub-systems to full vehicle models. In all cases, the numerical results obtained using the macro-element methodology are compared against those obtained from a well-established commercial finite element code (LS-DYNA) [Citation19]. Finally, in Section 5, conclusions are drawn on the maturity and appropriateness of the macro-element methodology for conceptual crashworthiness vehicle design.
2. Macro-element methodology
The macro-element methodology was originated by Alexander's work at the beginning of 1960s, who derived an analytical expression to predict the mean crushing force of cylindrical tubes under axial loading [Citation5]. Examining the mechanics of progressive collapse for multi-corner tubes in experimental studies, Wierzbicki and Abramowicz in 1983 [Citation33] and 1989 [Citation4] proposed a corner element, called the super-folding element (see (a)). This element was the building block of the macro-element methodology. A detailed literature review on this topic can be found in the resources available in Ref. [Citation30].
Figure 1. (a) Plastic folding mechanisms for super-folding element (the numbers refer to mechanisms mentioned in the text) [Citation2] © 2003 Elsevier and (b) super-beam element (adapted from [Citation1] © 2004 Elsevier).
![Figure 1. (a) Plastic folding mechanisms for super-folding element (the numbers refer to mechanisms mentioned in the text) [Citation2] © 2003 Elsevier and (b) super-beam element (adapted from [Citation1] © 2004 Elsevier).](/cms/asset/6cea3394-2fb2-4998-a7cf-3d6f44590a65/tcrs_a_1328723_f0001_b.gif)
Briefly, a super-folding element (see (a)) can model the crushing behaviour of a single lobe during a progressive folding process with different deformation modes (e.g. asymmetric, symmetric) [Citation3]. Its formulation, which is based on the internal energy dissipation and energy balance equation, allows at pre-processing stage to predict critical engineering information, such as collapse modes, mean crushing force, wavelength, etc. According to the macro-element methodology, super-folding elements are used to discretise the geometric profile of thin-walled structures and describe their response under an arbitrary crash load. Their geometry is defined by the following parameters:
total length of the two arms,
central angle,
wall thickness of the arm with length α,
wall thickness of the arm with length b,
The plastic folding mechanisms of this element are shown in (a) and are: (1) deformation of a ‘floating’ toroidal surface, (2) bending along stationary hinge lines, (3) rolling deformations, (4) opening of conical surfaces and (5) bending deformations along inclined stationary hinge lines following locking of travelling hinge line [Citation2].
The super-folding element was then implemented in the formulation of a macro-element beam, called super-beam element (see (b)) [Citation1, Citation2, Citation32] which is used to discretise space frame structures. The modelling of the super-beam element was based on the concept of the energy equivalent flow stress [Citation1, Citation2]. Each super-beam element is divided into deformable cells (layers), located at the two ends with length equal to the cross-section folding wavelength 2H, and an elastic/plastic part in the middle. A deformable cell is discretised with super-folding elements, encapsulating the crushing response of a single layer of folds and can be viewed as a generalised plastic hinge. The number of super-folding elements used at a given location of a structure equals to the number of the cross-section corners.
The axial crushing response of a super-beam element is calculated for all deformation histories , using the rate of internal energy dissipation equation [Citation2],
(1)
(1) where
and
are the fully plastic membrane force and bending moment, respectively,
is the rate of deformation in a principal direction and
is the jump of rotation rate across a moving hinge line.
are the continuous deformation fields, corresponding to the toroidal and conical surfaces 1 and 4 in (a) and Li is the length of plastic hinge line.
EquationEquation (1)(1)
(1) depends on three free geometric parameters, namely, the length of plastic folding wave
, average rolling radius
and a switching point parameter
, which controls the amount of tensile deformations in conical surfaces 4 ((a)). These parameters are calculated from the minimisation of the mean axial crushing force of a super-folding element [Citation2],
(2)
(2) where
and
are equivalent stresses from quasi-static uniaxial tension/compression and bending, respectively,
and
with
denote representative strain and fractional contributions to energy dissipation from the five plastic folding mechanisms, shown in (a) and
is the effective crushing distance. The mean axial crushing force of deformable cells ((b)) is calculated by adding the fractional contributions of all active super-folding elements (EquationEquation (2)
(2)
(2) ). Finally, the instantaneous axial crushing force is defined by equating the rate of external loading and rate of internal energy dissipation,
where
is the rate of axial crushing.
The above definitions of the super-folding and super-beam elements are currently implemented in the software package VCS by Impact Design [Citation31], which was also used in this study. The simulation methodology in VCS is based on the explicit solution of the governing equations of motion defined for the nodes of the macro-element model with constant time step [Citation1],where the mass matrix
represents the lumped mass and inertia tensor distributed to elements’ nodes,
is the displacement vector,
is the vector of the applied and body forces and
is the vector of the internal loads from the connected elements [Citation30].
The main advantages of a macro-element model over a conventional finite element model are: agile conceptual design, quick and easy design alternations and reduced computational time and resources. More particularly, a macro-element model can be built with limited vehicle information, such as final design lines, connections, packaging, etc., making this approach suitable for conceptual design and analysis. Furthermore, the cross-sections of load-carrying beams can be altered quickly and easily from one design to another (e.g. for the A-pillar, rocker) without the need to re-create CAD and finite element models. Finally, a full vehicle crash analysis of a macro-element model can run in less than a minute on a normal desktop PC/laptop. While, the corresponding finite element model usually requires minutes or hours to run on a high-performance computing system.
On the other hand, as with every simplified modelling and simulation technique, the macro-element methodology (VCS v3.0) presents a number of practical and theoretical limitations, which were identified during this study and are discussed in the following sections. In particular, the users of the macro-element methodology are required to have expert structural and crashworthiness knowledge and experience for model build-up and verification. The super-beam elements do not have an advanced formulation to accurately predict except axial crushing, also lateral crushing, bending and torsion behaviour. Valid modelling techniques and look-up tables for structural joints, dampers, bushings, kinematic constraints and shear plates are not available. While, connections (e.g. spot-welds) that are used to connect metal sheets together are considered as rigid, not having failure criteria, and are not taken into account in energy dissipation calculations.
3. Modelling techniques for macro-element methodology
3.1. Components
3.1.1. Cross-sections
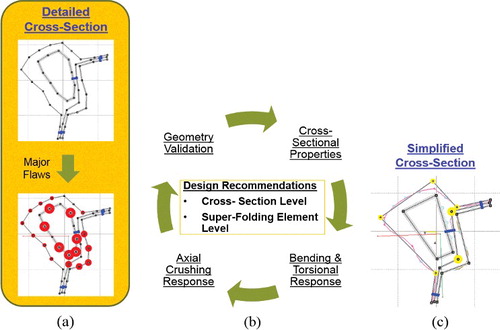
According to the macro-element methodology, multi-corner cross-sections of load-carrying beams are discretised with super-folding elements, which consist of two straight plates (as shown in (a)). In order to approximate the detailed shape of cross-sections that is usually encountered in finite element models, a simplification modelling process was developed, as presented in . In particular, detailed representations of cross-sections have major flaws (red circles in (a)), based on the macro-element methodology. These flaws are identified with simple geometrical calculations (e.g. length of plates, central angle between plates, etc.), and can lead to bad folding modes (inverted) or lobe collision (from narrow plates) [Citation2]. Therefore, a new manual process was developed to eliminate as much as possible the major flaws ((b)), taking into account design recommendations at cross-section and super-folding element level. This process aimed to match the: (1) geometry (dimensions), (2) cross-sectional properties (e.g. area, specific mass, moments of inertia) as well as (3) bending, torsional (e.g. peak moments, fully plastic moments) and (4) axial crushing responses (e.g. energy absorption, peak force) between the original and simplified cross-section. In most cases, the final simplified cross-sections have minor flaws (e.g. too wide plates) (yellow circles in (c)). This simplification process is numerically validated in Section 4.1.1.
Figure 2. Simplification process for cross-sections: (a) detailed cross-section with major flaws, (b) flaws elimination process and (c) simplified cross-section with minor flaws.
3.1.2. Structural joint
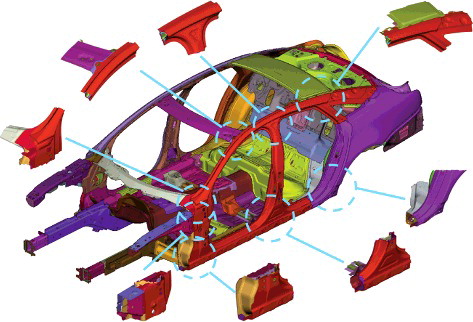
An important barrier to use simplified modelling and simulation methodologies for vehicle crashworthiness design is the difficulty to model accurately the BiW joints’ stiffness (see ). Several representations of structural joints have been introduced over the last 40 years to overcome this problem, ranging from rotational springs or equivalent short beams to hybrid and finite element concept models. For example, Lee and Nikolaidis in Ref. [Citation17] proposed a two-dimensional model for joints with rigid core, rotational springs and flexible branches (beams). Kim et al. in Ref. [Citation16] examined the possibility of using short beam elements instead of rotational springs to account for joint flexibility. More recently, Shahhosseini and Prater in Ref. [Citation29] suggested a beam-like major compliant joint model, where the joint's legs are discretised into beams connected with rigid bodies, while the core of the joint is modelled by a beam with a curved profile. Optimisation methods as well as neural networks were also implemented to approximate the joint stiffness in comparison to finite element models (e.g. in [Citation18, Citation22, Citation26]). A detailed literature review on joint modelling techniques is provided in Ref. [Citation29].
Figure 3. Major BiW structural joints for X351 model.
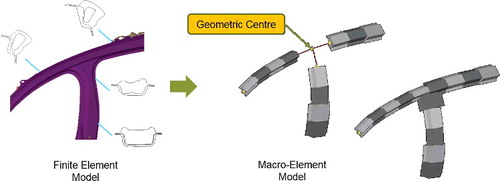
According to the modelling technique offered by the macro-element methodology in VCS, intersecting load-carrying beams are connected at a geometrical centre, as demonstrated in for the joint that connects the A-pillar, B-pillar and Cant-Rail. X, Y and Z offsets can be applied to the start and end of the intersecting beams to modify their position and length and hence, approximate more realistically the actual geometry of the structure and the rigid core of the joint.
Figure 4. Modelling technique for structural joints using super-beam elements.
3.2. Sub-systems
3.2.1. Suspension assemblies
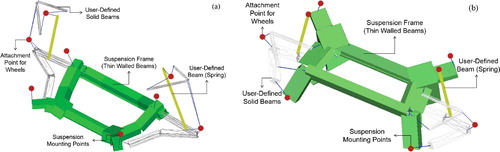
The macro-element models of the vehicle suspensions were also created, as shown in . For both the front and rear suspensions, the frame was modelled with thin walled beams, the wishbones with user-defined solid beams and the springs with user-defined beams for which the axial response was given as a curve (deformation vs. force). The suspensions were rigidly attached to the vehicle at specific mounting locations and similarly, attachment points for the wheels were defined (red circles). Finally, kinematic constraints (revolute joint, spherical joint, etc.) as well as dampers, which existed in the corresponding finite element model, were not supported and therefore were omitted during this modelling process.
Figure 5. Macro-element models for: (a) front suspension and (b) rear suspension.
3.2.2. Rigid parts
Parts that are not deformed significantly during impact load cases, such as the engine and gearbox can be modelled as rigid bodies. To create rigid bodies, a node at the centre of gravity of the finite element part(s) is defined and the total mass and inertia matrix are assigned to this node. Thereafter, this node is connected directly to the remaining structure, while in case of multiple mounting locations, simple super-beam elements (with circular cross-section) can be used. Finally, in order to account for the volume of the parts, needed for contact definitions, mass-less rigid bodies (cones, boxes, etc.) can be created at this node and positioned according to the geometry of the finite element model, as shown in (a) for the engine assembly.
Figure 6. Rigid part modelling for: (a) engine and gearbox and (b) wheel.
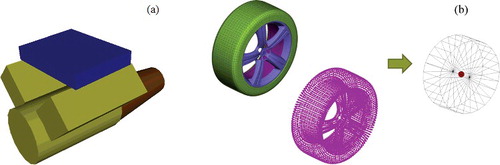
A similar process can be followed for the vehicle wheels ((b)), where the shell representation of the wheel as well as the concentrated masses can be replaced by a rigid cone with equivalent mass and inertia. Tyre deformation under gravitational and crushing loads can also be modelled with user-defined contacts, but it was not taken into consideration in this study, due to time limitations.
3.2.3. Shear panels
Detailed finite element models have also thin surface parts (e.g. roof, floor panels, etc.) or parts from glass (windscreen) that contribute to vehicle's response via shear deformation. These shear panels were replaced by super-beams according to the simplification process depicted in , suggested by Impact Design. In brief, this process included the: (1) calculation of the panel's volume V, (2) creation of replacement super-beam elements with same material properties as the finite element parts in a diagonal, horizontal and/or vertical formation, intersecting at the panel's mass centre, (3) calculation of their total length L, (4) selection of wall thickness t for the rectangular cross-section and (5) calculation of the cross-section's height h.
Figure 7. Process for replacing shear panels with super-beam elements.
For the calculation of the cross-section's height h, the volume of the shear panel was multiplied by an empirical value 2/3 to incorporate the fact that in pure shear the yield stress is lower than in pure tension according to the von Mises yield condition.
3.3. Full vehicle
Large-scale modelling in VCS and in particular for the vehicle's BiW presented many challenges. For example, the data for strain-rate dependent material cards (*MAT24/*MAT123) are not fully imported (e.g. the strain–stress curves are not populated). In addition, the cross-section creation technique in VCS assumes an infinite plane that cuts across all the model rather than near the area of interest (e.g. A-pillar). This results in the creation of many unnecessary plates (for each metal sheet that is cut) in a cross-section that have to be identified and deleted. Also, from initial trials, the created cross-section profile was not an accurate representation of the actual geometry, necessitating many manual steps to correct it.
To overcome the former issue, Python scripts were developed to convert the LS-DYNA material cards to VCS material entities in XML format that can be imported in VCS and used for the definition of the cross-sections.
Due to the latter problems, the modelling technique available in VCS was avoided and the cross-sections were extracted using the cross-section tool in ANSA [Citation6] and then were transferred to VCS (cross-section points, sheets’ material and thickness). Afterwards, the simplification process, presented in , was applied to improve the quality of the cross-sections. Furthermore, a new conversion process for the 3D BiW model (from finite element model to macro-element model) was developed, as depicted in . This process included the following steps:
| (1) | Import the BiW finite element model (shells) in ANSA. | ||||
| (2) | Create beams for the load-carrying structures using the cross-section tool of ANSA. Export the BiW finite element model (beams) in NASTRAN format. This format was selected as the only available option to import the created beams in VCS. It was found that VCS does not read arbitrary cross-sections in NASTRAN format (PBMSECT/PBRSECT) that could potentially expedite the large-scale modelling task. | ||||
| (3) | Import the NASTRAN model of the BiW in VCS and | ||||
| (4) | Apply cross-section profiles to super-beam elements. | ||||
Figure 8. BiW conversion process from finite element model (ANSA) to macro-element model (VCS).
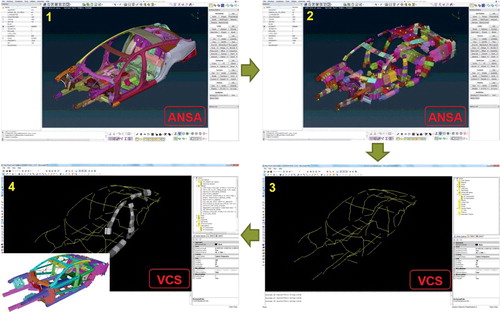
The macro-element model was finalised by modifying the start/end point locations of the super-beam elements to better align them with the geometry of the BiW and by creating structural joints (as described in Section 3.1.2) where three or more beams intersected (as shown at the bottom left corner of ).
4. Simulation results
In subsequent sections, a large number of macro-element and finite element models with increasing complexity are presented and investigated. In an effort to make this case study as reproducible as possible and applicable to similar systems, detailed information regarding the modelling approaches and parameters (e.g. dimensions, number of elements, boundary and loading conditions, solver settings, etc.) is provided for the majority of the investigated vehicular systems.
For the numerical comparison of the results obtained from the finite element and macro-element models, the free software CORA (CORelation and Analysis) was used [Citation13]. In particular, the cross correlation rating of CORA () was calculated for the time histories obtained from LS-DYNA (reference) and VCS is presented as an objective measure of the results agreement. The value of
ranges in [0, 1], with 0 to represent a poor correlation between the responses and 1 a good correlation. The interval of evaluation for the responses (
) was selected as the total simulation time for each loadcase and the weighting factors were chosen as
and
.
4.1. Components
4.1.1. Beam subject to axial load
Initially, the macro-element methodology was assessed by investigating a simple beam-like structure under impact load ((a)). Two models with the same loading and boundary conditions were created in VCS (super-beam elements) and ANSA (finite elements). The geometry of the simplified cross-section used in VCS and the detailed cross-section used in ANSA was taken from the A-pillar of the X351 vehicle model and are shown in (b) and (c), respectively.
Figure 9. Beam model subject to axial load: (a) macro-element model, (b) simplified cross-section of the beam used in VCS and (c) detailed cross-section of the beam used in ANSA with material properties and thicknesses.
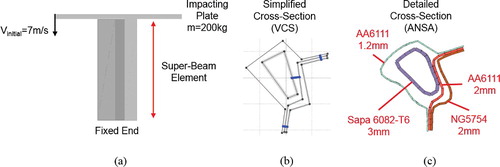
In VCS, this component was discretised with one super-beam element along its length (0.2 m) and crushed using a 200 kg impacting plate (rigid body) with initial velocity 7 m/s, keeping the opposite end fixed ((a)). The different sheets comprising the cross-section were connected together via ideal connections without failure criteria or material definition (blue lines in the simplified cross-section in (b)). These connections were positioned at locations where adhesives and/or spotwelds exist in the finite element model. In addition, the structure was considered as ideal along its length, therefore, no triggering force/dent was defined.
In ANSA, this component was modelled using quadrilateral and triangular elements (2934 in total), while mesh-independent solid and beam elements as well as spotweld contact were used to connect the four metal sheets together. Furthermore, the impacting plate was modelled with shell finite elements, rigid material definition and distributed mass of 200 kg on its nodes. Finally, the material of the sheets was aluminium of three different alloys (AA6111, NG5754 and Sapa 6082-T6), as shown in (c) along with the sheets’ thickness.
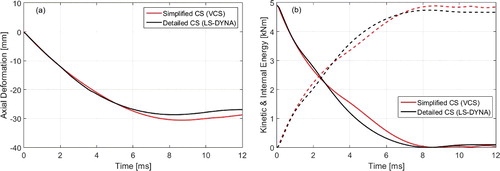
In order to solve this load case, the explicit solver of VCS with constant time-step (DT = 1 × 10⁻⁵ ms) and the explicit solver of LS-DYNA with an adaptive time-step were used. Different types of time-step were selected, as VCS does not offer the option for adaptive time-step. Even though LS-DYNA allows constant time-step, for convergence reasons adaptive time-step was chosen for all the finite element models in this study. The numerical results obtained in terms of axial deformation and kinetic and internal energy are presented in (a) and (b), respectively. It becomes apparent that the deformation and energy absorption predicted by VCS for this beam-like structure with complicated cross-section compared well with LS-DYNA. The cross correlation rating calculated by CORA was 0.978, 0.981 and 0.994 for the axial deformation, kinetic and internal energy, respectively.
Figure 10. (a) Axial deformation and (b) kinetic and internal energy (solid and dashed line, respectively) for beam model subject to axial load (VCS (simplified cross-section) vs. LS-DYNA (detailed cross-section)).
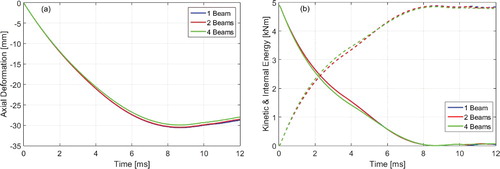
Thereafter, the influence of the number of super-beams on the solution was investigated, by splitting the component to 2 and 4 super-beams of equal length for each case. The recommended number of super-beams according to the macro-element methodology was 4, therefore, this was the maximum number used in this study. For this load case, it was found that the solution is not affected by the number of super-beams, as shown in (a) and (b).
Figure 11. (a) Axial deformation and (b) kinetic and internal energy (solid and dashed line, respectively) for beam model subject to axial load with 1, 2 and 4 super-beam elements.
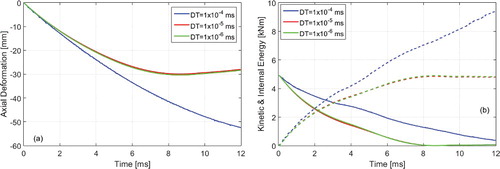
Finally, using the recommended number of super-beams, the influence of the order of magnitude of the time step on the solution was examined. As can be seen in (a) and (b), when the time step is 1 × 10⁻⁵ ms and 1 × 10⁻⁶ ms the results are identical, while when the time step is 1 × 10⁻⁴ ms (blue lines) the energy balance is not satisfied and the solution is diverging (the total energy is increasing). Consequently, since the time-step of the explicit solver in VCS is not adjusted automatically during the simulation, it should be chosen carefully on a case-by-case basis.
Figure 12. (a) Axial deformation and (b) kinetic and internal energy (solid and dashed line, respectively) for beam model subject to axial load with 4 super-beam elements and time-step DT = 1 × 10⁻⁴, 1 × 10⁻⁵ and 1 × 10⁻⁶ ms.
4.1.2. Structural joint
In order to investigate the accuracy with which the stiffness of structural joints can be modelled using the macro-element methodology, the joint that connects the A-pillar, B-pillar and Cant-Rail was selected (). Super-beam elements, 14 in total, with different cross-sections were used to model the joint's legs according to the macro-element methodology, the length of which was selected to be 290 mm. An equivalent finite element model was built in ANSA, using quadrilateral and triangular elements (7605 in total), while mesh-independent solid and beam elements as well as single surface and spotweld contacts were used to connect the metal sheets together. Finally, the material and thickness of the main joint's metal sheets were as given in Section 4.1.1.
Four studies were conducted to assess the stiffness of the structural joint depicted in and in particular, the joint stiffness along the fore and aft directions and inboard and outboard directions. In all cases, the end points of the beams for the A-pillar and Cant-Rail were fixed. In addition, a linearly increasing load was applied at the end point of B-pillar (0 N at t = 0 ms and 10 kN at t = 1000 ms) in global −X and X-axes (fore and aft) and Y and −Y-axes (inboard and outboard). The numerical results obtained from VCS and LS-DYNA in form of the deformation at the end point of B-Pillar along −X, X, Y and −Y-axes are compared in and .
Figure 13. B-pillar end point deformation along global X-axis: (a) for applied load in fore direction and (b) for applied load in aft direction.
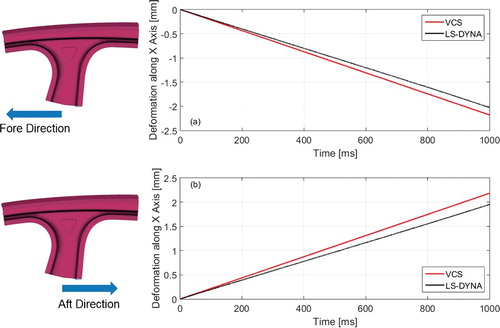
Figure 14. B-pillar end point deformation along global Y-axis: (a) for applied load in inboard direction and (b) for applied load in outboard direction.
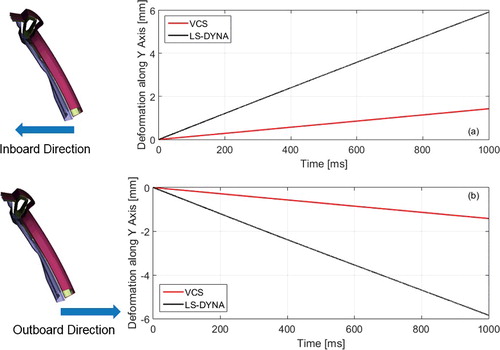
From , it becomes apparent that the deformation of the B-pillar end point was captured adequately from VCS (within ∼10% error at t = 1000 ms), when the concentred load was applied in fore and aft directions. On the other hand, from , it can be concluded that the joint stiffness was significantly overestimated (by ∼75% at t = 1000 ms), when the concentred load was applied in inboard and outboard directions. The value was 0.963 and 0.948, when the load was applied in the fore and aft direction, respectively, while 0.764 and 0.765, when the load was applied in the inboard and outboard directions. These findings are consistent with previously conducted studies on joint modelling (i.e. [Citation17, Citation22]). The discrepancy in the results presented in is due to the joint modelling technique available in VCS (connection of intersecting beams to their geometrical centre), which does not provide adequate response prediction in case of out-of-plane deformation. Taking into account that alternative joint modelling techniques (e.g. rotational springs) were not available in VCS, when this research work was conducted, the accuracy of stiffness modelling for structural joints could not be improved.
4.2. Front bumper assembly
Following the same modelling and comparison process presented so far, the front bumper assembly of the investigated vehicle was modelled and analysed using the macro-element methodology as well as the finite element method. For the former approach, 14 super-beam elements were created with closed profile cross-sections, which were consisted of aluminium material and had pre-defined metal sheet thickness (bumper beam = 3 mm and crush box = 2.5 mm), as depicted in (a). The corresponding finite element model was built in ANSA, using quadrilateral and triangular elements (10814 in total). The front bumper assembly was analysed in two low velocity impact scenarios against a rigid wall and a rigid pole, described in the next two sections, while different contact modelling techniques were also evaluated.
Figure 15. (a) Macro-element model for front bumper assembly and (b) additional beams for capturing lateral crushing.
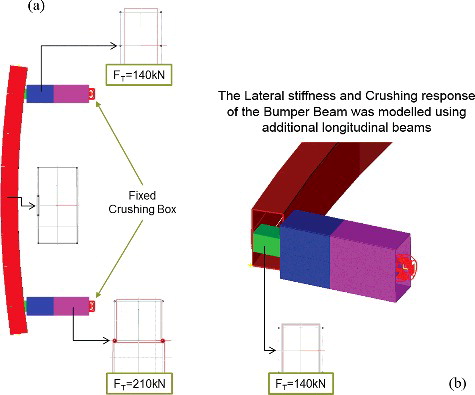
The finite element model of the crush box had dents along the global Y and Z- axes to control the initiation and progression of folding during impact scenarios. In VCS, each crush box was modelled with two super-beam elements (front and rear) with the same cross-section, but different triggering forces as shown in (a) (blue and purple beams). The values of the triggering forces were selected after trial and error iterations focused on matching the collapse modes of the assembly between the macro-element and finite element models.
The lateral crushing response of the bumper beam, observed during the finite element analysis, could not be captured using the existing formulation of the super-beam elements in VCS (v3.0). Therefore, additional longitudinal beams were included in the model, as shown in (b) and their triggering force was set to 140 kN.
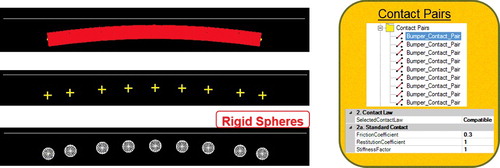
In order to model the contact between the rigid wall and bumper beam, the recommended rigid body contact technique was used. In particular, mass-less rigid body spheres (with radius = 30 mm) were created in each node of the bumper beams and were offset in the global −X-axis to coincide with the profile of the bumper. Thereafter, individual contact pairs between the rigid spheres and wall were created, using the default setting (e.g. type, restitution and friction coefficient, etc.), as shown in .
Figure 16. Contact modelling for front bumper assembly using contact pairs.
4.2.1. Rigid wall
In this impact scenario, the end nodes of the crush boxes were fixed to the ground and an initial velocity of 5 m/s and 2500 kg mass were assigned to the rigid wall. From the finite element analysis in LS-DYNA, the collapse modes for low velocity impact were identified as: (1) bending of the bumper beam, (2) lateral crushing of the bumper beam, (3) axial crushing of the front part of the crush box and (4) axial crushing of the rear part of the crush box.
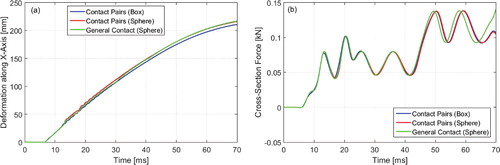
The results obtained from VCS and LS-DYNA in terms of bumper beam deformation along the global X-axis (central point) and cross-section force (resultant force on super-beams (VCS) and finite elements (LS-DYNA)) of the crush boxes are depicted in (a) and (b). The value for the deformation and cross-section force was 0.991 and 0.876, respectively. The high frequency oscillations in cross-section force, predicted from VCS, are speculating to occurring due to the default numerical damping embedded in the explicit solution sequence. In (a), the undeformed and deformed (t = 70 ms) shape of the bumper assembly are also presented. The kinetic and internal energies obtained from VCS and LS-DYNA compared well and are not shown in this paper for brevity.
Figure 17. (a) Bumper beam middle point deformation along global X-axis and (b) cross-section force of left crush box.
Besides the technique using contact pairs between the wall (rigid box) and the bumper beam (rigid spheres), alternative contact modelling techniques were also investigated. In particular, three other cases were considered: (1) contact pairs between rigid boxes (wall and bumper beam), (2) general contact between rigid box (wall) and rigid spheres (bumper beam) and (3) general contact between rigid boxes (wall and bumper beam). In all cases, the same or similar values were selected for the contact parameters (). The results obtained are shown in (a) and (b) for the first two cases, while the solution for the last case, when general contact between rigid boxes was considered, was unstable; it did not converge and is not shown. From , it becomes apparent that the numerical results for the cases when contact pairs were considered (sphere and box rigid bodies) were identical. However, when general contact was modelled, numerical drift in the solution was observed, as the corresponding curve had different phase ((b)).
Figure 18. (a) Bumper beam middle point deformation along global X-axis and (b) cross-section force of left crush box.
4.2.2. Rigid pole
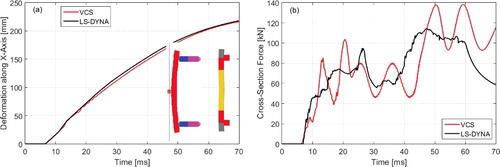
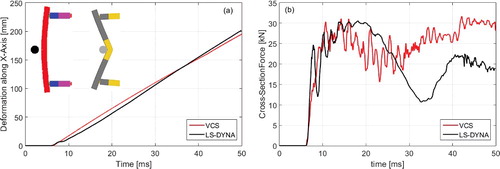
For the case of impact against a rigid pole, the same boundary conditions for the front bumper assembly, as those described in Section 4.2.1, were applied. In addition, an initial velocity of 5 m/s and 1500 kg mass were assigned to the rigid pole (radius = 50 mm). Contact pairs between the rigid pole (cylinder) and the bumper beam (rigid spheres at super-beams’ nodes) were defined, following the approach shown in . Furthermore, in order to model better the contact with the rigid pole as well as to capture the bending deformation, the bumper beams were refined around the central line (split in half). From the finite element analysis in LS-DYNA, the collapse modes for low velocity impact were identified as: (1) bending of the bumper beam and (2) bending of the bumper beam and crush boxes.
The results obtained from VCS and LS-DYNA in terms of bumper beam deformation along the global X-axis (central point) and cross-section force of the crush boxes are depicted in (a) and (b), showing good correlation. The value for the deformation and cross-section force was 0.996 and 0.825, respectively. In (a), the undeformed and deformed (t = 50 ms) shape of the bumper assembly are also presented.
Figure 19. (a) Bumper beam middle point deformation along global X-axis and (b) cross-section force of left crush box.
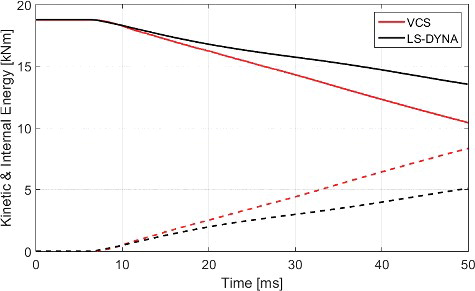
Finally, in , the kinetic and internal energy are presented with solid and dashed lines, respectively. It can be seen that despite the fact that the bumper beam deformation is well-captured in VCS, there is significant discrepancy in the kinetic and internal energy. Even though the energy balance is maintained, the conversion rate between kinetic and internal energy is higher in VCS than in LS-DYNA, that cannot be easily explained. The value for the kinetic and internal energy was 0.852 and 0.846, respectively.
Figure 20. Kinetic and internal energy (solid and dashed lines, respectively) for the bumper assembly system.
4.3. Full vehicle
Two loadcases were investigated in order to assess the macro-element methodology in full vehicle simulations. In particular, in the following sections, numerical results obtained from VCS and LS-DYNA for a roof crush test (FMVSS 216) and a full width frontal impact test (US-NCAP) are presented.
4.3.1. Roof crush test (FMVSS 216)
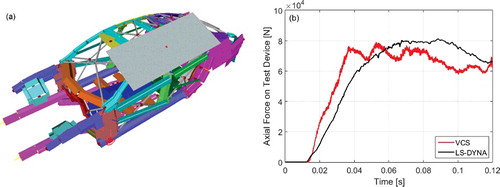
The completed macro-element vehicle model (BiW, doors, shear panels, floor rails, shotguns) was set-up for a roof crush test according to the Federal Motor Vehicle Safety Standard 216 (FMVSS 216) and analysed. Information regarding the FMVSS 216 standard can be found in Ref. [Citation24]. The key differences between the finite-element and macro-element model for the roof crush test are presented in . It is worth mentioning that the number of elements, entities and materials were significant lower, using the macro-element methodology than the finite element method. Consequently, the simulation time was less than 1 min on one computing core in comparison to 4 h and 42 mins required by LS-DYNA on 16 cores.
Table 1. Key differences for the roof strength test model.
The macro-element vehicle model is shown in (a) and the resultant force on the test device (rigid plate) along the direction of movement obtained from VCS (filtered) and LS-DYNA is given in (b). From (b), it can be seen that the form of the axial force obtained in VCS compared well with that from LS-DYNA and the calculated value was 0.946. Also, the first part of the curve is overestimated by VCS (higher slope than LS-DYNA), while the prediction for the second part of the curve is significantly lower. This behaviour can be explained by the fact that the current modelling of structural joints is over-estimating their stiffness, as was shown in Section 4.1.2. Trial simulations also indicated that the solution is sensitive to the cross-section properties (dimensions and thickness) of the beams used to replace the shear panels (e.g. windscreen, floor, etc.) and their formation.
Figure 21. (a) Macro-element model for roof crush test and (b) axial force on test device.
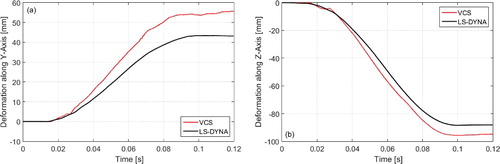
In addition, the deformation along the global Y and Z-axes of the geometrical centre of the structural joint, where the A-pillar, B-pillar and Cant-Rail intersect underneath the test device, are presented in (a) and (b), respectively. The numerical difference in the curves can be considered as acceptable in conceptual vehicle design and can be explained by taking into account the axial force in the second part of the simulation ((b)). It can be concluded that the deformation predicted by VCS is higher because the axial force in VCS is lower than in LS-DYNA (the vehicle's resistance is less).
Figure 22. Deformation of the geometrical centre of the structural joint between A-pillar, B-pillar and Cant-Rail along the: (a) Y-axis and (b) Z-axis for roof strength test.
4.3.2. Full width frontal impact test (US-NCAP)
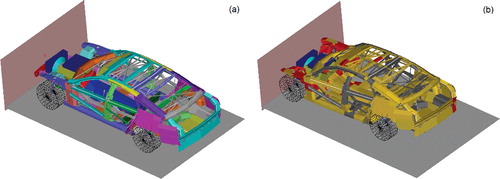
The sub-systems described in previous sections, such as the front bumper, suspensions, engine, powertrain and wheels were added to the macro-element model, used for the roof crush test ((a)), to create the full vehicle model, shown in (a). This model was set-up and analysed for full width frontal impact test against a rigid wall with a vehicle speed of 36 miles/h according to the US-NCAP standard [Citation25]. The deformed shape of the macro-element model at t = 140 ms is presented in (b), where the colours of the super-beam elements indicate their deformation phase.
Figure 23. Macro-element vehicle model for full width frontal impact test: (a) undeformed and (b) deformed shape (beams coloured grey are in elastic range, green have reached their load carrying limit, yellow are in post collapse range and red are in deep collapse range).
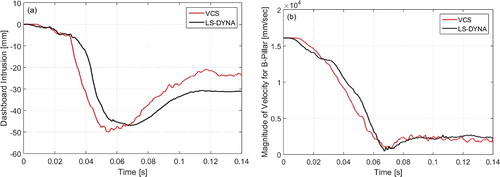
Finally, the dashboard intrusion and the magnitude of velocity measured at the top of the B-pillar (left-hand side) are depicted in (a) and (b), respectively, showing good comparison between VCS and LS-DYNA .
Figure 24. (a) Dashboard intrusion and (b) magnitude of velocity for B-pillar for full width frontal impact test.
5. Conclusions
In this paper, a bottom-up approach was adopted to assess a non-conventional methodology for crashworthiness modelling and analysis, based on the macro-element concept. Initially, modelling techniques and processes suitable for macro-element models were presented. Thereafter, a number of macro-element and finite element models with increasing complexity, such as a beam subject to axial load, a structural joint, a front bumper assembly and full vehicle models were investigated. Simulation results obtained from both methods were compared between VCS and LS-DYNA. High level of modelling information was provided for the majority of the vehicular systems in order to make this case study reproducible and applicable to other vehicles.
At component level, the deformation of the investigated beam subject to axial load was predicted accurately from VCS, showing that the simplification of the cross-section profile does not affect the results. When this beam was split into a number of super-beams (1, 2 and 4) and different time steps (1 × 10⁻⁵ ms and 1 × 10⁻⁶ ms) were selected, the solution remained unchanged. However, the solution diverged for the largest time step (1 × 10⁻⁴ ms), indicating that since the time step is not adapted during the simulation, it has to be chosen carefully. Mixed results were obtained during the assessment of a structural joint. Good correlation was observed when the load was applied in the fore and aft directions and poor correlation when it was applied in the inboard and outboard directions. Therefore, it was concluded that the creation technique for structural joints, where 3 or more beams are connected at their geometrical centre overestimates the stiffness of the joints. Since rotational springs are not available in VCS, this prediction could not be improved.
The study conducted for the front bumper assembly (rigid wall and pole with different contact techniques) showed good correlation of results with the exception of the kinetic and internal energy for the impact against the rigid pole. In order to achieve this correlation, trial and error simulations had to be run in order to identify the triggering forces of the crush boxes that match the collapse modes between the macro-element and finite element models. In addition, since the lateral crushing of super-beams was not supported in VCS, additional longitudinal beams needed to be added to the model to resemble the behaviour of the finite element model.
Finally, two vehicle load cases, namely, the roof strength test (FMVSS 216) and the full width frontal impact against a rigid wall (US-NCAP), were set-up and performed during this work. The results obtained from VCS and LS-DYNA compared well, providing a qualitative and quantitative prediction of the vehicle's performance. However, it was found that these results were sensitive to the properties and formation of the super-beams that replaced the shear panels (e.g. windscreen, floor panels, etc.) in VCS. Due to the reduced number of elements and materials used for the macro-element models, this methodology provided results for full vehicle analyses in less than 1 min in comparison to hours needed by LS-DYNA. This computational advantage of the macro-element models combined with improved functionality and accuracy could potentially enable engineers to evaluate multiple conceptual designs in shorter times and revolutionise the vehicle development phase. Improvements in the functionality of VCS could include: implementation of an explicit solver with adaptive time step, modelling of rotational springs, provision of look-up tables for the stiffness of structural joints and the triggering force of crush boxes, modelling of lateral crushing of super-beams and modelling of shear panels.
Disclosure statement
The authors declare that they have no competing interests.
Additional information
Funding
References
- W. Abramowicz, An alternative formulation of the FE method for arbitrary discrete/continuous models, Int. J. Impact Eng. 30 (2004), pp. 1081–1098.
- W. Abramowicz, Thin-walled structures as impact energy absorbers, Thin Wall. Struct. 41 (2003), pp. 91–107.
- W. Abramowicz, Macro Element Method on Crashworthiness of Vehicles. Crashworthiness – Energy Management and Occupant Protection, Springer Wien, New York, NY, 2001.
- W. Abramowicz and T. Wierzbicki, Axial crushing of multicorner sheet metal columns, J. Appl. Mech. 56 (1989), pp. 113–120.
- J.M. Alexander, An approximate analysis of the collapse of thin cylindrical shells under axial loading, Q. J. Mech. Appl. Math. 13 (1960), pp. 10–15.
- ANSA. User's Guide v15.1.0, BETA CAE Systems S.A., Kato Scholari, Greece, 2014; software available at https://www.beta-cae.com/.
- P. Du Bois, C.C. Chou, B.B. Fileta, T.B. Khalil, A.I. King, and H.F. Mahmood, Vehicle Crashworthiness and Occupant Protection, American Iron and Steel Institute, Southfield, Michigan, 2004.
- M. Carvalho, J. Ambrosio, and P. Eberhard, Identification of validated multibody vehicle models for crash analysis using a hybrid optimization procedure, Struct. Multidiscip. Optim. 44 (2011), pp. 85–97.
- N. Chase, R. Sidhu, and R. Averill, A new method for efficient global optimization of large systems using sub-models – HEEDS COMPOSE demonstrated on a crash optimization problem, 12th International LS-DYNA Users Conference, Detroit, MI, 2012.
- Y. Dai and C. Duan, Beam element modelling of vehicle body-in-white applying artificial neural network, Appl. Math Model. 33 (2009), pp. 2808–2817.
- J.P. Dias and M.S. Pereira, Design for vehicle crashworthiness using multibody dynamics, Int. J. Vehicle Des. 15 (1994), pp. 563–577.
- FP7-266074 ‘SmartBatt’ project (smart and safe integration of batteries in electric vehicles). Available at http://www.smartbatt.eu/.
- C. Gehre, H. Gades, and P. Wernicke, Objective rating of signals using test and simulation responses, 21st ESV Conference, Stuttgart, 2009.
- K. Hamza and K. Saitou, Design optimization of vehicle structures for crashworthiness using equivalent mechanism approximations, J. Mech. Des. 127 (2004), pp. 485–492.
- M.M. Kamal, Analysis and simulation of vehicle to barrier impact, SAE Technical Paper 700414, 1970.
- Y.Y. Kim, H.J. Yim, J.H. Kang, and J.H. Kim, Reconsideration of the joint modelling technique: In a box-beam T-joint, SAE Technical Paper 951108, 1995.
- K. Lee and E. Nikolaidis, A two-dimensional model for joints in vehicle structures, Comput. Struct. 45 (1992), pp. 775–784.
- S.B. Lee, J.R. Park, and H.J. Yim, Numerical approximation of vehicle joint stiffness by using response surface method, Int. J. Automot. Tech. 3 (2002), pp. 117–122.
- LS-DYNA. Keyword User's Manual R8.0, Livermore Software Technology Corporation, Livermore, USA, 2015; software available at http://www.lstc.com/.
- P. Luttenberger, M. Ostrowski, M. Kurz, and W. Sinz, Structural analysis of a body in white for battery integration using finite element and macro element with the focus on pole crash optimization, in European Congress on Computational Methods in Applied Sciences and Engineering, Vienna, 2012, pp. 6243–6262.
- H.F. Mahmood, A. Paluszny, and X.D. Tang, A 3-D computer program for crashworthiness analysis of vehicle structures composed by thin-wall beam components (elements), in Symposium on vehicle crashworthiness including impact biomechanics, ASME winter annual meeting New York, ASME, AMD 79 (1986), pp. 141–154.
- Y.M. Moon, T.H. Lee, and Y.P. Park, Development of an automotive joint model using an analytically based formulation, J. Sound Vib. 220 (1999), pp. 625–640.
- D. Mundo, R. Hadjit, S. Donders, M. Brughmans, P. Mas, and W. Desmet, Simplified modelling of joints and beam-like structures for BIW optimization in a concept phase of the vehicle design process, Finite Elem. Anal. Des. 45 (2009), pp. 456–462.
- NHTSA, Laboratory Test Procedure for FMVSS 216a, Roof Crush Resistance. FMVSS 216; available at http://www.nhtsa.gov/DOT/NHTSA/Vehicle%20Safety/Test%20Procedures/Associated%20Files/TP-216a-00.pdf.
- NHTSA, Laboratory Test Procedure for New Car Assessment Program Frontal Impact Testing; available at http://www.safercar.gov/staticfiles/safercar/NCAP/Frontal_TP_NCAP.pdf.
- E. Nikolaidis and M. Zhu, Design of automotive joints: Using neural networks and optimization to translate performance requirement to physical design parameters, Comput. Struct. 60 (1996), pp. 989–1001.
- P.E. Nikravesh, I.S. Chung, and R.L. Benedict, Plastic hinge approach to vehicle crash simulation, Comput. Struct. 16 (1983) pp. 395–400.
- M. Pahlavani and J. Marzbanrad, Crashworthiness study of a full vehicle-lumped model using parameters optimisation, Int. J. Crashworthiness 20 (2015), pp. 573–591.
- A.M. Shahhosseini and G. Prater, Beam-like major compliant joint methodology for automotive body structures, in ASME International Mechanical Engineering Congress and Exposition, Vancouver, 2010, pp. 77–83.
- Visual Crash Studio, Crash Academy, Impact Design; available at http://impactdesign.pl/crash-academy/.
- Visual Crash Studio, Impact Design, Michalowice, Poland, 2014; software available at http://impactdesign.pl/visual-crash-studio/.
- T. Wierzbicki and W. Abramowicz, CRASH-CAD - A computer program for design of columns for optimum crash, SAE Technical Paper 900462, 1990.
- T. Wierzbicki and W. Abramowicz, On the crushing mechanics of thin walled structures, J. Appl. Mech. 50 (1983), pp. 727–734.