?Mathematical formulae have been encoded as MathML and are displayed in this HTML version using MathJax in order to improve their display. Uncheck the box to turn MathJax off. This feature requires Javascript. Click on a formula to zoom.
Abstract
SUVs are taken as the research object to develop the side deformation barrier with Chinese characteristics. By extracting characteristic parameters of typical SUVs, honeycomb aluminium barrier and trolley development objectives are defined and theoretical analysis are applied to guide the selection of barrier materials. Based on the dynamic load-cell wall test of barrier trolley, the evaluation method of honeycomb aluminium calibration performance is proposed. Through car-to-car crash test, a new verification method based on the deformation of the body structure and the height distribution of the crash load force is formatted. The results show that the new moving deformation barrier’s mechanical properties meet the design specifications, the prototype is stable in deformation modes and it can characterise the appearance and stiffness characteristics of SUV.
1. Introduction
As an important test device in collision test, side deformable barrier represents the stiffness level of the collision vehicle and is the main scale of impact strength. In the development of collision test standards in Europe and the United States, deformable barrier conforming to the characteristics of vehicles in the specific area has been developed and applied to simulate the frontal and side impact accidents of vehicles.
In 1990, US Federal Motor Vehicle Safety Standard (FMVSS) 214 was revised, and the honeycomb aluminium barrier used in the standard was developed in the 1980s [Citation1]. The total trolley mass was 1367 kg, and the height of the barrier and bumper bottom from the ground were 280 mm and 330 mm respectively, representing the weight of passenger cars and light trucks in the US [Citation2]. In 2003, Insurance Institute for Highway Safety (IIHS) developed a new barrier based on FMVSS214, which was used to simulate the performance of pickup trucks and sport utility vehicles (SUVs) [Citation3, Citation4]. The overall height of the barrier was increased by 200 mm and the ground clearance was increased by 100 mm. The bumper unit adopted a 24.5 degree chamfered plane profile that represented typical pickup and SUV bumper geometry. In 2019, IIHS research test found that when IIHS moving deformable barrier (MDB) had a side impact with a vehicle, some behaviours of the affected vehicle did not match those in a two-vehicle collision [Citation5], which was mainly shown in two aspects. Firstly, different dynamic responses of the affected vehicle caused by the offending vehicle and the MDB were got. In MDB collision, the affected vehicle rotates away from it, while in the collision between two vehicles, the affected vehicle rotates in the direction of the offending vehicle. Secondly, for the vertical deformation mode of B-pillar, when MDB collides with a vehicle, the bottom deformation of B-pillar is small, while the top deformation is significant. When two vehicles collide, b-pillar deformation pattern shows an opposite trend. Whether the offending vehicle involved is a pickup, SUV, or sedan, the ‘M’ shape of the affected vehicle body is deformed. In contrast, MDB produces a relatively uniform body deformation pattern for the affected vehicle. Therefore, a new version of IIHS-MDB 2.0 was introduced in 2020, which can solve the above problems well [Citation6].
In 2001, Economic Commission for Europe found that MDB used in ECE R95 could not fully represent the front characteristics of European vehicle models, nor could it effectively assess the occupant damage on the front and rear seats at the same time [Citation7–9]. Therefore, European Enhanced Vehicle-safety Committee (EEVC) Working Group 13 for Side Impact Protection began to study the new barrier [Citation10–12]. After several rounds of improvement, the performance requirements of the final version 3.9 of the Advanced European
Mobile Deformable Barrier (AE-MDB) were published and applied in European New Car Assessment Programme (EURO-NCAP) 2017 version regulations [Citation13, Citation14].
EEVC-2000 MDB and AE-MDB are respectively referenced in the side impact tests of Chinese side impact regulations GB20071-2006 and China New Car Assessment Program(C-NCAP) 2021. C-NCAP proposed a new barrier development plan based on road accidents and vehicle characteristics in China, which was expected to be applied in the 2024 version of the regulations.
Therefore, to more truly reflect road vehicle collision in China and make collision test results more close to reality, the development, verification and application of honeycomb aluminium barrier performance have positive social significance to improve the safety level of automobile collision and reduce the casualty rate of passengers in actual accidents.
2. Extraction of vehicle characteristic parameters
2.1. Development objectives
Based on China In-Depth Accident Study in side impact accident cases from 2011 to 2020, accident characteristics were analyzed [Citation15].
According to the existing standards and regulations and the side impact test parameter settings in the NCAP test, the typical side impact conditions are defined. The side circumference of the struck vehicle must involve collision deformation. The angle formed by the longitudinal centre line of the vehicle during collision should be greater than 45°. The case of head-to-head angle collision, head-to-end angle collision or same-direction scratch does not belong to the research content of this paper.
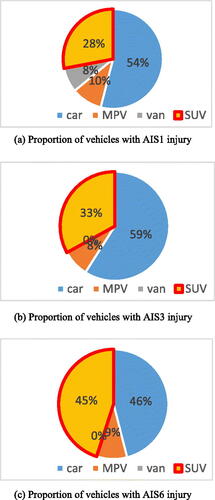
A total of 103 cases meeting the definition of working conditions were evaluated according to the AIS (Abbreviated Injury Severity) standard developed by the American Medical Association in the early 1970s for automotive safety, which classifies the severity of human injury into Class 1 (mild), Class 2 (moderate), Class 3 (severe), Class 4 (serious), Class 5 (critical) and 6 (extremely serious, non-treatable). There were 95 cases of AIS1 or higher casualties and 29 cases of AIS3 or higher serious injuries or fatalities. Statistical results in show that the proportion of SUVs involved in accidents gradually increases with the increase in casualties of the occupants in the struck vehicles. Therefore, SUV is determined as the research object.
Figure 1. Relationship between occupant casualty and offending vehicle type.
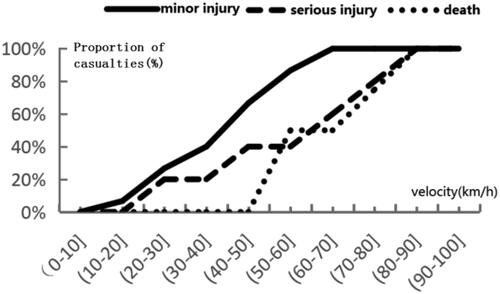
Among the 103 accidents, 26 accidents involved SUV (or pickup). The vehicle kinematic parameters were obtained from vehicle event data recorder (EDR) system storage data, site survey data, and road surveillance video screen data, and the crash scenes were reproduced by PC-CRASH software. The crash speed of 10 accidents was investigated based on the spot survey, and the crash speed of the other 16 accidents was simulated by simulation reproduction. The relationship between the speed of the offending vehicle and the injury of the struck vehicle occupant is shown in . It can be known that when the speed of the offending vehicle is 60 km/h, there are 86.67% of minor injury, 40% of serious injury and 50% of death of the affected vehicle occupants. Therefore, 60 km/h is taken as the target speed of barrier development, which is translated into 40 km/h, the equivalent speed of barrier trolley impacting the rigid wall [Citation16].
Figure 2. Speed distribution of the affected vehicles.
2.2. Front-end stiffness
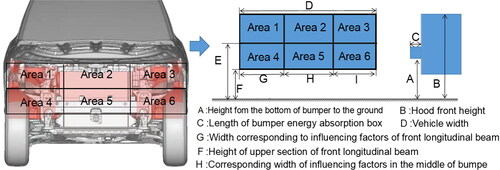
The main longitudinal structure of a typical front-end structure of SUV includes energy absorption structures such as upper beam, front rail, and sub-frame from high to low, and the main transverse structure includes radiator support frame, bumper beam, and sub-frame front beam. Therefore, six corresponding areas are divided according to the front end structure, among which area 4 and area 6 correspond to the area where the front rail is located, area 1 and area 3 correspond to the area where the upper beam is located, area 5 corresponds to the area where the middle of the bumper beam is located, and area 2 corresponds to the area where the middle of the radiator support frame is located ().
Figure 3. Vehicle collision structure & barrier design area division.
The impact load of the front-end and each area of the vehicle is collected with load cell barrier. In the front 100% rigid wall test of the vehicle, the impact force-deformation characteristics generated during the collapse of the front part of the vehicle at the speed of 50 km/h are similar to the curve at the speed of 40 km/h [Citation17]. Considering the test data acquisition, the test vehicle impacts the rigid load cell barrier head-on at a speed of 50 km/h. 128 load sensor units with the size of 125 mm × 125 mm are installed on the rigid barrier to collect the collision force in each area at the front of the vehicle. A acceleration sensor is installed on the b-pillar of the vehicle to measure and calculate the displacement of the vehicle during collision.
According to EquationFormula (1)(1)
(1) , data processing of collision force in divided areas is carried out:
(1)
(1)
where
is the weighted average of the collision force corresponding to the displacement point k in area j, and
is vehicle collision force corresponding to displacement point k in area j. j values 1,2,3… 6. k values 0,50,100,… 300(calculated by 50 mm deformation interval points).
is vehicle sales volume, and n is the number of models. An average curve with its standard deviations based on the curves of 25 SUVs were obtained (), and the average stiffness curve and the average impact stiffness of each divided area were obtained according to EquationFormula (1)
(1)
(1) , which were used as the basis for honeycomb aluminium development ().
Figure 4. An average curve with its standard Deviations based on the curves of 25 SUVs.
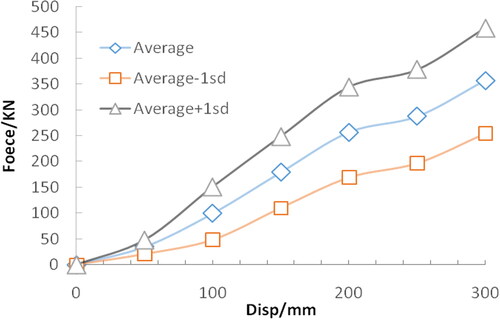
Figure 5. Corresponding size relation in bumper area.
According to Equationformula (2)(2)
(2) , the collision energy of each divided area in the collision process is calculated and obtained:
(2)
(2)
In EquationFormula (2)(2)
(2) , t0 is the time when the vehicle begins to collide, t1 is the corresponding time when the crush is 300 mm in the corresponding area [Citation18], and dn is vehicle crushing deformation.
The equivalent impact stress of each area can be calculated according to the impact energy and area:
(3)
(3)
where A is the area of each divided area, D is the displacement of collision direction, and the value is 300 mm.
shows the impact energy and equivalent impact stress in each area. Results show that areas 4 and 6 are the main energy absorption areas in the collision process, which should be the focus of attention in the design process of honeycomb aluminium.
Table 1. The average dissipated energy and stress distribution in each area of a vehicle.
2.3. Exterior dimensions
In , the bumper structure’s bottom ground clearance corresponds to the lower vehicle bumper height from the ground A. The collision barrier’s overall height corresponds to the vehicle’s hood height B. The bumper’s longitudinal structure length corresponds to the length C of energy absorbing box on vehicle’s bumper, and the width of the collision barrier corresponds to the width of the vehicle D. The upper end of areas 4 and 6 corresponds to the upper end height E of the vehicle’s front rail.
Table 2. Simplified dimensions of vehicle front-end collision structure.
The lower end of areas 4 and 6 corresponds to height F of the sub-frame influence factor and the width of areas 4 and 6 corresponds to the width G or I of the front rail influence area. The width of area 5 corresponds to the width H of the middle of the bumper influence area. For height F corresponding to sub-frame influencing factor, the comprehensive influence of vehicles with and without sub-frame should be considered:
(4)
(4)
where J is the ground clearance of the lower end of the front rail, K is the ground clearance of the upper end of the sub-frame, and
、
is the corresponding proportional factors, which are determined by the proportion of vehicles equipped with sub-frame.
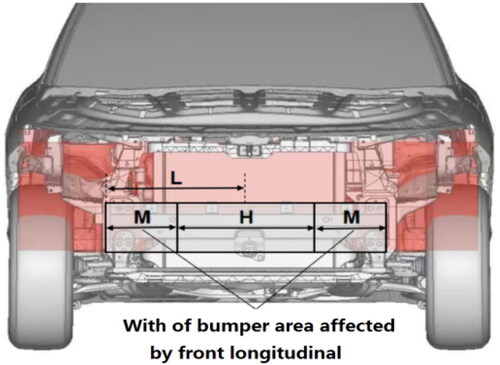
H is the width of the bumper’s middle influence area, which should be the corresponding bumper area outside of the front rail impact area:
(5)
(5)
where L is the distance between the outer side of the front rail and the longitudinal centre of the vehicle and M is the width of the bumper area affected by the front rail collision, which can be obtained by the following method. The corresponding relationship between L, M and H is shown in .
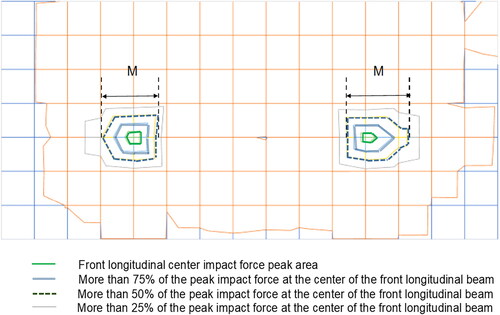
M corresponds to the bumper area affected by the front rail, which can be obtained by the cloud map of vehicle collision force distribution. Take the moment when the front rail collision force reaches its peak value and extract the force wall cloud area corresponding to more than 50% of the peak value of the front rail centre collision force. The width of this area is the width M of the bumper area affected by the front rail collision, as shown in below:
Figure 6. Schematic diagram of corresponding areas of collision force wall.
G and I are the width of the affected front rail area. Based on the relationship among G, I, overall width D and width H of the middle bumper influence area, it can be concluded that:
(6)
(6)
According to the statistics of the exterior dimensions of 25 vehicle types, the average values of the corresponding dimensions of each vehicle can be obtained as follows. Since the numbers of vehicles with and without sub-frames are basically the same, and ,
are both 0.5, thus the size of collision barrier can be further defined.
3. Performance parameters design of honeycomb aluminium barrier
3.1. Selection of honeycomb cellular material
Honeycomb aluminium is formed by bonding and stretching aluminium foil [Citation19–23]. By proper consolidation, the stretched aluminium material can form a honeycomb hexagonal porous structure [Citation24–26].The aluminium foil, adhesive and surrounding air are regarded as a whole composite material with strong anisotropy [Citation27–29]. Based on the yield criterion of Tresca model [Citation27], static compressive stress of honeycomb material can be calculated as follows:
(7)
(7)
Where is the equivalent plastic flow stress of metal material, d is the thickness, and L is the side length of regular hexagon.
According to the stress distribution in each collision zone in , the corresponding honeycomb aluminium core parameters in each area can be initially selected for application (see ).
Table 3. Parameter settings of selected materials in each area of barrier.
3.2. External dimensions design
According to the data in , the specification parameters of honeycomb aluminium barrier are determined as shown in . The overall width of honeycomb aluminium is 1800 mm, the height is 550 mm, and the thickness of crushing direction is 600 mm. The front end is designed with 45° chamfering. A bumper, collapse layer and energy buffer layer constitute the impact direction, shown in . The explosion diagram is shown in .
Figure 7. Exterior dimensions of honeycomb aluminium.
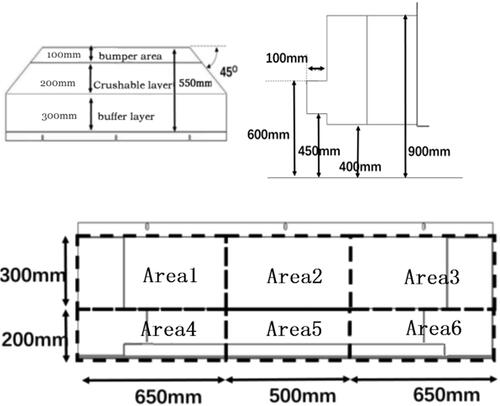
Figure 8. Explosion diagram of the honeycomb aluminium.
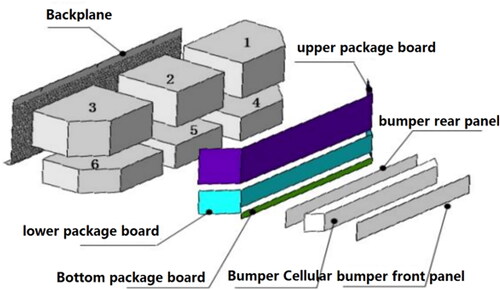
The lower end of the bumper is 450 mm high from the ground, the height is 150 mm, and the thickness in the crushing direction is 100 mm. The lowest part of the collapse layer and the energy buffer layer is 400 mm above the ground. The height of crushing layer is 500 mm, and the thickness of crushing direction is 200 mm. The height direction of the energy buffer layer is 500 mm, and the thickness of the collapse direction is 300 mm.
3.3. Honeycomb aluminium structure design
The first 80 mm of the impact force before displacement in the total average stiffness curve of SUV is taken (). According to the bumper’s exterior dimensions, the stress value is 320 kpa calculated according to Equationformula (2)(2)
(2) . Constant honeycomb aluminium strength design is adopted.
The crushing layer is the main energy absorbing structure in the process of side impact test. The upper and lower parts are divided into six energy absorbing areas, each of which is composed of hexagonal honeycomb cells. The stiffness curve should meet the requirements of the stiffness curve. The lower areas 4 and 6 correspond to the positions of the SUV front rail, and the rigidity is relatively hard. The upper area is relatively soft. Areas 4 and 6 have the same energy absorption performance, while areas 1 and 3 have the same energy absorption performance. Constant force deformation mode is adopted in areas 2 and 5, while gradual force deformation mode is adopted in other areas. The honeycomb aluminium blocks in corresponding areas are treated by corrosion process with soft front and hard back. The thickness gradually thins from front to back. A 2 mm-thick board is stuck on the forefront of the upper and lower layers. All six pieces of honeycomb aluminium are glued to a 3 mm thick back plate with ventilation holes by using polyurethane adhesive. The upper mounting flange is vertical and the lower mounting flange is bent to 90°.
Energy buffer layer is set with equal stiffness. According to the calculation method of bumper stiffness, the corresponding stiffness value at 300 mm in the corresponding average stiffness curve of each area is taken as the calculation basis, and constant stress design is adopted.
3.4. The trolley mass determin
Select SUVs with sales data from 2017 to 2021 in the market for vehicle mass statistics. There are 20 large SUVs, 76 medium SUVs, and 110 compact SUVs show the trend of SUV mass over the years.
Figure 9. Mass of SUVs develops with years.
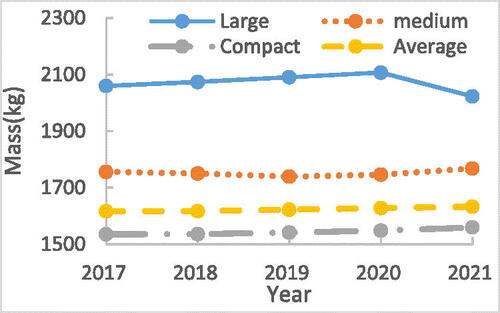
Figure 10. Diagram of centre of gravity of the trolley determination method.
The masses of SUVs are analyzed. The trend of SUV average mass over the years is showed in .
According to the above data, the average curb weight of the SUV is 1 622 kg. Considering that the driver’s mass is about 75 kg, the mass of the mobile barrier trolley is set to 1700 kg.
4. Honeycomb aluminium calibration test verification
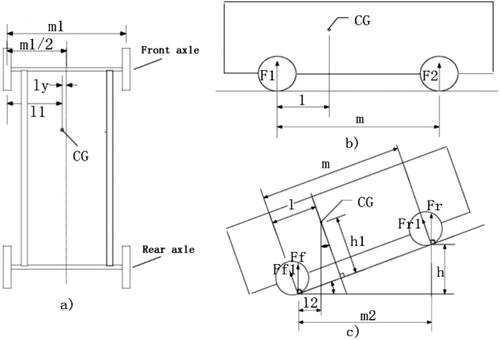
Honeycomb trolley consists of honeycomb aluminium and mobile trolley. The total mass of the trolley is 1700 kg ± 20kg. The method to determin the centre of gravity of the trolley is shown in .
The distance from the centre of gravity to the longitudinal mid-vertical plane,to determine the y-direction positioning value of the centroid, ly (9a), is:
(8)
(8)
Where F3 is the sum of the front and rear wheel loads on the left side, F4 is the sum of the front and rear wheel loads on the right side, and l1 is the distance from the centre of gravity to the left wheel, m1 is the track width.
The distance from the centroid to the front axle, i.e. the x-direction positioning value l (9b) of the centroid, is
(9)
(9)
Where F1 is the front axle load, F2 is the rear axle load, l is the distance from the centre of mass to the centre of the front axle, and m is the wheelbase.
The distance from the centre of gravity to the ground, that is, to determine the z-direction positioning value h1 (9c) of the centroid, is
(10)
(10)
Where Ff is the front axle load, Fr is the rear axle load, l2 is the distance from the centre of mass to the centre of the front axle, and h is the height from the rear wheel to the ground.
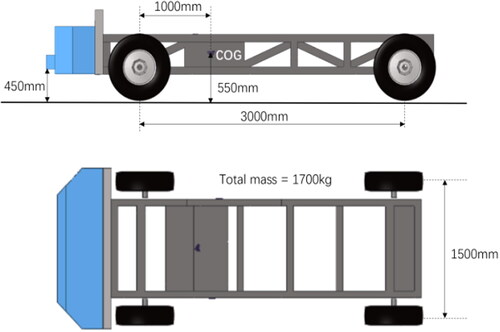
Honeycomb trolley’s centre of gravity is within 10 mm of the longitudinal vertical plane, 1000 mm ± 30mm from the front axle and 550 mm ± 30mm from the ground. The distance from the front of the collision block to the trolley’s centre of gravity is 2000 mm ± 30mm; the wheel base is 1500 mm ± 5mm, as shown in . A brake device is installed on the trolley to avoid secondary collision between the barrier trolley and the test car in the collision process.
Figure 11. Schematic diagram of side barrier trolley.
The honeycomb aluminium trolley hits the rigid barrier at a speed of 40 km/h [Citation7], and a force measuring wall is installed in the front of the rigid barrier to verify the dynamic mechanical properties of honeycomb aluminium.
4.1. Evaluation indicators
4.1.1. Dynamic energy
Each aluminium block and the entire movable and deformed barrier energy are calculated according to EquationFormula (11):
(11)
(11)
In EquationFormula (11), t0 is the time when the barrier crash the loadcell wall, t1 is the time when the trolley stops, and Smean is the deformation of the impact block.
The change of total energy is compared with the change of kinetic energy EK of moving deformble barrier. EK is calculated according to EquationFormula (12)(12)
(12) :
(12)
(12)
In Equationformula (12)(10)
(10) , Vi is the impact velocity, and M is the mass of the entire moving deformble barrier.
The change in the total energy is compared with the change in the kinetic energy of the moving deformble barrier EK. The total energy is required to be equal to EK±5%.
4.1.2. Deformation mode
The residual amount of the total impact deformation can refer to the EEVC design requirements for AE-MDB, which requires that the residual amount is greater than 160 mm [Citation18].
4.1.3. Average height of impact force
In the process of collision between MDB and vehicle, the average height of barrier impact force (AHOF) affects the motion posture of the affected vehicle: If AHOF value is the same as the height of centre of gravity (HCG) of the affected vehicle, the affected vehicle will not rotate. If AHOF is greater than HCG, the vehicle will rotate away from the MDB barrier. When AHOF is lower than HCG, and the vehicle will rotate in the opposite direction. Therefore, AHOF value of MDB is taken as a verification index of dynamic test. Considering barrier performance design, the height of the average impact force AHOF400 at the displacement of 25 mm to 400mm from the beginning of the impact was calculated for verification. The calculation formula is as follows:
(13)
(13)
(14)
(14)
where d is the vehicle displacement,
is the collision force corresponding to the i force measuring unit,
is the height of the corresponding force measuring unit from the ground, n is the number of force measuring units of collision force barrier, and
is the corresponding collision force.
AHOF400 defines the average impact height of the vehicle’s front end impact force. The average AHOF400 of the above 25 SUVs was calculated and 513 mm was obtained, which was used as the basis for the barrier development.
4.1.4. Dynamic mechanical properties channel
For the vehicle force-displacement curve, the linear channel of dynamic mechanical properties is obtained with the use of the following formula:
(15)
(15)
where
is the area between the linear curve and the force-displacement curve. N is the number of data points, and
is the slope of the line.
and
are the vertical intercepts of the corresponding line respectively.
and
are the coordinate values in X and Y directions of the corresponding data points. The smaller
is, the closer the linear curve is to the force - displacement curve. Slope
and intercept
in corresponding linear curves are got by calculating the partial derivative of
Make the upper and lower limit curve tangent to the force - displacement curve through the translation of the curve up and down. The corresponding intercepts
and
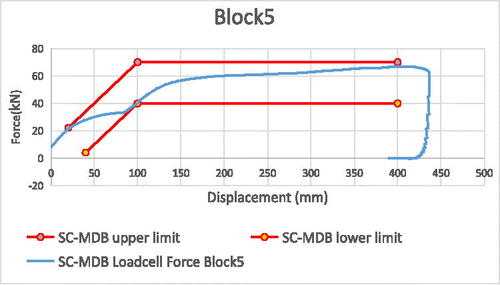
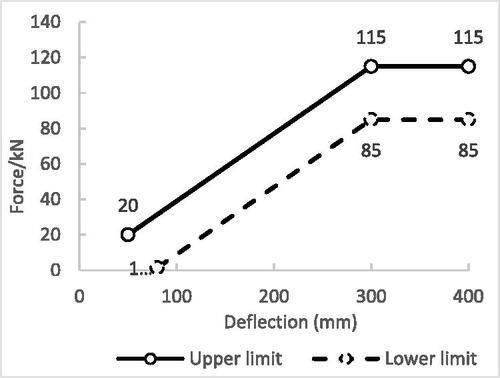
are obtained respectively. Thus the upper and lower limit of force - displacement curve channel can be defined. The overall channel and the upper and lower limit performance requirements of areas 4or 6 channel are shown in . In , point A - point F is the curve characteristic point.
Figure 12. Barrier’s overall performance channel requirements.
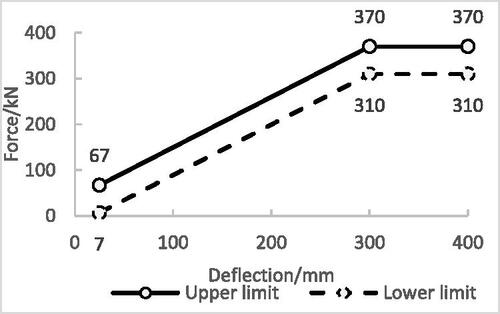
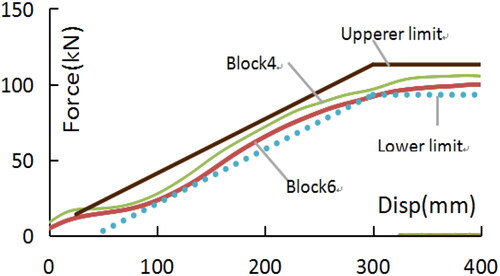
Figure 13. Channel 4/6 performance and channel requirements.
4.2. Barrier test verification
4.2.1. Dynamic energy
According to EquationFormula (11), the total impact energy En of honeycomb aluminium is 102.90 kJ, and the kinetic energy EK of moving deformble barrier is 105.74 kJ, meeting the requirement of EK±5%. The impact energy of each area is shown in .
Table 4. Total and area collision energy.
4.2.2. Deformation mode
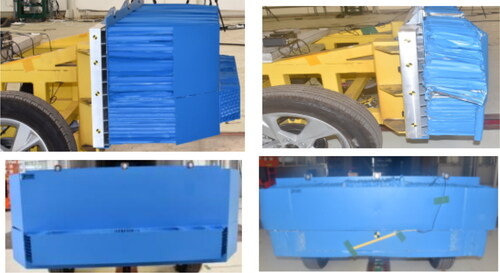
shows the comparison before and after the barrier test. After the test, the residual thickness of honeycomb aluminium is 170 mm, which meets the test requirements of more than 160 mm.
Figure 14. Comparison of honeycomb aluminium barrier before and after test.
4.2.3. Honeycomb aluminium stiffness
The total impact force-displacement relationship of honeycomb aluminium is shown in , and the force-displacement curves of areas 4 and 6 is shown in . The total stiffness of honeycomb aluminium and the stiffness curves of all divided area within the designed range, meeting the design requirements ().
Figure 15. Overall impact stiffness of honeycomb aluminium barrier.
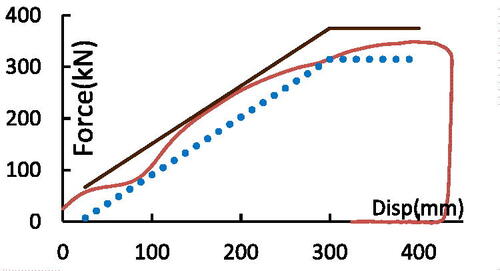
Figure 16. The impact stiffness of area 4 or 6 in honeycomb aluminium barrier.
4.2.4. Average height of impact force
According to EquationFormula (10), the HOF(d) curve corresponding to the crushing stage of the improved barrier was obtained. The value of HOF (d) is put into Equationformula (13)
(11)
(11) and AHOF400 value is 524 mm. It is slightly higher than the average valueof the tested SUV models (513mm).
5. Real vehicle test verification
In car-to-car test, a bullet vehicle perpendicularly impact on the side of a stationary target vehicle at a speed of 60 km/h. The centreline of bullet vehicle shall align with the 250 mm backward of target vehicle R-point position.Vehicle1, vehicle 2, vehicle3 and barrier trolleys were used as bullet vehicles respectively.Vehicle1 is a compact SUV, Vehicle2 is a medium-sized SUV for honeycomb aluminium design benchmark, and Vehicle3 is a large SUV. The same B-class car was selected as the target vehicle in the four tests.The front-end structures of the SUVs are shown in .
A Hybrid III 50th male dummy was installed at the driver’s position of the bullet vehicle, and a WorldSid 50th male dummy was installed at the driver’s position of the crash side of the target vehicle and SID-IIs female dummy was installed at the second row of the crash side.
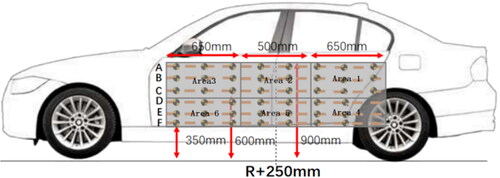
R Point was used as a reference point to mark vehicle feature points on the side of the target vehiclewith vertical intervals of 125 mm down to the threshold and upward to the highest point of the door panel and with horizontal intervals of 100 mm. Six evaluation areas are delineated on the target vehicle model. The upper edge of areas 1, 2 and 3 is 900 mm from the ground, and the lower edge is 600 mm from the ground. The upper edge of areas 4, 5 and 6 is 600 mm from the ground, and the lower edge is 350 mm from the ground. Area 3 is symmetrical with area 1, and area 4 is symmetrical with area 6. The width of areas 2 and 5 is 500 mm, and the width of areas 1, 3, 4 and 6 is 650 mm. In each area, from top to bottom in the horizontal direction, feature points on the car body were marked for the measurement of car body deformation before and after the test, as shown in lines A, B, C and D in the schematic diagram. The coordinates of the body feature points were measured before and after the collision test, and the body deformation of the corresponding feature points was obtained ().
Figure 17. Front-end structure of typical SUVs. (a) SUV 1,2 and (b) SUV 3.

Figure 18. Schematic diagram of evaluation area division.
5.1. Evaluation Indicators
In order to intuitively and quantitatively compare the proximity between the side impact barrier and the actual car-to-car test, a body structure deformation difference index (BSI) and structural height index (SHI) are proposed for data analysis.
5.1.1. Body structure deformation index BSI
For a single evaluation area, the body structure deformation difference index is calculated according to the following steps:
For each feature point in the area, the absolute difference between the body deformation value
caused by the collision barrier and the body deformation value
caused by the real vehicle test was calculated.
(16)
(16)
Calculate of
in row i in the sub-evaluation area.
(17)
(17)
For this sub-evaluation area, compare each line’s and take the maximum value to obtain the
value of this sub-evaluation area.
(18)
(18)
By weighting each sub-evaluation area, the body structure deformation difference index in the whole evaluation area can be obtained.
(19)
(19)
The smaller the index is, the closer the impact honeycomb aluminium is to the benchmarking vehicle in terms of overall body structure deformation.
5.1.2. Structural height index SHI
The deformation distribution of the impacted honeycomb aluminium should be consistent with that of the benchmarking vehicle. Besides, the corresponding overall structure height should also be consistent with that of the benchmarking vehicle. The structural height index SHI is calculated with the body deformation and the height of feature points, and the steps are as follows:
The structural height of each sub-evaluation area of the barrier can be obtained by using the following formula according to the deformation value
and corresponding height
of the corresponding feature point.
(20)
(20)
The structural height of each sub-evaluation area, for the actual vehicle, can be obtained by using the following formula according to the deformation value
and corresponding height
of the corresponding feature point.
(21)
(21)
Calculate the absolute value of the difference value of
and
in each sub-evaluation area.
(22)
(22)
The six sub-evaluation areas’ is calculated and weighted separately.
(23)
(23)
The smaller the is, the closer the impact honeycomb aluminium is to the benchmarking vehicle in terms of overall impact height.
5.2. Evaluation results
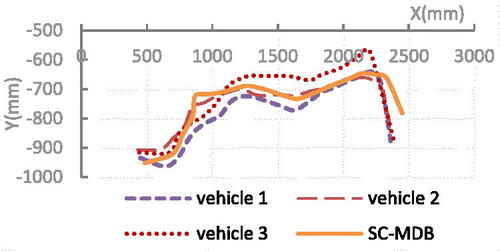
shows the side deformation modes of the struck vehicle corresponding to 4 and 6 evaluation areas in the four tests. See Annex ACitation6-ACitation12 for the results of other position deformation modes.
Figure 19. Horizontal structural deformation value of the affected vehicle D lever line.
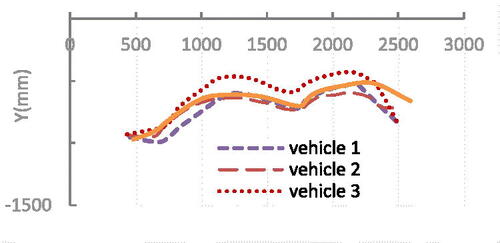
Figure 20. Horizontal structural deformation value of the affected vehicle E lever line.
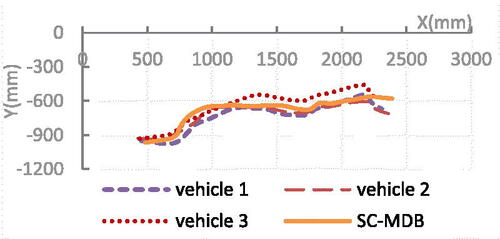
Figure 21. Horizontal structural deformation value of the affected vehicle F lever line.
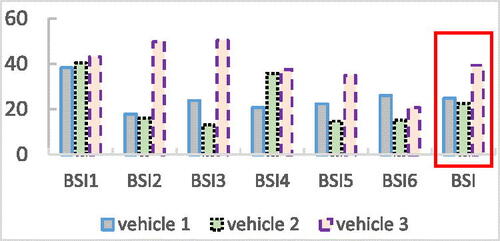
shows body structure deformation BSI. By analysing the difference index of body structure deformation between vehicle1, vehicle2 and vehicle3, and the side impact barrier, it can be concluded that the side impact barrier is closer to vehicle 2 in terms of the overall structure deformation.
Figure 22. Comparative analysis of body structure deformation BSI.
shows the body structure height SHI. Comparative analysis of structural height index between vehicle1, vehicle2 and vehicle3 and the side impact barrier also shows that the overall structural height of the side impact barrier is closer to that of vehicle 2.
Figure 23. Comparative analysis of structure height SHI.
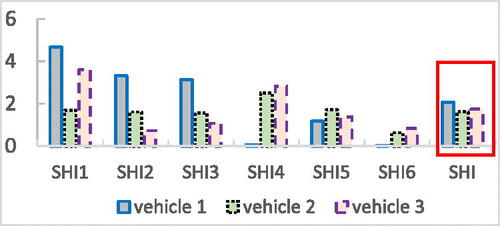
Therefore, the real vehicle test results show that for the same target vehicle, side impact barrier is closer to the benchmarking vehicle2, which proves the effectiveness of barrier impact performance.
6. Discussion
The New MDB originate from compact SUVs and medium-sized SUVs in the Chinese market. Its external dimensions, mechanical performance characteristics, and dynamic corridors are significantly different from MDB of Europe and the United States. The main differences are as follows:
Comparision with FMVSS 214 MDB
The development of FMVSS 214 MDB originate from the average level of front stiffness of American vehicles around 1980, with a constant stiffness of 0.31 MPa for the main part of the honeycomb aluminium. At the same time, FMVSS 214 was equipped with high strength (1.17 MPa) bumper due to the characteristics of the vehicles at that time. Its appearance, size, and stiffness distribution no longer meet the current actual situation of SUVs in China.
2. Comparision with IIHS V2.0 MDB
There is a specific and distinct development orientation in the process of IIHS V2.0 MDB. It represents the large SUVs and pickup trucks in the United States. IIHS V2.0 MDB is with high-strength honeycomb aluminium (1.1 MPa) arranged on both sides of the lower portion of the MDB to simulate the rigid front longitudinal structure of large SUVs and pickup trucks, which is much higher than the actual stiffness of Chinese SUVs.
3. Comparision with ECE R95 MDB and AE-MDB
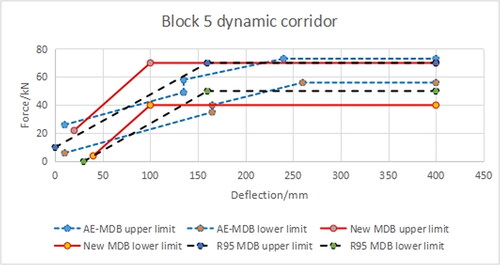
In order to better simulate the deformation of the front end structure of the vehicle, the new MDB is with a gradual stiffness in block 4/6 (corresponding area of the vehicle longitudinal beam) and block 1/3 (corresponding area of the vehicle upper side beam), and is with a constant stiffness in the middle upper and lower parts. ECE R95 MDB and AE-MDB represent the average vehicles in Europe around 1970 and 2000 respectively. Although progressive stiffness is also used, there are significant differences in mechanical performance limits and stiffness distribution due to the different prototype vehicles. As shown in , the overall stiffness of the new MDB is greater than that of EEVC MDB and AE-MDB.The stiffness of different blocks are as shown in . In the block 1 or 3, the stiffness level of the new MDB is higher than ECE R95 MDB, slightly lower than AE-MDB and basically at the same level. In block 2, the New MDB is with constant stiffness, which is basically at the same level as the ECE R95 MDB and AE-MDB. In block 4 or 6, the new MDB represents compact SUVs and medium-sized SUVs. The new MDB stiffness level is much higher than that of AE-MDB and ECE R95 MDB. In block 5, the new MDB is with constant stiffness, which is basically at the same level as the AE-MDB and ECE R95 MDB.
Figure 24. Comparison of the Full barrier dynamic corridor.
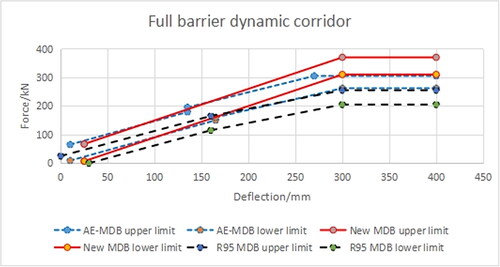
Figure 25. Comparison of the block 1/3 dynamic corridor.
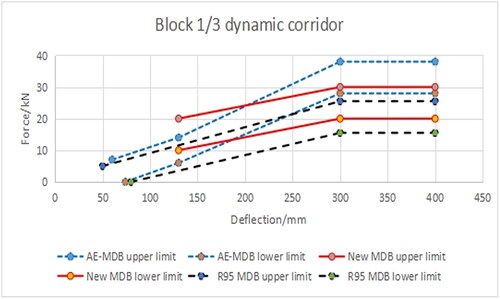
Figure 26. Comparison of the block 2 dynamic corridor.
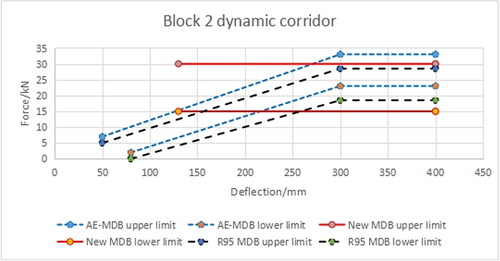
Figure 27. Comparison of the block 4/6 dynamic corridor.
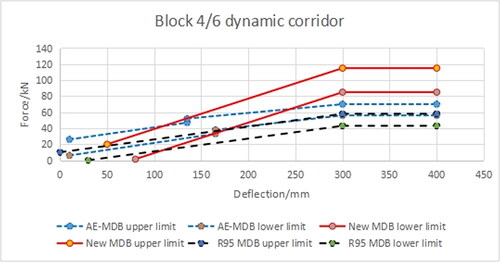
Figure 28. Comparison of the block 5 dynamic corridor.
Therefore, there is obvious positive development characteristics of New MDB. Its appearance, size, and stiffness are more in line with the current characteristics of actual road SUVs in China.
7. Conclusion
Based on traffic accident data analysis in china, it is found that in side impact accidents, with the increase of casualties of the occupants in the vehicles, the proportion of SUV in accidents gradually increased. So SUV are taken as the target of honeycomb aluminium development.
By extracting characteristic parameters of typical SUVs, the development objectives of honeycomb aluminium barrier and trolley are defined, and theoretical analysis is applied to guide the selection of barrier materials.
The evaluation method of honeycomb calibration performance channel is proposed by means of honeycomb aluminium trolley load-cell wall test, and honeycomb aluminium barrier structure is improved and verified. A real vehicle collision test verification method based on the deformation of body structure and height distribution of impact load force is proposed. The results show that with its mechanical properties meet the design specifications, the improved barrier is stable in deformation modes and it can characterise the appearance and stiffness characteristics of SUV.
Disclosure statement
No potential conflict of interest was reported by the author(s).
References
- NHTSA Technical Report. Evaluation of FMVSS 214 side impact protection dynamic performance requirement. DOT HS 809 004, 1999.
- NHTSA. Preliminary regulatory impact analysis: new requirements for passenger cars to meet a dynamic side impact test. Fmvss 214 Dot HS. 1988;807(220):21–22.
- Arbelaez RA. Comparison of eurosi-2 and si-iis in vehicle side impact tests with the IIHS barrier. SAE Technical Paper 2002-22-0019, Nov 13, 2002. doi: 10.4271/2002-22-0019.
- DakinG J , ArbelaezR A , NolanJ M ,et al.Insurance institute for highway safety side impact crashworthiness evaluation program: impact configuration and rationale. The 18th International Technical Conference on the Enhanced Safety of Vehicles, Paper Number 172, Nagoya, 2003.
- Mueller BC. Comparison of higher severity side impact tests of IIHS-good-rated vehicles struck by LTVs and a modified IIHS barrier with the current IIHS side test and real-world crashes. The 26th International Technical Conference on the Enhanced Safety of Vehicles, Paper Number 193, Eindhoven, 2019.
- IIHS. "IIHS Side Impact 2.0 Barrier Development", April , 2020.
- European Parliament. Council of the European Union, offificial. J. Eur. Commun. 1997;18:0007–0050.
- Roberts AK. Progress on the development of the advanced european mobile deformable barrier face(AE-MDB). Impact Tests, 2003.
- Seyer K. International harmonized research activities side impact group status report, 18th International Technical, Conference on the Enhanced Safety of Vehicles Conference, Paper Number 151, Nagoya, 2003. National Technical Conference on the Enhanced Safety of Vehicles Conference, Paper Number 126, Nagoya, 2003.
- Shkolnikov MB. Honeycomb Modeling for Side Impact Moving Barrier (MDB). international IS, 2002.
- ECE R95. Uniform provisions concerning the approval of vehicles with regard to the protection of the occupants in the event of a lateral collision, 2014.
- W. Xiuchun, W. Bo and T. Guohong, "Research on Finite Element Model of Moving Deformable Barrier in Side Impact, 2010 Third International Conference on Intelligent Networks and Intelligent Systems, Shenyang, China, 2010, pp. 450–454.
- EuroNCAP. "AE-MDB Specification Version 1.0", TB014, April 29, 2013.
- EuroNCAP. "SIDE IMPACT MOBILE DEFORMABLE BARRIERTESTING PROTOCOL", April, 2015.
- China automotive technology research center Co., ltd, Annual report on automobile safety in China. Soc Sci Literat Press. 2020;1(1):2–10.
- Vermissen T, Van Schijndel M. Development and evaluation of the side impact test procedure proposed by IHRA, The 20th International Technical Conference on the Enhanced Safety of Vehicles Conference, Paper Number 07-0310, Lyon, 2007.
- Hunter R, Fix R, Lee F, et al. Using force-displacement data to predict the EBS of car into barrier impacts, SAE Technical Paper,2016-01-1483,May4, 2016. doi: 10.4271/2016-01-1483.
- Hisajima K. A consideration on face barrier face specification of side impact MDB The 17th International Technical Conference on the Enhanced Safety of Vehicles Conference, Paper Number 221, Amsterdam, 2001.
- Ellway JD, van Ratingen M. The advanced European mobile deformable barrier specifification for use in EuroNCAP side impact testing. 23rd International Technical Conference on the Enhanced Safety of Vehicles (ESV) Seoul, Paper Number: 13-0069, Seoul, Republic of Korea, 2013.
- Zhu HX, Mills NJ. The in-plane non-linear compression of regular honeycombs. Int J Solids Struct. 2000;37(13):1931–1949. doi: 10.1016/S0020-7683(98)00324-2.
- Yamashita M, Gotoh M. Impact behavior of honey-comb structures with various cell specifications numerical simulation and experiment. Int J Impact Eng. 2005;32(1–4):618–630. doi: 10.1016/j.ijimpeng.2004.09.001.
- Zhang J, Zhang MF, Zhang J, et al. A study on the properties of honeycombs in vitro. Int Mech Sci. 1992;34(6):475–489. doi: 10.1016/0020-7403(92)90013-7.
- Buitragoa BL, Santiustea C, Sanchez-Saeza S, et al. Modelling of composite sandwich structures with honeycomb core subjected to high-velocity impact, compos. Struct. 2010;92(9):2090–2096.
- Pawlus W, Gunnar Robbersmyr KR, Karimi HR. Mathematical modeling and parameters estimation of a car crash using data-based regressive model approach appl. Math Model. 2011;35(10):5091–5107. doi: 10.1016/j.apm.2011.04.024.
- Roussarie M, Zeitouni R, Adalian C. Enhancement of side impact protection using an improved test procedure. In The 20th international technical conference on the enhanced safety of vehicles conference, Paper number 07-0245, Lyon, 2007.
- Sanchez M, Aparicio F. Application of a model of collision between cars to the analysis of compatibility and its sensitivity to the variation of certain design parameters. IJVD. 2004;34(2):142–157. doi: 10.1504/IJVD.2004.003898.
- Ueno M, Hatano K. Development of new generation mobile deformable barrier. The 20th International Technical Conference on the Enhanced Safety of Vehicles Conference, Paper Number 07-0299, Lyon, 2007.
- Zhang X, Zhang H, Wen Z. Experimental and numerical studies on the crush resistance of aluminum honeycombs with various cell confifigurations. Int J Impact Eng. 2014;66:48–59. doi: 10.1016/j.ijimpeng.2013.12.009.
- Zhao H, Elnasri I, Abdennadher S. An experimental study on the behavior under impact loading of metallic cellular materials. Int J Mech Sci. 2005;47(4–5):757–774. doi: 10.1016/j.ijmecsci.2004.12.012.
APPENDIX
Figure A1. Total average stiffness curve of SUV.
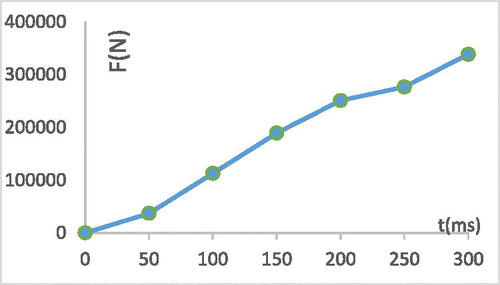
Figure A2. Area 1/3 average stiffness curve of SUV.
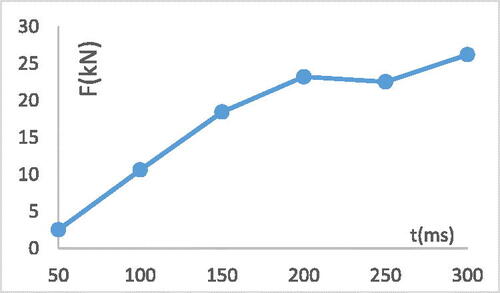
Figure A3. Area 4/6 average stiffness curve of SUV A4.
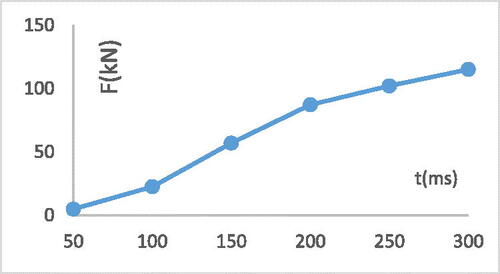
Figure A4. Area 2 average stiffness curve of SUV.
Figure A5. Area 5 average stiffness curve of SUV.
Figure A6. Horizontal structural deformation of vehicle B lever line.
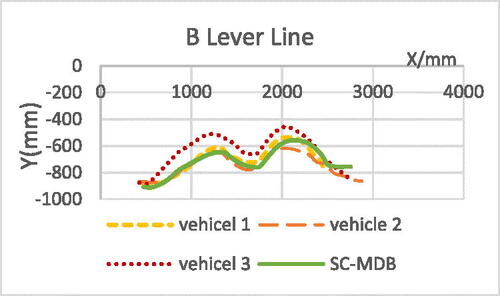
Figure A7. Horizontal structural deformation of vehicle C lever line.
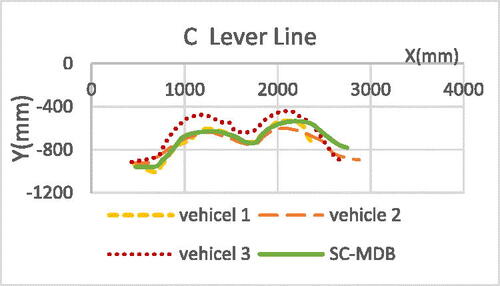
Figure A8. Horizontal structural deformation of vehicle D lever line.
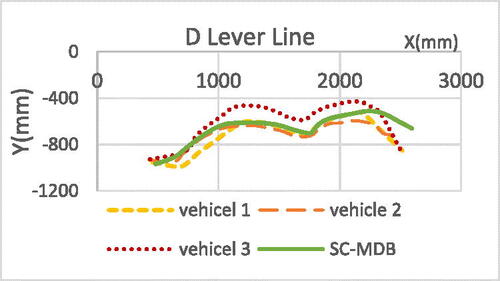
Figure A9. Horizontal structural deformation of vehicle a lever line.
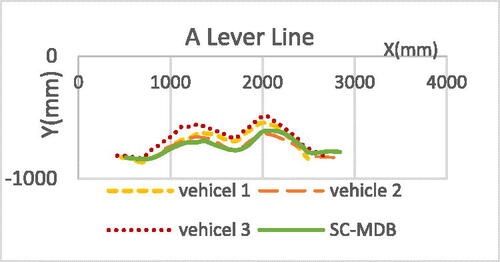
Figure A10. Horizontal structural deformation of vehicle E lever line.
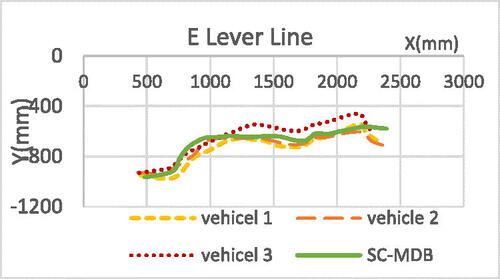
Figure A11. Horizontal structural deformation of vehicle F lever line.
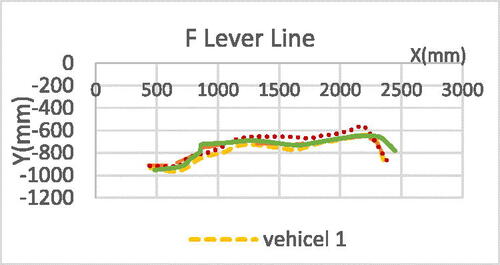
Figure A12. Horizontal structural deformation of vehicle G lever line.
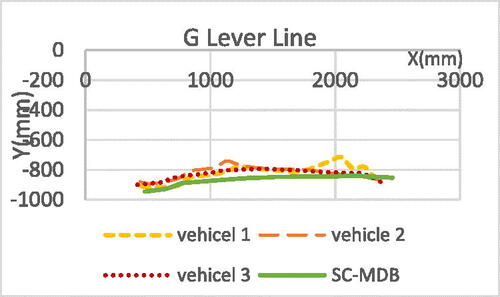
Figure A13. Total barrier force-displacement curve.
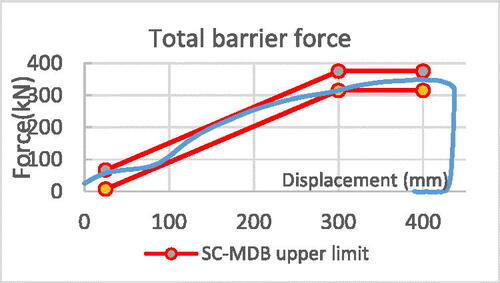
Figure A14. Block 4/6 force-displacement curve.
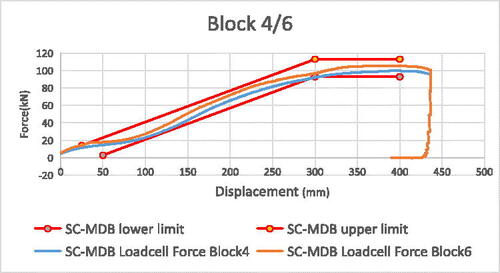
Figure A15. Block 1/3 force-displacement curve.
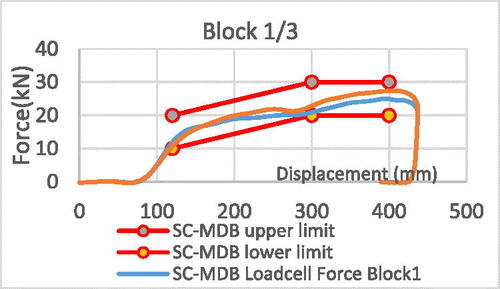
Figure A16. Block 2 force-displacement curve.
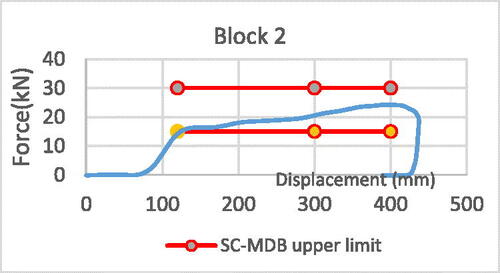
Figure A17. Block 5 force-displacement.