
Abstract
Purpose: This study aims to compare the accuracy of fertile window identification with the contraceptive app Natural Cycles against the Rhythm Method and Standard Days Method (SDM).
Materials and methods: Menstruation dates, basal body temperature (BBT), and luteinising hormone (LH) test results were collected anonymously from Natural Cycles app users. The fraction of green days (GDs) and wrong green days (WGDs) allocated by the various algorithms was determined over 12 cycles. For comparison of Natural Cycles and the Rhythm Method, 26,626 cycles were analysed.
Results: Natural Cycles’ algorithms allocated 59% GDs (LH, BBT) in cycle 12, while the fraction of WGDs averaged 0.08%. The Rhythm Method requires monitoring of six cycles, resulting in no GDs or WGDs in cycle 1–6. In cycle 7, 49% GDs and 0.26% WGDs were allocated. GDs and WGDs decreased to 43% and 0.08% in cycle 12. The probabilities of WGDs on the day before ovulation with Natural Cycles were 0.31% (BBT) and 0% (LH, BBT), and 0.80% with the Rhythm Method. The probability of WGDs on the day before ovulation was 6.90% with the SDM.
Conclusions: This study highlights that individualised algorithms are advantageous for accurate determination of the fertile window and that static algorithms are more likely to fail during the most fertile days
Introduction
Fertility awareness-based methods (FABM) to plan or prevent pregnancy are relying on the accurate identification of the fertile days in a woman’s menstrual cycle. Taking into account that the ovum survives for up to 24 h [Citation1] and that sperm can survive for up to five days in the female reproductive tract [Citation2], the fertile window is restricted to six days per cycle – the day of ovulation and the five preceding days.
There is a growing interest in digital solutions for FABM with many more mobile applications for menstrual cycle tracking entering the market [Citation3]. Very few of these apps provide a scientific basis for their functionality and contraceptive effectiveness or regulatory approval to be marketed as contraceptive methods [Citation4,Citation5]. Despite the lack of evidence, these fertility trackers often calculate and visualise a fertile window based on basic and generalised assumptions of the menstrual cycle physiology. This bears the risk that women will use fertility trackers for pregnancy prevention, potentially resulting in unintended pregnancies.
In the 1920s and 1930s, Hermann Knaus and Kyusaku Ogino independently described that the time between ovulation and the next menstruation is usually about 14 days long [Citation6]. This allowed the development of a mathematical formula to determine the fertile window, today known as the Calendar or Rhythm Method [Citation7]. Before a woman can calculate her fertile window and consequently use this method for contraception, she needs to record the starting dates of at least six cycles. To determine the first and last fertile day, she then subtracts 18 days from her shortest recorded cycle length and 11 days from her longest recorded cycle length, respectively [Citation8]. This is the most well-known of the FABM of family planning described by the WHO [Citation8]. It is worth mentioning that it remains unclear how many women are using this particular calculation when naming to the Calendar or Rhythm Method as their contraceptive method. However, they may be using cycle tracking devices that are based on this concept.
The Standard Days Method (SDM) is another well-known method for identifying the fertile window. It was developed by Georgetown University based on a dataset of over 7500 menstrual cycles gathered by the WHO [Citation9,Citation10]. The method requires typical cycle lengths within the range of 26–32 days. For women fulfilling these criteria, cycle day 9–18 are considered fertile. To avoid a pregnancy, the couple has to abstain from intercourse or use barrier methods for contraception during these 12 days of each cycle [Citation9].
Natural Cycles is a fertility awareness-based mobile application. In contrast to the Rhythm Method and SDM, the algorithm uses a symptom-based algorithm. In addition to analysing cycle-by-cycle menstruation data, it determines the fertile window based on basal body temperature (BBT) and optional urinary tests of luteinising hormone (LH). The prediction of the fertile window at the beginning of the cycle is based on averages of the previously detected ovulation days while also considering the following parameters and their uncertainties: ovulation day, cycle length, luteal/follicular phase length and average temperature. Ovulation is then retrospectively confirmed following detection of the BBT rise [Citation11].
This study aims to compare the accuracy of predicting the fertile window using different algorithms, including the contraceptive app Natural Cycles, the Rhythm Method, and SDM, to investigate the differences between a dynamic algorithm that adapts to and learns from the individual user, compared to static methods to determine the fertile window.
Materials and methods
Data collection, inclusion and exclusion criteria
Cycle data, i.e., menstruation dates, BBT measurements, and LH test results, were collected prospectively from Natural Cycles users with an annual subscription who registered between 1 September 2017 and 1 March 2019. The starting date was aligned with the release of the latest FDA cleared version 3.0 of the Natural Cycles algorithm. Participants of the study were between 18 and 45 years old and used the app with the intention to prevent a pregnancy. Included in the study were users who, during registration, had given their consent to their data being used for research purposes. They were able to withdraw their consent at any time during the study. Demographic data including age and country of residence were collected via mandatory questions during the sign-up process of the app. BBT measurements, menstruation dates and urinary LH test results were recorded by the users directly into the app.
Users who reported a pre-existing medical condition or other factors that could have a potential effect on the length and or variability of their cycles (i.e., polycystic ovary syndrome, endometriosis, hypothyroidism, recent/current pregnancy, current hormonal treatment, or symptoms of menopause) were excluded from the study. We further excluded cycles with lengths below 20 days or above 90 days, cycles that started before registration date as well as cycles in which the users became pregnant.
This study was a sub-analysis of data collected as part of a wider study protocol that was reviewed and approved by the regional ethics committee (EPN, Stockholm, diary number 2017/563-31).
Data analysis
To determine the accuracy of the algorithms’ prediction of the fertile window, two metrics were considered. The first parameter is the average percentage of days per cycle that are wrongly predicted to be ‘non-fertile’ when in fact they were found to belong within the six-day fertile window by retrospective determination of ovulation (described below). This parameter is hereafter described as ‘wrong green days (WGDs)’ since the Natural Cycles app displays non-fertile days as ‘green’. The second parameter is the average percentage of predicted ‘non-fertile’ days per cycle, hereafter called ‘green days (GDs)’. Together they give an indication of how well the algorithm predicts the fertile window by allocating an adequate number of ‘fertile’ and ‘non-fertile’ days.
Ovulation detection and calculation of GDs and WGDs
To establish the most accurate reference for the ‘true’ ovulation day and fertile window, we retrospectively analysed cycles with a recorded positive LH test followed by a BBT temperature rise within 1–2 days, a combination that provides a strong indication of ovulation [Citation12–15]. The ‘true’ six-day fertile window was then placed covering the resulting confirmed ovulation day and the five preceding days. Included in this study were users with a minimum of one cycle with this evidence of ovulation. We calculated the fertile window of each user according to the requirements of the Rhythm Method and SDM described above. We then analysed the fraction of WGDs and GDs per cycle in all cycles with the above-described evidence of ovulation.
The fraction of WGDs was then calculated by comparing the predicted fertile window of each algorithm with the retrospectively confirmed fertile window. The percentage of GDs was calculated based on the predicted fertile windows in the same cycles. Statistical significance (p < 0.05) of differences in the distributions of GDs and WGDs per cycle between the algorithms was assessed using the Wilcoxon signed-rank test (Wilcox treatment of zero differences) and Mann–Whitney U test, respectively.
We further determined the probability of WGD allocation per day of the fertile window for each of the algorithms.
Comparison of Natural Cycles and the Rhythm Method
Users who contributed a minimum of seven consecutive cycles were selected to meet the requirement of the Rhythm Method of a monitoring phase of at least six cycles. The fertile window for each of these users was calculated according to the formula described above based on the longest and shortest cycle out of the first six recorded ones. The fertile window was recalculated whenever a subsequently recorded cycle was longer or shorter than the previous longest or shortest cycle, respectively, according to the rules of the method [Citation8]. We censored users after a maximum of 12 cycles.
The same cycles were analysed with the Natural Cycles algorithm considering only BBT measurements, or both BBT measurements and LH test results.
Comparison of Natural Cycles and the Standard Days Method
The SDM requires regular cycles with a length between 26 and 32 days. For this analysis, we excluded users after they recorded two cycles with lengths outside of this range. Users with the first two cycles outside of this range were excluded entirely. In the remaining cycles, the fertile window was placed spanning from cycle day 9 to cycle day 18, as per the method [Citation9]. After a maximum of 12 cycles, users were censored.
We analysed the same cycles with the Natural Cycles algorithm considering BBT measurements only or both BBT measurements and LH test results.
Results
Natural Cycles in comparison to the Rhythm Method
A cohort of 42,579 users met the criteria for inclusion and had recorded a minimum of seven cycles. They contributed a total of 282,235 cycles, which were used to calculate the fertile window according to the method’s requirements. A proportion of 26,626 cycles was found to meet the ovulation detection criteria described above (i.e., positive LH test followed by a BBT rise) and were, thus, analysed. The average age of the participants was 30.3 years and their main countries of residence were UK (34%), USA (25%) and Sweden (17%).
The results of the cycle-by-cycle analysis of GDs and WGDs for the respective algorithms are depicted in and . When considering BBT measurements only, the Natural Cycles algorithm allocated an average of 43% GDs in cycle 1. Over time, this number increased to an average of 56% in cycle 12. At the same time, the fraction of WGDs per cycle stayed relatively stable with averages of 0.14%. These numbers improved when we allowed the algorithm to take into account both BBT and LH test results. The fraction of WGDs was consistently lower with an average of 0.08% overall 12 cycles, while the average fraction of GDs started at 48% in cycle 1 and increased to 59% in cycle 12.
Figure 1. Cycle-by-cycle comparison of Natural Cycles and the Rhythm Method. Development of the fraction of green days (GDs, solid lines, left y-axis) and wrong green days (WGDs, dashed lines, right y-axis) per cycle over the course of 12 cycles. BBT: basal body temperature; LH: luteinising hormone.
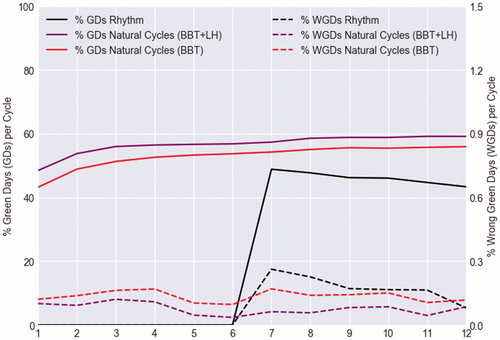
Table 1. Cycle-by-cycle comparison of Natural Cycles and the Rhythm Method.
The Rhythm Method requires monitoring of at least six cycles before a fertile window can be calculated, which resulted in no GDs or WGDs in cycle 1–6. In cycle 7, an average of 49% GDs was allocated and the fraction of WGDs was 0.26%. Both the average fraction of GDs and the fraction of WGDs decreased over time to 43% and 0.08%, respectively, in cycle 12. Between the Rhythm Method and Natural Cycles algorithm using BBT only, there were statistically significant differences in the fraction of WGDs in cycles 7–8 and in the fraction of GDs in all cycles (ignoring cycles 1–6).
Natural Cycles in comparison to the Standard Days Method
Due to the restrictions of the SDM, a cohort of 36,130 users (84.9% of the total cohort) met the inclusion criteria for this analysis. A total of 16,386 cycles (out of a possible 180,383) with ovulation evidence were analysed. The average age in this cohort was 30.2 years and the majority of users came from the UK (33%), USA (26%) and Sweden (17%).
The results of the analysis are shown in and . Analysis of cycles according to the SDM revealed an average of 58% GDs, which, due to the nature of the algorithm, stayed the same throughout all cycles. The fraction of WGDs was 1.60% in cycle 1 and decreased over time to an average of 0.27% in cycle 12. The prediction of the fertile window with the two Natural Cycles algorithms resulted in an average of 44% GDs (BBT only) and 49% GDs (LH and BBT) in cycle 1. These numbers increased to 57% and 61% GDs on average in cycle 12, respectively. Again, the fraction of WGDs remained rather consistent overall cycles with averages of 0.12% (BBT only) and 0.07% (LH and BBT). The differences in fraction of WGDs between the SDM and the Natural Cycles algorithm using BBT were statistically significant in all cycles, and differences in the fraction of GDs in cycles 1–7.
Figure 2. Cycle-by-cycle comparison of Natural Cycles and the Standard Days Method. Development of the fraction of green days (GDs, solid lines, left y-axis) and wrong green days (WGDs, dashed lines, right y-axis) per cycle over the course of 12 cycles. BBT: basal body temperature; LH: luteinising hormone.
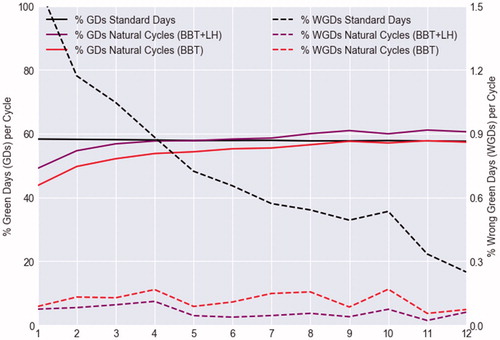
Table 2. Cycle-by-cycle comparison of Natural Cycles and the Standard Days Method.
Probability of wrong green days in the fertile window
and depict the distribution of the probability of allocation of WGDs by the discussed algorithms over the different days of the fertile window. Additionally, the conception probability for each day is shown according to Dunson et al. [Citation16], which indicates that the day before ovulation is the most fertile day with a 29.4% chance of conception. shows that with the Rhythm Method, the probability of receiving a WGD in cycle 7–12 was highest on the day of ovulation (2.46%), and considerable on the day before ovulation (0.80%). In contrast, the probability of receiving a WGD with the Natural Cycles algorithm considering only BBT measurements was highest on the first day of the fertile window (2.03%) and as low as 0.31% and 0.66% on the day before and on ovulation day itself, respectively. When considering both LH test results and BBT, the probability was 1.42% five days before ovulation with decreasing numbers on day 4, 3 and 2 before ovulation, respectively. The likelihood of WGD allocation on the day before or the day of ovulation was 0%. shows a similar distribution of the probability of allocation of WGDs for the two Natural Cycles algorithms, with the highest probabilities, 1.95% for BBT only and 1.45% for LH and BBT, occurring five days before the identified ovulation. On the day before ovulation and ovulation day itself, probabilities were 0.16% and 0.38%, respectively (BBT only). The likelihood of a WGD on those days was 0% for the Natural Cycles algorithm considering both LH and BBT. Results for the SDM show that the probability of WGDs was highest (13.01%) on ovulation day itself and on the day before ovulation (6.90%).
Figure 3. Day-by-day probability of wrong green days (WGDs) in the fertile window in cycles 7–12 with (A) the Rhythm Method, (B) Natural Cycles (BBT and LH), and (C) Natural Cycles (BBT only). The fertile window is depicted from five days before ovulation (ov-5) to ovulation day (ov). The conception probability on each day according to Dunson et al. is shown in brackets underneath [Citation16]. BBT: basal body temperature; LH: luteinising hormone.
![Figure 3. Day-by-day probability of wrong green days (WGDs) in the fertile window in cycles 7–12 with (A) the Rhythm Method, (B) Natural Cycles (BBT and LH), and (C) Natural Cycles (BBT only). The fertile window is depicted from five days before ovulation (ov-5) to ovulation day (ov). The conception probability on each day according to Dunson et al. is shown in brackets underneath [Citation16]. BBT: basal body temperature; LH: luteinising hormone.](/cms/asset/aa5292f3-a0a4-4a57-bcb5-aae2c81b1df6/iejc_a_1682544_f0003_c.jpg)
Figure 4. Day-by-day probability of wrong green days (WGDs) in the fertile window in regular cycles 1–12 with (A) the Standard Days Method, (B) Natural Cycles (BBT and LH), and (C) Natural Cycles (BBT only). The fertile window is depicted from five days before ovulation (ov-5) to ovulation day (ov). The conception probability on each day according to Dunson et al. is shown in brackets underneath [Citation16]. BBT: basal body temperature; LH: luteinising hormone.
![Figure 4. Day-by-day probability of wrong green days (WGDs) in the fertile window in regular cycles 1–12 with (A) the Standard Days Method, (B) Natural Cycles (BBT and LH), and (C) Natural Cycles (BBT only). The fertile window is depicted from five days before ovulation (ov-5) to ovulation day (ov). The conception probability on each day according to Dunson et al. is shown in brackets underneath [Citation16]. BBT: basal body temperature; LH: luteinising hormone.](/cms/asset/90b7878c-6565-42f9-a6b4-b653d70e396c/iejc_a_1682544_f0004_c.jpg)
Discussion
Findings and interpretation
In this study, we compared the identification of the fertile window between different FABM of contraception, including the Natural Cycles contraceptive app, the Rhythm Method, and the SDM. The accuracy of the different algorithms was measured by calculating the proportion of falsely allocated ‘green’ (infertile) days and the overall fraction of GDs when the methods were applied to a large set of real-world menstrual cycles. The analysis demonstrates that the adapting algorithm of Natural Cycles allocates the fertile window in such a way that the user receives an appropriate number of GDs from her first cycle onwards (43–44% with BBT only, 48–49% with BBT and LH), which increases as she continues using the app, while a low fraction of WGDs is maintained (0.12–0.14% with BBT only, 0.07–0.08% with BBT and LH). Unsurprisingly, the algorithm considering both LH and BBT is slightly superior to the one only considering BBT. The Rhythm Method requires a monitoring period of at least six cycles, which means that the user cannot start using this method for contraception during that time. In the first cycle after the six-month monitoring period, in comparison to Natural Cycles with BBT only (0.17% WGDs), the Rhythm Method algorithm was found to allocate a wider fertile window, reflected in a lower amount of overall GDs, yet with a 53% higher fraction of WGDs (0.26%). Over time, this calculation becomes more conservative, decreasing both the number of GDs and WGDs. In cycles 7–12, in comparison to the Rhythm Method (0.18% WGDs, 46% GDs), the fraction of WGDs allocated by the Natural Cycles algorithm considering BBT only (0.14%) or LH and BBT (0.07%) were 22% and 61% lower while the fraction of GDs (55% and 58%, respectively) were 20% and 26% higher. The SDM, on the other hand, excludes women with more irregular cycles and allocates the same fertile window in each cycle. This resulted in a steady fraction of GDs, however, with an 18-fold higher fraction of WGDs allocated in cycle 1 (1.60%) compared to the Natural Cycles algorithm considering BBT only (0.09%). This number decreases cycle-by-cycle, likely due to the drop-out of users with more than two cycles outside of the required 26- to 32-day cycle length range. Overall 12 cycles, the fraction of WGDs allocated by Natural Cycles BBT only (0.12%) was 87% lower than with the SDM (0.93%) and 93% lower with Natural Cycles LH and BBT (0.07%).
These findings highlight the importance of an individualised algorithm to determine the fertile window as menstrual cycle parameters such as cycle, follicular phase and luteal phase lengths can vary significantly as recent research on a large data set shows [Citation17]. Therefore, it is not surprising that a BBT-based algorithm shows a higher accuracy compared to static methods based solely on the date of menstruation. Analysis of BBT measurements and LH test results allows the Natural Cycles algorithm to adapt to the individual physiological variations of each user, which is reflected in the consistently low fraction of falsely allocated GDs of below 0.2%. Furthermore, the likelihood of receiving a WGD two days before ovulation, on the day before ovulation and on the day of ovulation, which are the three most fertile days in a woman’s cycle [Citation16], was only 1.10% with the BBT only algorithm, compared to 3.5% with the Rhythm Method (cycle 7–12). In the more regular cycles, the probability of WGDs on these days was 0.67% with Natural Cycles (BBT only) compared to 23.69% with the SDM. When both LH and BBT were considered by the Natural Cycles algorithm, the probabilities in both analyses were close to zero.
Strengths and weaknesses of the study
To our knowledge, this is the first such study comparing the accuracy of fertile window allocation between FAMB methods. Algorithms were applied to the largest cycle dataset to date composed of real-world data. A limitation of this study is the reference for the ‘true’ ovulation day used in this analysis. It is based on the retrospective placement of ovulation by the Natural Cycles algorithm considering a positive LH test result followed by a BBT rise. This approach comes with a small margin of error [Citation11]. Another limitation is the lack of consecutive cycles with consistent LH and BBT evidence, which reduces the number of cycles eligible for analysis significantly. We further acknowledge that the data is collected solely from Natural Cycles users, who may not represent the wider population.
Differences in results and conclusions
To our knowledge, this is the first study of its kind comparing the accuracy of predicting the fertile window using different algorithms.
Relevance of the findings: implications for clinicians and policymakers
Individualised identification of the fertile window with the Natural Cycles algorithm may contribute to a higher contraceptive effectiveness of a method compared to calendar-based methods. In a prospective observational study with over 22,000 women, the Pearl Index (PI) of the Natural Cycles contraceptive app was determined to 6.9 with typical-use and 1 with perfect-use. Life table analysis resulted in a 13-cycle pregnancy probability of 8.3% with typical-use [Citation4]. In comparison, 12-month pregnancy probabilities with typical-use of the traditional Rhythm Method have been estimated at 15–18.5% [Citation18], however, the WHO reports numbers as high as 25% [Citation8]. The pregnancy probability of the SDM was determined to be 4.75% with perfect-use (defined as abstinence during the fertile days) and 11.2–14.1% with typical-use [Citation9,Citation19]. Whilst accuracy of fertile window identification is important for contraceptive outcomes, contraceptive failure of FABM is often due to difficulties in following the method. According to recommendations by the Centres for Disease Control and Prevention (CDC), Natural Cycles may be easier to use than traditional calendar-based methods [Citation20] and this is likely to lead to superior real-world effectiveness outcomes.
Unanswered questions and future research
This study investigated and reported the differences in the performance of the various FABM algorithms using real-world data. It is well known that behavioural aspects play a significant role in contraceptive effectiveness and outcome which was not considered and therefore requires further investigation. This could be achieved in head to head trials if warranted.
Conclusion
This study highlights the importance of an adaptive and personalised algorithm for accurate determination of the fertile window. The Natural Cycles algorithm achieves this with the analysis of BBT allowing for an average fraction of WGDs below 0.15%, the majority of which occur on the first day of the fertile window (five days before ovulation), which bears the lowest risk of conception (2.4%). Additional measurements of urinary LH further improve these results. These factors likely contribute to the lower PI of the Natural Cycles method compared to the Rhythm Method and SDM. The results further emphasise that these static algorithms are more likely to fail during the most fertile days of a woman’s cycle, posing an increased risk of unintended pregnancies.
Author contributions
This study was designed and conceived by T.K.K. and J.R.B. The article was drafted by T.K.K. The data were analysed by J.R.B. and V.L. and interpreted by J.R.B. and T.K.K. S.P.R., E.B.S., R.S., and K.G.D. reviewed and amended the article. All authors gave approval to the final version.
Disclosure statement
E.B.S. and R.S. are the scientists behind the application Natural Cycles and the founders of the company with stock ownership. T.K.K., J.R.B., V.L. and S.P.R. are employed by NaturalCycles Nordic AB. K.G.D. serves on the medical advisory board of Natural Cycles and has received honorarium for participating in advisory boards and/or giving presentations for matters related to contraception and fertility regulation for Ferring, Exelgyn and Mithra.
Data availability statement
The data that support the findings of this study are available from Natural Cycles Nordic AB, but restrictions apply to the availability of these data, and so are not publicly available. Data are however available from the authors upon reasonable request and with permission of Natural Cycles Nordic AB.
Additional information
Funding
References
- Wilcox AJ, Weinberg CR, Baird DD. Timing of sexual intercourse in relation to ovulation. Effects on the probability of conception, survival of the pregnancy, and sex of the baby. N Engl J Med. 1995;333:1517–1521.
- Zinaman M, Drobnis EZ, Morales P, et al. The physiology of sperm recovered from the human cervix: acrosomal status and response to inducers of the acrosome reaction. Biol Reprod. 1989;41:790–797.
- Starling MS, Kandel Z, Haile L, et al. User profile and preferences in fertility apps for preventing pregnancy: an exploratory pilot study. mHealth. 2018;4:21.
- Scherwitzl EB, Berglund Scherwitzl E, Lundberg O, et al. Perfect-use and typical-use Pearl Index of a contraceptive mobile app. Contraception. 2017;96:420–425.
- Jennings V, Haile LT, Simmons RG, et al. Perfect- and typical-use effectiveness of the Dot fertility app over 13 cycles: results from a prospective contraceptive effectiveness trial. Eur J Contracept Reprod Health Care. 2019;24:148–153.
- Klaus H. Natural family planning: a review. Obstet Gynecol Surv. 1982;37:128–150.
- Hartman CG. Science and the safe period: a compendium of human reproduction. Baltimore (MD): Williams & Wilkins; 1962.
- World Health Organization. Fact Sheet: Family Planning/Contraception. 2018 [cited 2019 Feb 14]. Available from: https://www.who.int/news-room/fact-sheets/detail/family-planning-contraception
- Arévalo M, Jennings V, Sinai I. Efficacy of a new method of family planning: the Standard Days Method. Contraception. 2002;65:333–338.
- World Health Organization. A prospective multicentre trial of the ovulation method of natural family planning. II. The effectiveness phase. Fertil Steril. 1981;36:591–598.
- Berglund Scherwitzl E, Lindén Hirschberg A, Scherwitzl R. Identification and prediction of the fertile window using NaturalCycles. Eur J Contracept Reprod Health Care. 2015;20:403–408.
- Morris N, Underwood L, Easterling W Jr. Temporal relationship between basal body temperature nadir and luteinizing hormone surge in normal women. Fertil Steril. 1976;27:780–783.
- Ecochard R, Boehringer H, Rabilloud M, et al. Chronological aspects of ultrasonic, hormonal, and other indirect indices of ovulation. BJOG. 2001;108:822–829.
- Behre HM, Kuhlage J, Gaβner C, et al. Prediction of ovulation by urinary hormone measurements with the home use ClearPlan® Fertility Monitor: comparison with transvaginal ultrasound scans and serum hormone measurements. Hum Reprod. 2000;15:2478–2482.
- de Mouzon J, Testart J, Lefevre B, et al. Time relationships between basal body temperature and ovulation or plasma progestins. Fertil Steril. 1984;41:254–259.
- Dunson DB, Baird DD, Wilcox AJ, et al. Day-specific probabilities of clinical pregnancy based on two studies with imperfect measures of ovulation. Hum Reprod. 1999;14:1835–1839.
- Bull JR, Rowland SP, Berglund-Scherwitzl E, et al. Real-world menstrual cycle characteristics of more than 600,000 menstrual cycles. npj Digital Medicine. 2019;2:83.
- Kambic RT, Lamprecht V. Calendar rhythm efficacy: a review. Adv Contracept. 1996;12:123–128.
- Peragallo Urrutia R, Polis CB, Jensen ET, et al. Effectiveness of fertility awareness-based methods for pregnancy prevention: a systematic review. Obstet Gynecol. 2018;132:591–604.
- Trussell J, Aiken ARA, Micks E, et al. Efficacy, safety, and personal considerations. In: Hatcher RA, Nelson AL, Trussell J, et al., editors. Contraceptive technology. 21st ed. New York (NY): Ayer Company Publishers; 2018. p. 95–128.