
 ?Mathematical formulae have been encoded as MathML and are displayed in this HTML version using MathJax in order to improve their display. Uncheck the box to turn MathJax off. This feature requires Javascript. Click on a formula to zoom.
ABSTRACT
The reliability of friction dependencies under real earthquakes has rarely been validated and the effect of the velocity and temperature increase caused by bidirectional excitation on the maximum displacement remains unclear. In this study, friction dependencies were validated using full-scale dynamic tests under earthquake response orbits, and their contribution to the maximum displacement was assessed under strong ground motions. In general, friction dependencies are still applicable to real earthquakes. Moreover, the effect of velocity increase can be ignored, but the effect of temperature increase on displacement is significant, particularly under ground motions with large magnitudes and small distances to faults.
1. Introduction
Many destructive earthquakes have occurred since the first application of the base isolation system (BIS) in earthquake-prone countries, such as in Northbridge in 1994, Kobe in 1995, and Tohoku in 2011 (Makris Citation2019). During these earthquakes, the BIS has been demonstrated to be the most effective method for mitigating seismic hazards (Bertero and Bozorgnia Citation2004; Nakashima et al. Citation2004), and consequently, its use in earthquake-prone countries has significantly increased (Earthquake Protection Systems Citationn.d.; Japan Society of Seismic Isolation Citationn.d.). A BIS can significantly reduce the deformation of a superstructure by concentrating the deformation on the isolation layer. Therefore, determining the maximum displacement of the isolation layer is one of the most important objectives in the design procedure (Calvi and Spaziante Citation2009; Shimazaki and Nakagawa Citation2015). In addition, because the mechanical properties of the isolation system depend on various factors (Constantinou et al. Citation2007), the effects of these factors on the maximum displacement is of vital significance and cannot be ignored. When friction pendulum bearings (FPBs) are applied, the maximum displacement is highly related to the friction coefficient. Therefore, the effect of friction dependencies on the maximum displacement is of vital importance.
Moreover, destructive earthquakes that occurred in recent decades have increased the demand for larger response displacements and larger isolation periods in seismic isolation design (De Luca and Guidi Citation2019). Compared with other bearings, friction pendulum bearings (FPBs) offer advantages, such as the ability to conveniently change the maximum displacement and independence of the natural period on mass. However, their application to seismic isolation remains limited (De Luca and Guidi Citation2019). Therefore, the effectiveness of FPBs has not been comprehensively investigated using earthquake data. Nowadays, FPBs are mostly popular in the US; however, similar devices have just been developed in Japan. The devices considered in this study are based on a double concave FPB (DCFPB) developed by Nippon Steel Engineering in 2019 (NS–SSB Citationn.d.). DCFPBs have becoming increasingly popular owing to their advantages in fulfilling the demand of larger response displacements. In response to this demand, considerable experiments of DCFPBs were conducted to study the extra-stroke response of them (without restraining ring) under extreme seismic loading (Furinghetti et al. Citation2021), the effect of restraining ring design on the extreme behavior (Bao et al. Citation2017), and the influence of residual displacement on the maximum displacement (Ponzo et al. Citation2017). It has been observed from recent studies that seismically isolated buildings with braced frames designed using ASCE have unacceptable collapse performance due to either insufficient isolator displacement capacity or excessive inelastic structural deformations (Kitayama and Constantinou Citation2021). In addition, recent studies in Europe show that the prevalent failure mode for base-isolated buildings with DCFPBs designed by European code is always the isolation system collapse mainly due to the low design margin of isolation devices (Ponzo et al. Citation2021). Therefore, this study focuses on improving the displacement capacity design of DCFPBs and the superstructure is considered as rigid.
The dependence of the mechanical properties of the BIS on pressure, velocity, temperature, aging, etc. has been investigated for sliding, lead rubber, and elastomeric bearings (Constantinou et al. Citation2007). The mechanical properties of sliding bearings (SBs) depend primarily on the effects of pressure, velocity, and temperature on the friction coefficient (Kumar, Whittaker, and Constantinou Citation2015). These dependencies differ depending on the sliding material. Low-friction materials used for building isolation devices are mainly based on polytetrafluoroethylene (PTFE), polyethylene (PE), and polyamide (PA). PTFE-based materials have a relatively lower friction coefficient and higher melting temperature (Calvi and Calvi Citation2018), and are used as the sliding interface of the DCFPB considered in this study. The pressure, velocity, and temperature dependencies were first examined via small-scale material friction tests (Nakamura et al. Citation2015; Nishimoto et al. Citation2016) and then validated using full-scale unidirectional dynamic tests over a wide speed and displacement range (Li et al. Citation2020). In this study, the dependencies were combined in a friction model and further validated under bidirectional artificial orbits and earthquake response orbits.
The mechanical properties of the BIS may also be affected by bidirectional effects (effects caused by bidirectional excitation compared with unidirectional excitation). Many experiments have been conducted in previous studies on the bidirectional behavior of FPBs. Mokha et al. conducted bidirectional displacement-controlled tests to determine the bidirectional effects of friction force on FPBs (Mokha, Constantinou, and Reinhorn Citation1993). Subsequently, Gilberto Mosqueda et al. conducted bidirectional displacement-controlled tests to determine the effect of the coupling between two orthogonal components on the behavior of FPBs (Mosqueda, Whittaker, and Fenves Citation2004). Following the development of testing facilities in 2011, the bidirectional sliding behavior of FPBs was evaluated on full-scale devices across a range of realistic vertical loads and sliding velocities for bidirectional excitations (Lomiento, Bonessio, and Benzoni Citation2013). Because of the increasing realization that for typical velocity ranges, the temperature appeared to be the overall dominant parameter that affects the friction coefficient (Quaglini et al. Citation2014), more bidirectional tests were conducted to examine the effect of temperature dependency (De Domenico, Ricciardi, and Benzoni Citation2018) or the cyclic effect (Furinghetti et al. Citation2019) on the mechanical properties of the bearing. However, the above-mentioned bidirectional dynamic tests on FPBs were conducted under artificial multidirectional graphics consisting of circles, ellipses, rectangles, and triangles. These graphics were aimed at simulating the loop with the maximum displacement in the earthquake response orbits, and the dissipated energy during the earthquake was controlled by the number of loops. However, in real orbits, the loop with the maximum displacement cannot be duplicated. Similar loops barely exist. Typically, the other loops in the duration are small displacements. Consequently, this difference may affect the temperature of the isolation system and hence the friction coefficient. Moreover, the loading period of the testing procedure using artificial graphics is typically designed based on the return period of the FPBs, which may result in significantly smaller accelerations than those in real earthquakes. Therefore, the destructive load pulses imposed on the system during real earthquakes cannot be appropriately simulated. Therefore, full-scale experiments are necessary under earthquake response orbits to further elucidate the behavior of FPBs and evaluate the credibility of friction dependencies under real earthquakes.
Simplified prediction methods are generally introduced in various structural codes, such as the American Society of Civil Engineering (ASCE) (ASCE/SEI 7–16 Citation2016), American Association State and Highway Transportation Officials (AASHTO Citation1993), Euro Code (European Committee for Standardization Citation2004) and Architectural Institute of Japan (AIJ) (Architectural Institute of Japan Citation2016), to obtain the design displacement of the isolation system, which is considered under unidirectional excitations with constant friction coefficients. However, Warn and Whittaker (Citation2004) noted that the effect of bidirectional excitation and coupling on maximum displacement cannot be ignored. Coupling effect exists between the responses of the FPBs in each orthogonal direction (Lomiento, Bonessio, and Benzoni Citation2013; Mosqueda, Whittaker, and Fenves Citation2004; Warn and Whittaker Citation2004), which, if ignored, results in an underestimation of the maximum isolator displacement by approximately 20%. Kumar et al. demonstrated that in a FPB friction model, the median maximum displacement could be underestimated by 10% and 30% for static axial pressures of 10 MPa and 50 MPa, respectively for 30 sets of three-component ground motions (GMs) if the effects of temperature increase are ignored. In addition, the effects of changes in the velocity and axial pressure on the friction coefficient are small and can be neglected in a friction model (Kumar, Whittaker, and Constantinou Citation2015). Li et al. performed a similar response analysis of a different DCFPB for 48 sets of three-component GMs and concluded that the effect of bearing stress and velocity dependencies on the maximum displacement is less than 10% for a static axial pressure of 60 MPa. In most cases, the larger the intensity of the earthquake, the less the effect (Li et al. Citation2018). Furthermore, Li et al. noted that if the temperature dependency of friction is ignored, the maximum response displacement of the isolation system under unidirectional GMs will be underestimated by an average of 20% for a static axial pressure of 60 MPa, however, the effect of velocity dependency on the maximum displacement can be ignored (Li et al. Citation2021).
Because most existing codes and the determination of mechanical properties (i.e. the friction coefficient of the bearing in this study) were considered under unidirectional excitations, the effect of velocity and temperature increase caused by additional perpendicular excitation on the friction coefficient and hence, on the maximum response displacement must be clarified. Therefore, determining the design displacement in a preliminary design that considers these effects remains a topic of interest (Constantinou et al. Citation2007).
In this study, full-scale dynamic experiments were conducted under earthquake response orbits to examine the behavior of FPBs and evaluate the friction dependencies in real earthquakes. The experiments were introduced in Section 2, the friction dependencies and friction models were presented in Section 3, and the experimental and analytical results were compared in Section 4. Moreover, the effects of an additional perpendicular GM component on temperature and velocity, and in turn, on friction coefficient and maximum response displacement were determined. The response results were shown in Section 5 and the mechanism was discussed in Section 6. Further, the effect of temperature was examined under various classifications of strong GMs in Section 7. This study is important because the reliability of friction dependencies under real earthquakes has rarely been validated, and the effect of the velocity and temperature increase caused by bidirectional excitation on the maximum response displacement remains unclear.
2. Experiments
2.1. Specimens and Test Setup
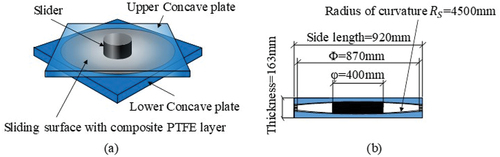
The tested specimen is shown in . The sliding material on the upper and lower surfaces of the slider is a composite PTFE material, whereas the two concave plates were fabricated using stainless steel, which are square-shaped with a radius of curvature of 4500 mm. φ and Φ denote the diameters of the slider and the spherical surface, respectively. Two types of specimens were tested: medium-friction specimens (Spec. M) and low-friction specimens (Spec. L).
Figure 1. Specimen: (a) 3D plan, (b) Sectional plan.
The experiments in this study were conducted at the Caltrans Seismic Response Modification Device (SRMD) Test Facility, University of California, San Diego (Benzoni and Seible Citation1998). The test setup is similar to that used in previous unidirectional tests (Li et al. Citation2020); however, the test input is different. In this study, four actuators were used to provide bidirectional displacement input.
2.2. Test Procedure
Two artificial multidirectional graphics and five ground motion pairs were utilized for Spec. M and Spec. L. The input orbits are listed in . Input information for Spec. L is shown in parentheses. C1 indicates one of the two orthogonal components of the earthquake records in the horizontal plane with a larger peak ground velocity (PGV), whereas C2 indicates the component with a smaller PGV. To simplify the description, the C1 and C2 directions are referred to as the longitudinal and lateral directions, respectively. Furthermore, large-magnitude earthquakes of different durations (Dur.), the distance to the fault (Rjb), and the orbit shape were included to incorporate as much details as possible. The abbreviations (abv.) of the input orbits are also listed in , where M represents Spec. M and L represents Spec. L. Regarding artificial multidirectional graphics, the radius of the circular orbit and the major (a) and minor radii (b) of the ellipse are provided. In addition, the pressure on the contact surface of the slider and concave plates was set to 60 MPa for all the tests. The input data listed in are the scaled data of the original ground motion to simulate the response under destructive earthquakes; the data were scaled to satisfy the limitations of the testing machine and specimen. Some examples of the scaled orbit inputs of Spec. M and Spec. L are shown in . These were obtained using the response analysis model of the DCFP bearings proposed by Takanori, Masashi, and Shoichi (Citation2018), assuming that the friction coefficients are constant.
Figure 2. Examples of the orbit inputs of Spec. M and Spec. L.
Table 1. Input artificial graphics and earthquakes of response orbits for Spec. M (L).
3. Numerical Simulation of the Experiments
3.1. Numerical Simulation Using Constant Friction Coefficient
The response force – deflection diagram of Spec. M and Spec. L under strong excitations can be roughly simulated using constant friction coefficients based on previous experiments to confirm the behavior of the specimen (Hideji, Koji, and Atsushi Citation2014; Koji, Naoya, and Hasegawa Citation2017):
where μn is the nominal friction coefficient, which is a constant value suitable for most seismic situations, validated using previous unidirectional dynamic tests (Li et al. Citation2020). This value was obtained at a velocity of 400 mm/s, a pressure of 60 MPa, and the interception of the y-axis of the horizontal/vertical force at the average of the 3rd fully reversed cycle (Li et al. Citation2020). The selection of the 3rd cycle considered the effect of the increase in temperature caused by friction on the friction coefficient during strong excitations.
3.2. Precise and Simplified Models for Simulating Friction Coefficient
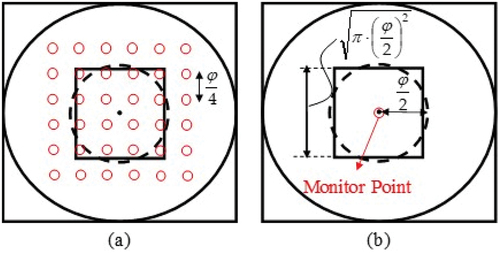
In this study, the accuracy of simplified and precise models was evaluated under bidirectional excitations. The accuracy of the models has been validated in a previous study under unidirectional excitations (Li et al. Citation2020). The difference between the models under bidirectional and unidirectional excitations is the arrangement of monitoring points for temperature simulation, as shown in (Kumar, Whittaker, and Constantinou Citation2015). The precise model has 6 × 6 monitoring points covering the sliding surface of the concave plates in two orthogonal directions. In contrast, the simplified model has only one monitoring point at the center of the concave plate, which facilitates a much faster calculation.
Figure 3. Calculation model for temperature: (a) Precise model and (b) Simplified model.
In both models, the temperature increase history of each monitoring point under random response orbits can be calculated as follows (Li et al. Citation2020):
where τ is a time parameter that varies between 0 and time t, q is the heat flux at the contact surface of the concave plates and the slider, ΔT is the temperature increase of the contact surface, D and k are the thermal diffusivity and thermal conductivity of the concave plates with values of 4.07 mm2/s and 0.016 W/(mm∙°C), respectively, μ is the friction coefficient, p is the pressure at the contact area, v is the relative velocity between the upper and lower concave plates, and δm is the lateral distance from the center of the slider to the monitoring point of interest. The representative temperature can then be calculated by considering the average temperature of the monitoring points within the contact surface. Furthermore, the friction dependency factors can be obtained and the friction coefficient can be calculated as:
where γ is the pressure dependency factor, σ is the bearing stress at the contact area, α is the velocity dependency factor, β is the temperature dependency factor, and T is the temperature of the contact area in degrees Celsius (Nakamura et al. Citation2015; Nishimoto et al. Citation2016). The friction dependency factors calculated using EquationEqs. (5)(5)
(5) –(Equation7
(7)
(7) ) are shown in .
Figure 4. Friction dependency equations obtained via small-scale material friction tests.
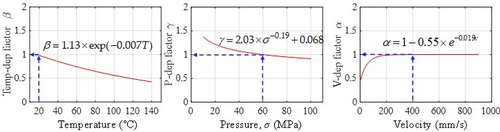
Furthermore, µo is the friction coefficient at 60 MPa (pressure on the DCFP bearing), 400 mm/s (relative velocity between the upper and lower concave plates of the DCFP bearing), and a temperature of 20°C (temperature at the interface of the slider and the concave plates); it was set to 0.075 and 0.013 for Spec. M and Spec. L, respectively based on a previous study. In the case of Spec. L, µo = µn because it is minimally affected by temperature.
4. Experimental and Numerical Results Under Artificial Graphics and Earthquake Response Orbits
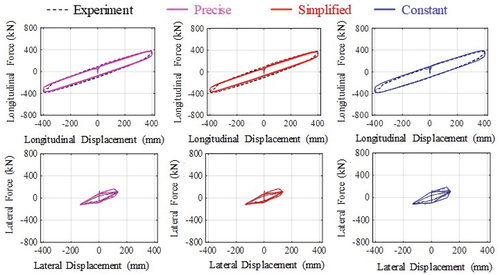
First, the accuracy of the friction models can be evaluated by comparing their force – displacement diagrams under artificial graphics with the experimental results. The comparison results for Spec. M and Spec. L under elliptical orbit are shown in and , respectively. The precise and simplified models considered all three friction dependency factors throughout the analytical procedure. The blue line represents the constant friction coefficient introduced in EquationEq. (1)(1)
(1) . Coupling effect was considered for all the models.
Figure 5. Force-displacement diagrams of Spec. M under elliptical orbit.
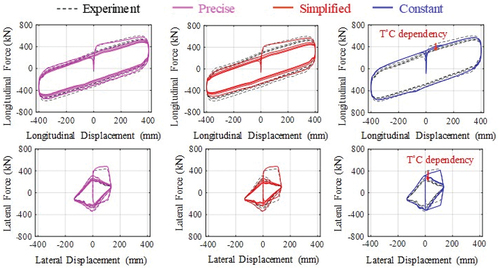
Figure 6. Force–displacement diagrams of Spec. L under elliptical orbit.
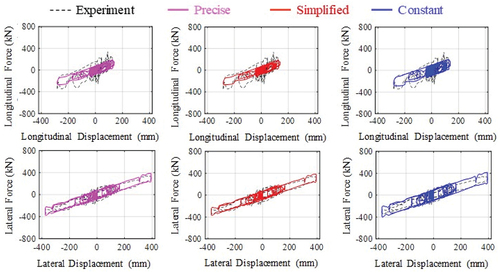
and show the experimental and analytical results of the force – displacement diagrams under the KNA earthquake for Spec. M and Spec. L, respectively. The following conclusions can be drawn from regarding the difference between the experimental results under artificial graphics and response orbits. Generally, there is no significant different between the experimental force – displacement loops and the constant model (blue curve), which indicates that the magnitude of the friction coefficient produces no significant difference between the artificial graphics and the response orbits. On the other hand, a large force pulse that breaks out the blue curve was observed under response orbits unlike under artificial graphics. This is caused by a rapid increase in velocity at the beginning of the earthquake, which caused high velocity and low temperature to occur simultaneously at the contact surface of the DCFP bearing. According to EquationEqs. (4)(4)
(4) –(Equation7
(7)
(7) )and , this leads to a large friction coefficient and hence, a large force. It can be observed from that both the precise and simplified models can simulate this force pulse. However, the nominal friction coefficient introduced in Section 3.1 cannot because the constant value cannot simulate the change in the friction coefficient.
Figure 7. Force-displacement diagrams of Spec. M under KNA-M orbit.
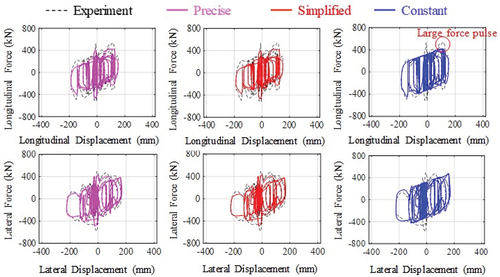
Figure 8. Force-displacement diagrams of Spec. L under KNA-L orbit.
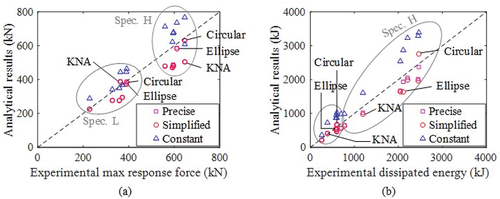
In addition, the results for all the inputs are shown in in terms of the accuracy of the maximum horizontal response force and total dissipated energy of the bearing. It can be observed from that the simplified model exhibits nearly the same response as the precise model for both Spec. M and Spec. L. They slightly underestimated the response force and dissipated energy in real earthquakes for the considered specimens; however, the simulation accuracy is still high. Therefore, the simplified model can be used instead of the precise model for faster calculations. Furthermore, it is evident from that using the nominal friction coefficient, µn results in a slight overestimation of the maximum response force and dissipated energy. This difference is not large, but it implies that the value of µn obtained from unidirectional experiments must be decreased slightly under bidirectional excitations.
Figure 9. Accuracy of friction models: (a) maximum response force and (b) total dissipated energy under bidirectional excitations.
5. Response Analyses of Isolated Structures
5.1. Input Ground Motions
Eight earthquakes with various intensities, durations, and distances to the fault were selected to incorporate most types of strong ground motions, as presented in . In a previous study on unidirectional response analysis, component C1 was considered as the input (Li et al. Citation2020); However, in this study, both C1 and C2 were used as the input. For comparison, the C1 components of both studies were amplified to obtain PGV values of 250 mm/s, 500 mm/s, 750 mm/s, and 1000 mm/s.
Table 2. Input earthquake motion.
5.2. Mechanical Model
It has been reported that a rigid superstructure can be assumed when predicting isolator displacement (Bhagat and Wijeyewickrema Citation2017; Kelly Citation1990). In this study, the isolation system was simplified as a single-degree-of-freedom (SDOF) system, as shown in . In addition, coupling effect was considered in this model. Moreover, the mechanical model in this study considered both the sliding and non-sliding states (Takanori, Masashi, and Shoichi Citation2018), similar to the model proposed in a previous study (Li et al. Citation2020). The states were judged using a circle with a radius of rf, referred to as the “yield surface” and the internal forces were considered as springs (a), (b), and (c). Spring (a) represents the restoring force of the pendulum movement. A vertical load that can provide a pressure of 60 MPa on the slider surface was applied. Spring (b) represents the friction force between the slider and two concave plates. The bearing was set to Spec. M simulated using the simplified model to determine the effect of temperature caused by friction heating. Spring (c) represents the elastic stiffness of the system. Under bidirectional excitation, the directions of springs (b) and (c) are opposite to the moving direction of the displacement point.
Figure 10. Bidirectional mechanical model of a structure with DCFP bearings.
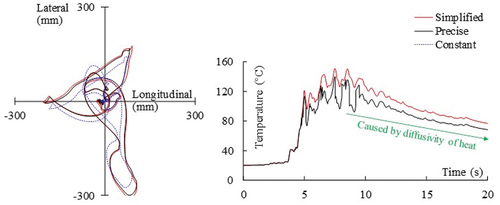
To further confirm the accuracy of the simplified model for predicting the maximum response displacement (Dmax), we performed a comparison of Dmax of the response analysis from the precise model, simplified model, and constant friction coefficient, as shown in . The value of Dmax obtained using simplified model is similar but slightly higher than that from the precise model. In contrast, the response analysis result using the nominal friction coefficient µn slightly underestimated Dmax. Similar to the results shown in , this difference is not large; it indicates that µn obtained from unidirectional experiments must be decreased slightly under bidirectional excitations. Furthermore, shows a comparison of the representative temperatures calculated using the precise and simplified models. The simplified model slightly overestimated the temperature; however, the difference is not significant. The displacement response and corresponding increase in temperature during NCC (PGV in the longitudinal direction is amplified as 750 mm/s) are shown in as an example to clearly visualize the difference. Consequently, it can be concluded that the simplified model can be used instead of the precise model with no significant difference.
Figure 11. Comparison of the maximum displacement and temperature for the three models.
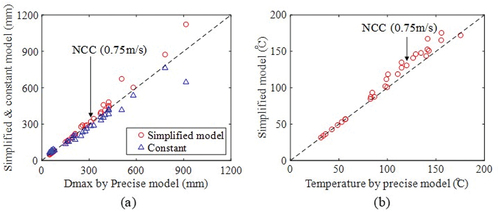
Figure 12. Response displacement and temperature history during NCC (750 mm/s).
5.3. Parametric Study of the Influence of Friction Dependencies on the Response Displacement
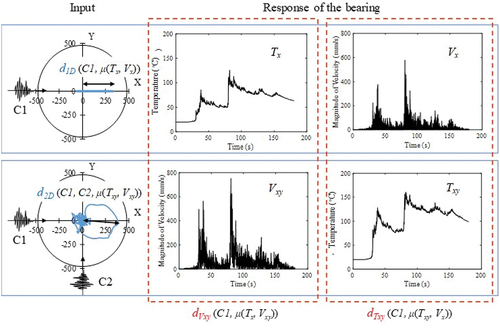
According to a previous study (Li et al. Citation2020), a higher velocity results in a larger friction coefficient (μ), whereas a higher temperature results in a smaller μ, which in turn causes a change in the response displacement. As shown in , d1D is the maximum displacement of the DCFP bearing under the C1 component of the ground motion pair and d2D is the maximum displacement under the ground motion pair. By denoting the response temperature and velocity of the DCFP bearing under the C1 component of the ground motion pair as Tx and Vx, respectively, and the response velocity and temperature under the ground motion pair as Vxy and Txy, respectively, two special displacements can be defined to evaluate the effect of velocity and temperature dependencies on the bidirectional response displacement. dVxy is the maximum horizontal displacement under the C1 component of the ground motion pair using Vxy and Tx to calculate μ, and dTxy is the maximum horizontal displacement under C1 using Txy and Vx to calculate μ.
Figure 13. Definitions of dVxy and dTxy.
Subsequently, the contributions of the increase in the velocity and temperature caused by the addition of the C2 component to the increase in the maximum response displacement can be expressed as ηV and ηT, respectively:
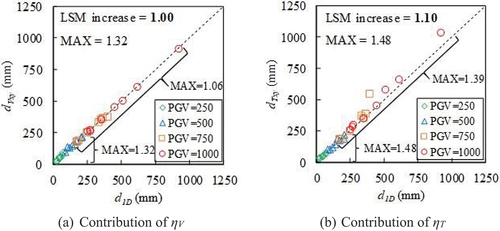
The analysis results of d1D, dVxy dTxy, and d2D calculated using the amplified input waves are shown in . show that under strong seismic excitations, the effect of temperature resulted in an increase of approximately 1.1 (calculated by the least squares means (LSM) method) to the change in the response displacement, whereas the effect of velocity is relatively negligible.
Figure 14. Effects of velocity and temperature increase on the maximum displacement.
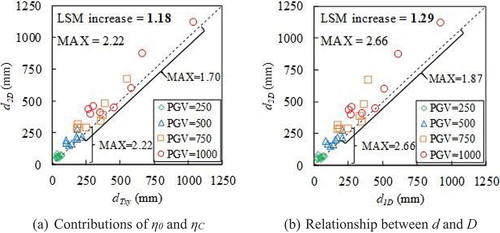
Because the effect of velocity dependency (ηV) is negligible, the major factors affecting displacement increase from unidirectional to bidirectional excitations are temperature effect (ηT), bidirectional effect (η0), and coupling effect (ηC). Therefore, the increase caused by the contribution of bidirectional effect (η0) and coupling effect (ηC) can be expressed as:
As shown in , from dTxy to d2D, the LSM increase in displacement caused by bidirectional effect (η0) and coupling effect (ηC) is 1.18. Furthermore, shows that the change from d1D to d2D represents an LSM increase of 1.29 with a maximum increase of PGV = 250 mm/s and 500 mm/s as 2.66 and PGV = 750 mm/s and 1000 mm/s as 1.87, which is significantly large to be ignored. Consequently, it can be concluded that the effect of temperature (ηT) is as important as bidirectional effect (η0) and coupling effect (ηC) in terms of contribution to the increase in the maximum displacement (temperature contributed almost one-third of the increase) and hence, cannot be ignored.
Figure 15. Displacement increase from unidirectional to bidirectional excitations.
6. Mechanism of Effects of Temperature Increase on Maximum Displacement Under Bidirectional Excitations
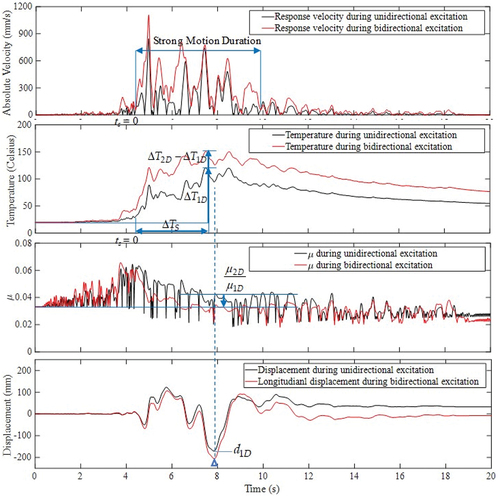
The response time history under unidirectional and bidirectional NCC excitations (the PGV of the C1 components are amplified to 750 mm/s) was compared to determine the difference in the maximum displacement of DCFP bearings between bidirectional and unidirectional responses, as shown in . When maximum displacement occurs, the value of the friction coefficient during this displacement pulse determines the magnitude of the maximum displacement. The first peak friction coefficient after the maximum displacement and the first peak temperature increase before the maximum displacement were selected for easier comparison of the parameters. d1D represents the maximum displacement under unidirectional excitation, ∆T1D and ∆T2D are the corresponding peak temperature increases under unidirectional and bidirectional excitations, respectively, and μ1D and μ2D are the corresponding peak friction coefficients under unidirectional and bidirectional excitations, respectively. ts is the duration of the strong motion and ∆ts is the duration of the strong motion before d1D.
Figure 16. Time history of the response of DCFP bearing under NCC input (PGV=750 mm/s).
6.1. Effect of Ground Velocity History on Temperature Increase
By assuming the friction coefficient as the nominal value μn based on EquationEq. (3)(3)
(3) , the pressure is a constant P and the velocity during the strong motion duration shown in is a constant as×PGV. Then, the instantaneous heat flux during the strong motion duration can be estimated as:
The strong motion duration before the maximum displacement is assumed to be ∆ts as shown in . Because the energy absorption before the strong motion duration is relatively small, the energy absorption before the strong motion duration is neglected, and the temperature increase was calculated from the starting time of the strong motion duration (ts = 0). Therefore, the regression model of ∆T1D can be determined as follows based on EquationEq. (2)(2)
(2) :
where dτ is the time interval of the strong motion duration. The analytical data of ∆T1D are shown in , where Spec. M was applied, μn was set to 0.043, and P was selected as 60 MPa. The value of was determined to be 0.78 using LSM method, where 0.78 can only represent this selected group of ground motions. The coefficient of correlation (R) of the data in is 0.87, and the coefficient of determination (R2) of the trend line is 0.75.
Figure 17. Analytical results and regression models using the LSM method.
6.2. Effect of the Addition of a Second Earthquake Component on Temperature Increase
From EquationEq. (2)(2)
(2) , ∆T2D - ∆T1D can be expressed as:
It is assumed that a linear relationship exists between the response velocities of the bearing under bidirectional (v2D) and unidirectional excitations (v1D) as v2D(t) = a2v1D(t) + b2, where a2 is the slope and b2 is the interval. Then,
By substituting EquationEq. (14)(14)
(14) into EquationEq. (13)
(13)
(13) , the following regression model is obtained.
By assuming that the friction coefficient and pressure are constant in the duration of strong motion before the maximum displacement, the regression model of ∆T2D - ∆T1D can be derived from EquationEq. (15)(15)
(15) as
where, c2 is the value of the last item in EquationEq. (15)(15)
(15) . The analytical data for ∆T2D - ∆T1D and ∆T1D are shown in . Using the LSM method, a2 and c2 were determined as 1.10 and 13, respectively for this group of ground motions. In , R is 0.46 and R2 is 0.21, which indicates that there is no strong linear correlation between ∆T2D - ∆T1D and ∆T1D, and the regression model does not match the data well. This is because the magnitude of the velocity of the second component is random, which ensures that the value of v2D cannot be accurately predicted from v1D. However, a general trend is observed. Further discussions on the validation of this regression model will be presented in the next section.
6.3. Effect of Temperature Increase on the Change in Friction Coefficient
Because the temperature is the overall dominant friction dependency factor validated in Section 5.3, μ2D/μ1D can be expressed as follows based on the temperature dependency equation introduced in a previous study (Li et al. Citation2020) and EquationEq. (4)(4)
(4) :
The analytical data of μ2D /μ1D and ∆T2D - ∆T1D are shown in . The prediction result is in good agreement with the experimental data.
Figure 18. Relationship between μ2D /μ1D and ∆T2D - ∆T1D.
By substituting EquationEqs. (12)(12)
(12) and (Equation15
(15)
(15) ) into EquationEq. (17)
(17)
(17) , μ2D /μ1D can be expressed as
In this study, μ1D can be considered to be μn, which is equal to 0.043 for Spec. M. EquationEq. (18)(18)
(18) demonstrates how μn should be modified under bidirectional excitation.
6.4. Effect of Change in Friction Coefficient on Maximum Displacement
By combining EquationEqs. (10)(10)
(10) and (Equation18
(18)
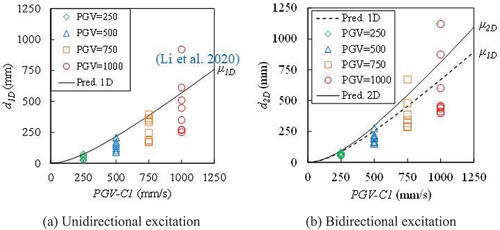
(18) ), the existing prediction methods for the unidirectional maximum displacement can be refined to provide a rough estimation of the maximum displacement under the corresponding ground motion pairs. For instance, according to a previous study (Li et al. Citation2020) on the energy-based prediction of the displacement under unidirectional excitation, the maximum response displacement under the C1 component (d1D) can be conservatively predicted directly using PGV, as shown in (Li et al. Citation2020). The markers are the analysis values of d1D for the selected group of ground motions in this study. Further, from EquationEqs. (10)
(10)
(10) and (Equation18
(18)
(18) ), the maximum bidirectional response displacement (d2D) under the corresponding ground motion pairs can be predicted using μ1D or μ2D, shown in as dashed line and solid line, respectively. The markers are values of d2D obtained from analysis for the same group of scaled ground motions. It is evident that using μ1D is no longer as conservative for predicting d2D as for predicting d1D. In contrast, the bidirectional prediction method using μ2D can be considered relatively conservative. This further demonstrates that, except for the bidirectional effect and the coupling effect, the change in the friction coefficient by considering the effect of temperature also has a major effect on the maximum response displacement of the DCFP bearing under bidirectional excitations.
Figure 19. Effect of change in friction coefficient on maximum displacement.
7. Effect of Temperature Dependency on Maximum Bidirectional Displacement Under Various Real Earthquake Excitations
It was concluded from Section 5.3 that the effect of velocity dependency on the increase in displacement from unidirectional to bidirectional excitations (ηV) is negligible, particularly when the maximum displacement is larger than 200 mm. The temperature effect (ηT), bidirectional effect (η0), and coupling effect (ηC) had major effects on displacement increase. Furthermore, the regression equations introduced in Section 6 illustrate the mechanism by which the temperature increase caused by bidirectional excitations affects the friction coefficient and, hence, the maximum displacement. However, similar to the fact that the effect of bidirectional excitation and coupling behavior on maximum displacement is related to ground motions characteristics (Warn and Whittaker Citation2004), the effect of temperature may also be highly related to the selection of ground motions. Therefore, the effect of temperature on the maximum displacement under bidirectional motion is discussed under other real earthquake excitations in this section.
7.1. Ground Motion Organization
To examine the increase in maximum displacement, we considered only strong ground motions. Therefore, two basic filters were set during the selection of the ground motions. First, the moment magnitude of the earthquake (Mag.) should be > 6.5. Second, the PGV of the ground motions should be >200 mm/s.
We selected 386 GM pairs from the PEER earthquake database based on these filters (PEER Citationn.d.); their organization based on different earthquake characteristics is shown in . is organized using a fault mechanism. SS represents strike-slip, and N and R represent the normal and reverse type of dip-slip, respectively. The numbers in parentheses are the number of ground motions in each category. shows the moment magnitudes of the earthquakes. shows the distance between the construction site and the fault. NF, SD, and LD represent near fault (Rjb ≤10 km), small distance (10 km < Rjb ≤30 km), and long distance (30 km < Rjb), respectively, where Rjb is the Joyner – Boore distance to the rupture plane. shows the soil type at the construction site. A, B, C, and D are the classifications of site conditions based on NEHRP (European Committee for Standardization Citation2004). Classes A and B represent firm and hard rock with VS30 (the average shear velocity of the top 30 m of the site soil) larger than 760 m/s, class C represents dense soil and soft rock with VS30 in the range of 360–760 m/s, and class D represents stiff soil with VS30 in the range of 180–360 m/s.
Figure 20. Organization of ground motions based on different earthquake characteristics.
7.2. Effect of Earthquake Characteristics on ηT
According to EquationEq. (9)(9)
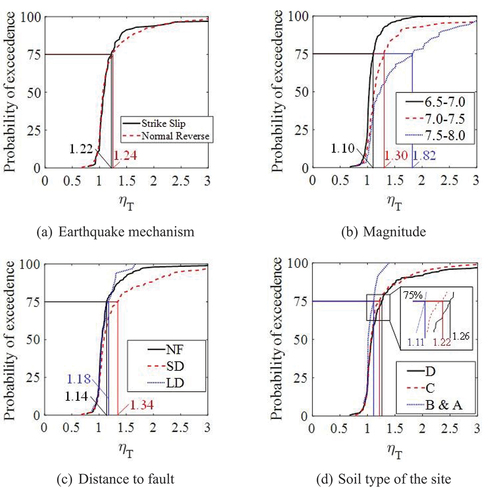
(9) , the effect of the change in temperature caused by the addition of the C2 component on the increase in the maximum response displacement (ηT) can be calculated for the selected earthquakes under different organizations as shown in . Similar to the approach in Sections 5 and 6, a DCFP bearing with μn = 0.043, slider diameter of 400 mm, and radius of curvature of 4500 mm was used in the analysis. The cumulative distribution of ηT for various earthquake classifications is shown in . A relatively conservative percentage of 75% was selected for comparison. The value of ηT corresponding to 75% indicates a 25% possibility that the real result is larger than this value. shows that the mechanism of the earthquake had no obvious effect on ηT. The value at 75% is approximately 1.22. However, when the magnitude of the earthquake increased, the effect of temperature on the maximum bidirectional displacement increased, as shown in . The value of ηT at 75% is 1.30 for ground motions with an earthquake magnitude in the range of 7.0–7.5 and increased to 1.82 when the magnitude increased above 7.5. In addition, ηT will be relatively larger under a small distance to fault rather than near fault and long distance, as shown in in which the value at 75% is 1.34. For the soil type shown in , the softer the construction soil, the larger the value of ηT; however, the difference is not significant. It can be concluded from that the earthquake characteristics significantly affect the value of ηT; therefore, it should be considered in simulations. In particular, the value of ηT will significantly increase under large earthquake magnitudes and small distances to fault (10 km < Rjb ≤30 km).
Figure 21. Cumulative distribution of ηT for various earthquake classifications.
8. Conclusions
In this study, the velocity and temperature dependencies were combined in friction models and validated using full-scale dynamic tests under multidirectional artificial graphics and earthquake response orbits to examine the behavior of FPBs and validate the accuracy of friction dependencies under real earthquakes. It was found that large force pulses that break out of the conventional bilinear force – displacement relationship may occur for the cases under response orbits compared with those under artificial graphics. These pulses are caused by rapid increases in velocity, which cause high velocity and low temperature to occur simultaneously, resulting in a large friction coefficient. In addition, we constructed a friction model of DCFP bearings using an appropriate constant friction coefficient (nominal friction coefficient) that considers the effect of temperature on friction coefficient under strong GMs as a constant, a bidirectional precise friction model that considers pressure, velocity, and temperature dependencies, and a simplified model. It was found that both precise and simplified models can simulate the break-out force pulse. However, a constant friction coefficient cannot. Furthermore, the simulation results of the precise model were compared with experimental results and we found that the proposed friction dependency equations using small-scale material tests are still applicable to real-size specimens and real earthquakes.
In addition, the accuracy of the friction models in terms of simulating the response displacement was evaluated. It was found that the responses of the simplified model are in close agreement with those of the precise model for both the response force and response displacement regardless of the friction type, strength of the input waves, and shape of the response orbit; therefore, the simplified model can be used, instead of the precise model, for faster calculation. Moreover, the simulation method using the nominal friction coefficient determined from the unidirectional experiments slightly overestimated the maximum response force and underestimated the maximum response displacement under bidirectional ground motion pairs. This indicates that the constant value of the constant friction coefficient should be refined under bidirectional GMs.
A response analysis was performed under one-component GMs and corresponding two-component GMs to clarify the effect of velocity and temperature increase caused by additional perpendicular excitation on friction coefficient and the maximum response displacement. It was found that, except for the bidirectional effect of the ground motion pair and coupling effect, the increase in displacement from unidirectional excitation to bidirectional excitation was mainly caused by the contribution of temperature effect. In contrast, the effect of velocity was relatively negligible under strong ground motion pairs. The effect of temperature contributed an average of 1.1 times amplification to the increase in the maximum displacement for the selected group of ground motions, that is one-third of the total increase (bidirectional effect and coupling effect contributed the other two-third).
We examined the internal mechanism of this displacement increase and found that the addition of the second component resulted in a higher temperature increase, and hence, a smaller friction coefficient and larger response displacement. Because the effect of bidirectional excitation and coupling behavior on maximum displacement is highly related to the characteristics of ground motions, the effect of the temperature increase caused by bidirectional effect on maximum displacement is also considered to be affected by various earthquake characteristics; therefore, it was further investigated under 386 two-component GMs. It was found that this effect is highly related to the magnitude of the earthquake. Moreover, it is considerably large under earthquakes with a small distance to fault. Soft soil conditions increase the effect, and no clear relationship was obtained with the earthquake mechanisms.
This study validated the applicability of the friction dependency equations obtained by small-scale material tests under bidirectional strong ground motions, which provides insurance for applying these equations in earthquake response analysis. Moreover, this study proposed a third major factor affecting displacement increase from unidirectional to bidirectional excitations other than bidirectional effect and coupling effect, the temperature effect, which must be considered under bidirectional isolation design according to earthquake classifications. For example, if a constant friction coefficient is used in earthquake response analysis, the value of the friction coefficient obtained from unidirectional experiments must be decreased slightly based on the temperature effect under bidirectional excitations. In addition, the maximum displacement obtained from unidirectional analysis must be revised under bidirectional excitations by not only considering the bidirectional effect and coupling effect but also considering the temperature effect.
It should be mentioned that, in this study, the effect of the temperature increase caused by an additional perpendicular GM component on the maximum response displacement was discussed for a certain DCFP bearing (medium-friction NS-SSB); Therefore, the conclusions in this study are only available for FPBs using PTFE-related materials and stainless steel. Furthermore, it was proposed in this study that this temperature effect on displacement is affected by GM characteristics. The range of the temperature effect under various friction coefficients, natural periods of isolation systems, and GM classifications is still not clear. Therefore, in future study, the analysis model considering not only the bidirectional effect and coupling effect but also the temperature effect will be applied to study the response of DCFP bearings under various friction coefficients, natural periods of isolation systems, and GM classifications. And the range of the temperature effect under these conditions will be studied.
Acknowledgments
The assistance of Cameron J. Black, Ian D. Aiken, and Gianmario Benzoni during the experiment at the University of California, San Diego is highly appreciated.
Disclosure statement
No potential conflict of interest was reported by the author(s).
References
- AASHTO. 1993. AASHTO Guide for Design of Pavement Structures. Washington, DC, US: American Association of State Highway and Transportation Officials.
- Architectural Institute of Japan. 2016. Design recommendations for seismically isolated buildings. Tokyo, Japan: Architectural Institute of Japan.
- ASCE/SEI 7-16. 2016. Minimum design loads and associated criteria for buildings and other structures. Reston, VA, USA: American Society of Civil Engineers (ASCE).
- Bao, Y., T. C. Becker, T. Sone, and H. Hamaguchi. 2017. Experimental study of the effect of restraining rim design on the extreme behavior of pendulum sliding bearings. Earthquake Engineering & Structural Dynamics 47 (4):906–24. doi:10.1002/eqe.2997.
- Benzoni, G., and F. Seible. 1998. Design of the Caltrans Seismic Response Modification Device (SRMD) test facility (IWGFR–96), Vol. 325. Vienna, Austria: International Atomic Energy Agency (IAEA); International Working Group on Fast Reactors.
- Bertero, V. V., and Y. Bozorgnia. 2004. The early years of earthquake engineering and its modern goal. Earthquake Engineering: From engineering seismology to performance-based engineering. ed. Bozorgnia and VV Bertero. London, UK: CRC Press. doi:10.1201/9780203486245.ch1.
- Bhagat, S., and A. C. Wijeyewickrema. 2017. Seismic response evaluation of base-isolated reinforced concrete buildings under bidirectional excitation. Earthquake Engineering and Engineering Vibration 16 (2):365–82. doi:10.1007/s11803-017-0387-8.
- Calvi, P. M., and G. M. Calvi. 2018. Historical development of friction-based seismic isolation systems. Soil Dynamics and Earthquake Engineering 106:14–30. doi:10.1016/j.soildyn.2017.12.003.
- Calvi, G. M., and V. Spaziante. 2009. Reconstruction between temporary and definitive: The CASE project. Progettazione sismica 3:221–250.
- Constantinou, M. C., A. S. Whittaker, Y. Kalpakidis, D. M. Fenz, and G. P. Warn. 2007. Performance of seismic isolation hardware under service and seismic loading. Technical Rep. No. MCEER-07-0012, MCEER, NY, US.
- De Domenico, D., G. Ricciardi, and G. Benzoni. 2018. Analytical and finite element investigation on the thermo-mechanical coupled response of friction isolators under bidirectional excitation. Soil Dynamics and Earthquake Engineering 106:131–47. doi:10.1016/j.soildyn.2017.12.019.
- De Luca, A., and L. G. Guidi. 2019. State of art in the worldwide evolution of base isolation design. Soil Dynamics and Earthquake Engineering 125:105722. doi:10.1016/j.soildyn.2019.105722.
- Earthquake Protection Systems. n.d. https://www.earthquakeprotection.com/.
- European Committee for Standardization. 2004. General rules, Eurocode 8. Design provisions for earthquake resistance of structures; Part 1: Seismic actions and rules for buildings. BS EN 1998-1, European Committee for Standardization, Brussels, Belgium.
- Furinghetti, M., A. Pavese, V. Quaglini, and P. Dubini. 2019. Experimental investigation of the cyclic response of double curved surface sliders subjected to radial and bidirectional sliding motions. Soil Dynamics and Earthquake Engineering 117:190–202. doi:10.1016/j.soildyn.2018.11.020.
- Furinghetti, M., T. Yang, P. M. Calvi, and A. Pavese. 2021. Experimental evaluation of extra-stroke displacement capacity for curved surface slider devices. Soil Dynamics and Earthquake Engineering 146:106752. doi:10.1016/j.soildyn.2021.106752.
- Hideji, N., N. Koji, and T. Atsushi. 2014. 21241 Development of spherical sliding bearing resisting high bearing pressure (Part 1) [in Japanese]. Tokyo, Japan: Architectural Institute of Japan, Construction II.
- Japan Society of Seismic Isolation. n.d. https://www.jssi.or.jp/index.html.
- Kelly, J. M. 1990. Base isolation: Linear theory and design. Earthquake Spectra 6 (2):223–44. doi:10.1193/1.1585566.
- Kitayama, S., and M. C. Constantinou. 2021. Effect of superstructure modeling assumptions on the seismic performance of seismically isolated buildings. Earthquake Engineering & Structural Dynamics 50 (7):1805–23. doi:10.1002/eqe.3427.
- K-NET. n.d. https://www.kyoshin.bosai.go.jp/
- Koji, N., W. Naoya, and K. Hasegawa. 2017. 21479 Full-scale experiment of low-friction-type spherical sliding bearing on behavior confirmation [in Japanese]. Construction II: Architectural Institute of Japan.
- Kumar, M., A. S. Whittaker, and M. C. Constantinou. 2015. Characterizing friction in sliding isolation bearings. Earthquake Engineering & Structural Dynamics 44 (9):1409–25. doi:10.1002/eqe.2524.
- Li, J., S. Kishiki, S. Yamada, S. Yamazaki, A. Watanabe, and M. Terashima. 2020. Energy-based prediction of the displacement of DCFP bearings. Applied Sciences 10 (15):5259. doi:10.3390/app10155259.
- Li, J., M. Nitawaki, S. Kishiki, T. Ishida, K. Nishimoto, A. Watanabe, and S. Yamada. 2018. Analytical study on spherical sliding bearing (SSB) subjected to tri-directional excitation: Effect of bearing stress and velocity dependency of SSB on the response of isolation system. Summaries of Technical Papers of Annual Meeting, Architectural Institute of Japan, Paper No. 21490, Tohoku, Japan, September 4–6.
- Li, J., S. Yamada, S. Kishiki, S. Yamazaki, A. Watanabe, and M. Terashima. 2021. Experimental and numerical study of spherical sliding bearing (SSB) - part 3: Seismic response. Proceeding 17th World Conference on Earthquake Engineering, 17WCEE, Paper N° C000736, Session No. O01C01, Sendai, Japan, September– October 28–2.
- Lomiento, G., N. Bonessio, and G. Benzoni. 2013. Concave sliding isolator’s performance under multi-directional excitation. Ingegneria Sismica 30 (3):17–32. doi:10.1080/13632469.2013.814611.
- Makris, N. 2019. Seismic isolation: Early history. Earthquake Engineering & Structural Dynamics 48 (2):269–83. doi:10.1002/eqe.3124.
- Mokha, A. S., M. C. Constantinou, and A. M. Reinhorn. 1993. Verification of friction model of teflon bearings under triaxial load. Journal of Structural Engineering 119 (1):240–61. doi:10.1061/(ASCE)0733-9445(1993)119:1(240).
- Mosqueda, G., A. S. Whittaker, and G. L. Fenves. 2004. Characterization and modeling of friction pendulum bearings subjected to multiple components of excitation. Journal of Structural Engineering 130 (3):433–42. doi:10.1061/(ASCE)0733-9445(2004)130:3(433).
- Nakamura, H., K. Nishimoto, H. Hasegawa, and H. Nakamura. 2015. Predictive method of a temperature rise and the friction coefficient of spherical sliding bearing (Part 3), Paper No. 21232. AIJ, Kanto, Japan, September 4–6.
- Nakashima, M., P. Pan, D. Zamfirescu, and R. Weitzmann. 2004. Post-Kobe approach for design and construction of base-isolated buildngs. Journal of Japan Association for Earthquake Engineering 4 (3):259–64. doi:10.5610/jaee.4.3_259.
- Nishimoto, K., H. Nakamura, H. Hasegawa, and N. Wakita. 2016. Bearing stress and velocity dependency of spherical sliding bearing through full-scale tests. Paper No. 21223. AIJ, Fukuoka, Japan, August 24–26 .
- NS-SSB. n.d. https://www.eng.nipponsteel.com/steelstructures/product/base_isolation/nsssb/.
- PEER. n.d. https://ngawest2.berkeley.edu/.
- Ponzo, F. C., A. D. Cesare, G. Leccese, and D. Nigro. 2017. Shake table testing on restoring capability of double concave friction pendulum seismic isolation systems. Earthquake Engineering & Structural Dynamics 46 (14):2337–53. doi:10.1002/eqe.2907.
- Ponzo, F. C., A. D. Cesare, A. Telesca, A. Pavese, and M. Furinghetti. 2021. Advanced modelling and risk analysis of rc buildings with sliding isolation systems designed by the Italian seismic code. Applied Sciences 11 (4):1938. doi:10.3390/app11041938.
- Quaglini, V., E. Gandelli, P. Dubini, G. Vazzana, and G. Farina. 2014. Re-centring capability of friction pendulum system: Experimental investigation. Proceedings of the 2nd European conference on earthquake engineering and seismology, Istanbul, TK.
- Shimazaki, D., and K. Nakagawa. 2015. Seismic isolation systems incorporating with RC core walls and precast concrete perimeter frames-Shimizu Corporation Tokyo Headquarter. International Journal of High-Rise Buildings 4 (3):181–89.
- Takanori, I., N. Masashi, and K. Shoichi. 2018. 21491 Experimental and analytical study on spherical sliding bearing subjected to bidirectional excitation part 1 bidirectional loading tests and verification of mechanical model. Architectural Institute of Japan, Construction II:981–82.
- Warn, G. P., and A. S. Whittaker. 2004. Performance estimates in seismically isolated bridge structures. Engineering Structures 26 (9):1261–78. doi:10.1016/j.engstruct.2004.04.006.