
ABSTRACT
Respondent-driven sampling (RDS) is a methodology for sampling and analysing survey data from rare and elusive populations that has gained increasing attention in migration research in recent years. Since its introduction in 1997, it has been applied in numerous surveys in the field of epidemiology (mainly for the estimation of HIV/AIDS prevalence in high-risk populations) and increasingly in migration research. This article summarises some of the experiences of applying RDS to study migrant populations, in light of some of the key assumptions that the methodology builds on, pointing to the advantages, but also the limitations of this approach. If sample frames of reasonable quality are available or can be produced, this will normally be preferable to RDS. But if no sample frame is available, the RDS methodology does create opportunities for a more systematic approach to the study of marginalized migrant populations, where qualitative studies, and convenience samples thus far have dominated knowledge production.
Introduction
The regulation of migration and mobility has become one of the more salient political issues of our time. Yet, despite the massive focus on migration and its consequences, we still know relatively little about many migrant groups. Whether refugees, labour migrants, or irregular migrants, there is often a demand for better knowledge of who these migrants are, their motives for migrating, and their experiences from the journey or in countries of destination. However, as migrant populations are notoriously difficult to survey, knowledge needs are often not met, mainly due to a lack of access to survey data, in particular for the more marginalised migrant groups.
In recognition of this need to produce survey data for marginalized migrant groups, respondent-driven sampling (RDS) has gained increasing attention in migration research in recent years. Respondent-driven sampling is a methodology for sampling and analysing survey data from rare and elusive populations, that draws on information about networks both to recruit respondents and to produce estimates for populations at large. In terms of precision and variance, RDS can hardly compete with classical probability sampling designs. When sampling frames are available, or if sampling frames can be constructed, through, for instance, stratified cluster samples or other area sampling techniques (Pratesi, Citation2016), this will usually be a better choice. However, in studies of the more marginalized migrant populations, these more traditional sampling designs are often not possible (see discussion on challenges below), or would be too costly to apply. For these populations, it is common to rely on snowballing or other convenience samples to produce data (see, for instance, UNDP, Citation2019; Van Meeteren et al., Citation2009). In such situations, RDS will often be a better option as it enables us to estimate precision, bias and variances for individual estimators.
However, successful application or RDS requires attention to other areas or pitfalls, than do ordinary survey sampling. This article exemplifies these challenges – building on our experiences of applying RDS to different populations of Central/Eastern European migrants in Europe and focuses on two aspects that have proven critical for producing good data: the way the survey population is defined and delimited, and the need to recognise and regulate variation in terms of the speed of recruitment. The article starts with a discussion of why studying migrant populations can be so challenging, and the ways in which RDS addresses these challenges. I then present two surveys that were designed in similar ways, but that had different outcomes – illustrating the importance of adapting the design of an RDS survey to the population in interest. Based on the experiences from these two, and some related surveys, I identify two major challenges for the application for RDS to migrant populations; adapting the survey to the composition of the population (the presence of bottlenecks and in-group recruitment) and adjusting the design if large variation in speed of recruitment appears.
Problems surveying migrant populationsFootnote1
Until recently, RDS was mainly used in public health research but has expanded into other fields, including migration research, in recent years. Existing studies that use RDS to estimate HIV prevalence in high-risk populations typically describe variation across a less diverse range of variables, and the survey populations tend to be smaller and more homogeneous than what is common in studies of migrant populations (see, for instance, Pando et al., Citation2012; Szwarcwald et al., Citation2011)
Migrant groups rarely make up homogeneous populations. Migrants have in common that they have moved within or between countries at some point, but they can be vastly different from one another in their reasons for mobility and experiences as migrants. However, several aspects of migration in itself will often make them hard to reach for survey research. The main problems I will refer to here as problems of inclusion, identification, access, motivation and trust.
The challenge of inclusion concerns the way migrants tend to be under-represented, or even omitted, in official statistics produced in both counties of origin and destination. This can be due to explicit criteria for inclusion in the survey, such as only defining as eligible people who have lived in a given household for more than 3 months in countries of destination, or only registering as household members people who are currently residing in the dwelling in countries of origin. Migrants who live in temporary housing or sleep in buildings defined as commercial (for instance, in the back of a store or a car wash) or in parks or nearby forests also tend to be overlooked when sampling frames are constructed. Yet even when we are able to include migrants in a sample frame they will, in most areas, make up too small a proportion of the overall population to enable us to produce good estimates for characteristics of the migrant population. It will often be necessary to apply a sampling design to specifically target or over-represent migrants. In order to do this, we need some criteria to identify them as migrants and distinguish them from non-migrants. Some countries will have population registers or census data, which register the country of birth and can be used for such purposes. Such a design would, however, not include temporary migrants, irregular migrants or others who are not included in population registers or migrants who have recently arrived.
If they can be identified and included in our sample, migrant populations tend to have a higher non-response rate in surveys (Deding et al., Citation2008). This is in part due to problems of access or no-contact, for instance, because migrants do not speak the language of the survey, or because interviewers do not find the respondent at home. Normally, interviews are conducted during afternoons or evenings when most people are going to be at home. This can result in underrepresentation of people who work irregular or long hours and migrants are often over-represented in this group (Wickramasekara, Citation2008). Limited spare time due to long working hours can also render them less motivated to spend time participating in a survey. Motivation to take part in a survey is also correlated with education (Deding et al., Citation2008), and immigrants often have below-average educational level, compared with the non-immigrant population (Dustmann & Glitz, Citation2011). Finally, non-response rates for migrants can be higher due to lack of trust – either because migrants often score lower for generalised trust (De Vroome et al., Citation2013), or because their legal status (if they are or have been working illegally, or if they are living in or entered the country unlawfully) make them more reluctant to provide information to a stranger. Challenges of marginalisation, racism and xenophobia can add to this, making minority groups distrustful of persons or institutions representing the majority.
These problems of inclusion, identification, access, motivation and trust introduce particular challenges for surveying migrant populations. Respondent-driven sampling can, as we will show in the following sections, mitigate many of these challenges.
Respondent-driven sampling and migrant populations
In respondent-driven sampling, respondents are recruited through networks, starting with a small group of strategically selected persons who are referred to as seeds. All respondents are given a limited number of coupons (normally 1, 2 or 3) that they can give to eligible people in their network (peers) who in turn, can bring the coupon to the survey site to be interviewed. Only eligible people with a valid coupon can be interviewed (Heckathorn, Citation1997; Tyldum & Johnston, Citation2014).
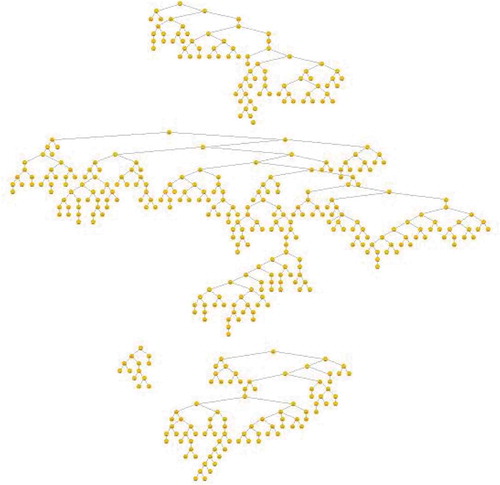
In RDS, the seeds (or starting points) are strategically selected from the more visible parts of the survey population. New recruits then form branches in a recruitment tree, as illustrated in , gradually increasing the sample size and moving into new subgroups of the population. As such, the survey may gradually enter harder to reach subgroups. The aim is to produce recruitment chains that are as long as possible in order to mimic a ‘random walk’ of the network (Gile & Handcock, Citation2010; Johnston, Citation2014). However, as also illustrates, some seeds tend to produce far longer recruitment chains than others.
Figure 1. Example of a recruitment tree from a survey of homeless Romanian migrants in Oslo in 2014. Four seeds producing between 3 and 28 waves of respondents
RDS as a recruitment strategy solves the problems of inclusion and identification associated with migrant populations that we described above, as we rely on people who are themselves members of the target group to identify and recruit potential respondents in the same group. This is an advantage when our survey populations do not have observable characteristics that enable us to distinguish them from the population at large. This is normally the case for migrants; we might not know what nationality or ethnicity all members of our networks identify with, but we will often know who are of the same national or ethnic group as ourselves.
Network recruitment works well for population characteristics that are clustered in subgroups of the population, and as migrants often rely on networks to organise their travel and find work and accommodation while abroad (De Haas, Citation2010; MacDonald & MacDonald, Citation1964), migrant populations are normally well suited for recruitment through networks. However, it is advisable to limit recruitment to singular national (and linguistic) groups, as the language differences and clustering based on nationality, can create bottlenecks in the recruitment (Montealegre et al., Citation2013). This also makes it easier to adapt the survey design to this particular group; questionnaires can be developed in minority languages, interviewers recruited from the same ethnic group, and opening hours can be adapted to the common working ours for this particular migrant group. This addresses the access challenges associated with migrant populations.
RDS does not require us to collect addresses, names or any other identifiable information from respondents. It is, therefore, possible to enable anonymous participation in the survey. RDS is thus particularly well suited for studying marginalised populations or population groups associated with illicit or stigmatised behaviour (Heckathorn, Citation1997; Johnston, Citation2014), addressing the problems of low trust in some migrant populations. Furthermore, as respondents are recruited by former respondents, we can rely on our recruiters to convey a sense of trust in the survey and survey organisation. The recruiter, and their recruiter before them, have already been interviewed and can convey their interview experiences to new respondents. Thus, if respondents are treated with respect during interviews, questionnaires are well designed and participation was experienced as interesting or even enjoyable, former respondents will convey this experience to new respondents, serving as guarantors and building a sense of trust that participation will not have negative consequences.
To encourage participation and recruitment RDS relies on a double incentive structure; incentives are given (usually in the form of cash or gift cards) both for the respondent’s own participation in interviews and for recruiting new respondents. We know from non-response studies that economic incentives have a stronger effect on participation rates for people with less education, thus reducing common biases in surveys in favour of the educated (Groves et al., Citation2000).
Respondent-driven sampling is also a method for analysing data produced through this particular form of network recruitment. Specialised estimators are used, which adjust for variation in network sizes and for differences in patterns of recruitment (Gile et al., Citation2015; Johnston & Luthra, Citation2014). Respondents are asked to estimate the size of their network of people in the target population, and this is used to adjust for variation in probability of inclusion. Additionally, each coupon is marked with a unique identifier associated with the recruiter to enable recruitment chains to be tracked. RDS usually targets populations that are relatively homogeneous; however, even within these homogeneous groups, we need to make sure that the recruitment does not result in too much clustering of similar respondents to secure that probability of being recruited does not vary too much, for instance, for men and women, different age groups, or socio-economic classes. Information from recruitment chains is used to assess if people mainly recruit people similar to themselves (for instance, if men mainly recruit other men although both men and women are targeted) or if there is cross-group recruitment (Gile & Handcock, Citation2015; Heckathorn, Citation2002; Johnston & Luthra, Citation2014). When in-group recruitment is too strong, we get bottlenecks and what is referred to as homophily in RDS terminology. High levels of homophily result in higher variance and design effects. Through the mapping of recruitment chains, RDS estimators can adjust for homophily up to a certain level but only if in-group recruitment is not too strong. This implies that the precision of RDS estimators depends on how the target group responds to RDS recruitment. In the following, I will illustrate this drawing on examples of RDS surveys in different Eastern European migrant populations.
Surveys mapping east-west migration in Europe
In this article I draw on experiences from several RDS surveys among migrants; two surveys of Polish labour migrants in Oslo (Friberg & Eldring, Citation2013; Friberg & Tyldum, Citation2007), one of homeless Romanians in Oslo, Stockholm and Copenhagen (Djuve et al., Citation2015), one among Ukrainian labour migrants in Warsaw (Napierala & Gorny, Citation2013) and one among Polish labour migrants in Reykjavik (Wojtynska, Citation2011). Below I briefly describe the design and implementation of the two first surveys, as their different outcomes are key to the main argument of this article.
Polish migrants in Oslo
In 2006 we used RDS to study living and working conditions among Polish migrants in Oslo (Friberg & Tyldum, Citation2007). With the expansion of the EU to include Poland, Norway experienced an unprecedented influx of labour immigration. Up until 2004, the labour force had been primarily made up of speakers of Scandinavian languages, and shadow labour markets were an almost non-existent phenomenon. A few years after the 2004 expansion, Norway had become one of the largest recipients of labour migrants from Poland relative to population size, second only to Iceland (Friberg & Eldring, Citation2013).
In the 2006 survey, we interviewed 510 Polish labour migrants in the Oslo area and documented how this relatively new migrant group was associated with widespread irregular or illegal employment, where private clients and sub-contractors exploited weaknesses in Norwegian labour market regulations to offer workers conditions of employment that were far from the norms of the regulated labour market (Friberg & Tyldum, Citation2007). The survey also provided important insights into the migrants’ social background, length of stay and family relationships, demonstrating that a significant share of the migrants were not short-term labour migrants, as had previously been assumed, but intended to settle permanently (Friberg, Citation2011, Citation2012).
The Polish migrants were interviewed during a two-month period in autumn and winter 2006. Initially, recruitment was not successful, as is often the case with RDS. Based on information provided by early respondents, we decided to raise economic incentives by 75 percent from NOK 100 (+100 for recruiting two respondents) to NOK 150 (+200 for recruiting two respondents), and simplified the recruitment system and the information given to respondents. After these adjustments, recruitment worked well.
The recruitment coupons told recruited respondents to send an SMS with the word ‘survey’ (in Polish) to a phone number listed, and the survey field coordinators would then call them back to make an appointment for interviews. The address and opening hours of the survey site were also provided on the coupon (together with the phone number), making it possible to drop in for an interview if this was preferred.
Interviews were conducted on the premises of the research institute organising the survey. There was free coffee, tea and hot chocolate and Polish language newspapers and magazines to read while waiting. At the time, quite a few Poles in Oslo were living in overcrowded barracks and, despite working long hours, these groups turned out to be easy to recruit as they enjoyed hanging around in our ‘cafeteria’ before and after the interview. Having access to a quiet place to sit, newspapers and hot drinks and talking to our Polish, mainly female, interviewers served as an incentive in itself.
The survey estimates produced through this RDS turned out to correspond well with what was previously known about this population. Polish labour migrants are a partially visible population in official statistics, as some of them will have registered for residency and pay taxes and receive benefits from the Norwegian government. Some (the ones who pay taxes) have a tax card with a unique registration number that also gives them access to welfare benefits. The survey asked if they had this personal registration number and if they pay taxes, and we could, therefore, identify the subgroup that should be registered as Polish nationals in the population registers. We find a good correspondence between the RDS estimates for this population and official registers, although the group is fairly small and the estimate has relatively large confidence intervals. For instance, the 2006 survey estimated that 14.5 percent (6–22%Footnote2) of the registered population of Poles in Oslo were women, while official registers claimed that 13 percent of the Poles were female. In the non-registered population, women made up a much larger share, as women more often worked in the informal sectors of the economy, often as domestic cleaners. Overall, women were estimated to make up 25 percent of the Poles in Oslo. Similarly, we found that 26 percent of registered Poles with children under 18 years of age actually received child support benefits, whereas official registers indicate that 25 percent of registered Poles with children received such benefitsFootnote3 (Friberg & Tyldum, Citation2007).
Homeless Romanians in the Scandinavian capitals
In 2014, we used RDS to survey homelessFootnote4 Romanians in the three Scandinavian capitals of Oslo, Stockholm and Copenhagen. Following the expansion of EU to include Romania in 2008, a new migrant group appeared in Scandinavia. Migrants from the more marginalised segments of Romanian society, many of them Roma, started to come to beg, collect bottles for reimbursement and other types of informal street work. They would sleep outside in parks, in the woods or in parked cars. Their mobility featured high on the agenda in all Scandinavian countries, triggering debates of the need to (re)criminalise begging and whether the beggars were victims of exploitation or human trafficking. There was, however, only anecdotal knowledge of who these migrants were, their motives for travelling, and their previous experiences of migration and travelling. The survey enabled us to describe the vast variation in the backgrounds, strategies and experiences of these migrant groups. The public discourse on this migrant group had tended to portray them as one unitary network, with shared intentions, experiences and motives. The large variations in place of origin, labour market backgrounds and livelihood strategies contributed to changing the dominant images of these groups (Djuve et al., Citation2015)
The survey was organised much along the same principles as the surveys of Polish migrants in Oslo. Respondents could send an SMS to make an appointment or drop by to be interviewed, and fieldworkers were hired among social workers who knew Romanian/Romanese and knew some members of the population. Nevertheless, in all three cities, recruitment had more challenges, giving less reliable data, than for the Polish labour migrants.
In Oslo, we realised halfway through the fieldwork that subgroups of the population responded differently to the incentives provided. We selected as seeds persons that our field coordinators knew well through their function as social workers, and recruitment proved to be surprisingly successful from the outset in spite of us offering relatively low incentives. However, after about 200 respondents had been interviewed the recruitment stopped. We initiated qualitative interviewing in the survey population to assess what had happened and realised that our incentives were too low to motivate participation among those who did not already know the social workers (our interviewers). The part of the survey population that slept in shelters and relied on other services provided by the NGOs were more likely to trust in our survey organisation, and they were partly motivated by a wish to please the social workers they relied on. Groups that were more ‘hidden’ proved less eager to be recruited. If we had increased the incentives halfway through the survey this would have been perceived as unfair to the first 200 respondents, and the social workers worried that this would jeopardise their relationship with the group that they had worked hard to establish.
To solve this problem, we moved part of our survey organisation out into the city centre to make participation easier. We conducted interviews in parks, shelters and food distribution areas that we knew Romanian migrants would frequent. We also allowed direct recruitment (a respondent would recruit someone immediately after having been interviewed him/herself) so that we could move up 3–6 waves in a recruitment chain in one afternoon. This boosted recruitment and the number of appointments also started to rise in our main fieldwork centre. But this method of recruitment has given data that is highly clustered. Homophily rates are high for certain variables and estimates are not very precise. However, given the limited previous knowledge of this population, the survey still proved important in describing both dominant trends and the large variation in strategies in this population.
Network structure and population definition
Polish migrantsFootnote5 in Oslo turned out to be a population well suited for RDS. We identified no major bottlenecks in the recruitment process and the population was relatively homogeneous and well networked, giving us a sample that reached equilibrium relatively quickly, and where we can assume seed independence. Equilibrium is RDS terminology for the point in recruitment, where the distribution on a given variable, no longer changes as the sample grows. If the distribution continues to change as we collect more data, it may be an indication that the population surveyed is too heterogeneous or clustered for RDS sampling (Gile et al., Citation2015).
The point of equilibrium is illustrated in ; the convergence plot illustrates how the gender distribution in the sample of Polish labour migrants in Oslo changes throughout the process of fieldwork. The distribution of men and women in the sample stabilises at an early point in the survey and does not change much as the sample grows from 10 respondents to 430. This illustrates how the respondents recruited at early stages in the survey are not very different from respondents recruited in later stages of the survey for this particular variable. In RDS terms, this means that equilibrium has been reached for this variable and indicates that data can be used to produce estimates for the population at large. This was, however, not the case in the survey we conducted among Romanian migrants in Oslo.
Figure 2. RDS of Polish labour migrants in Oslo. Convergence plot for share of men in sample
When we designed the survey of homeless Romanians in Scandinavia, we needed to solve a dilemma of how to define the survey population. We assumed that the majority of the homeless Romanians would be of Roma origin but we also knew that there were subgroups of homeless Romanians that were not of Roma origin, and who rarely interacted with their Roma compatriots. It was tempting to delimit our survey population to target only Romanians of Roma origin to avoid targeting two distinct populations that rarely interacted and that we could expect to respond very differently to the survey. From a purely technical RDS point of view, such an approach would have produced better data. However, we would then have overlooked respondent groups linked to the Roma who do not identify as Roma, either because they prefer to think of themselves as Romanian (but who might have grown up in Roma villages and speak Romani – the language most often spoken by the Roma), or because they preferred other related labels (Gypsy, Sinti, etc.). Objections were also made that it would be ethically challenging to produce survey data for these subgroups based on ethnic criteria, as they are among the more marginalised groups in Europe (Trehan & Sigona, Citation2009). We, therefore, decided to define our population in terms of citizenship (Romanian) and not ethnicity.
The convergence plot for the RDS among homeless Romanians in Oslo illustrates the consequence of this choice. The sample never reaches equilibrium on core variables such as gender or ethnicity (see ). The main challenge was the strong differences in recruitment behaviour of the self-defined Roma and non-Roma. There was a group of non-Roma men who identified as labour migrants (and not beggars or bottle collectors), but who were only able to find work periodically. They would not beg and would pick up bottles they found on the street (to get the financial reward for recycling them) but would never search through rubbish for bottles (as many Roma would), unless they had no other way of affording food.
Figure 3. Homeless Romanian in Oslo. Convergence plot for share of non-Roma Romanians (self-defined) in sample
This group of non-Roma men were recruited at high speed in the early phase of the survey, before recruitment had started to work properly for other groups. The unemployed non-Roma men had plenty of time to come in for an interview compared with the bottle collectors, musicians or beggars, who had to ‘work’ during the day. With their limited incomes, and reluctance to beg or search through rubbish, they were more eager to have some cash, exacerbated by a widespread dependence on cigarettes and alcohol. Although non-Roma respondents interacted with Roma on a regular basis in institutions established for the homeless, their often explicit dislike of the Roma made them reluctant to recruit Roma respondents unless there were no other non-Roma to recruit. The group of non-Roma men was, however, relatively small and after two weeks of fieldwork, we had interviewed 80. We assume this was the entire population or at least all those willing to be interviewed. The convergence plot in illustrates how this RDS started out with mainly Roma respondents, and how the high level of recruitment of non-Roma commenced almost immediately. The share of non-Roma continued to increase up until sample size 100 and, at this point, the non-Roma made up three quarters of the sample. From this point on, there were rarely non-Roma respondents coming in for interviews, although there occasionally were some who identified as non-Roma. The non-Roma respondents who came in the later parts of the survey tended to be more similar to the Roma respondents in their replies to the questions in the survey; they sometimes said they could speak Romani (the language often preferred by the Roma) and were more likely to have income from begging or collecting bottles. In other words, it reflected the blurred boundaries between the Roma and non-Roma populations when we used self-identification to distinguish the two.
At the end of the fieldwork, the non-Roma respondents made up a little more than a third of the total sample,Footnote6 and the variable never reached equilibrium. This implies that if fieldwork had continued to include 2–300 more respondents, our estimate for the share who identify as Roma in the population could be different from the estimate from our current sample. Consequently, we cannot make inferences about the distribution of Roma and non-Roma in the population based on this survey. As most of the homeless non-Roma Romanians were men, this also had consequences for gender distribution in the sample, and numerous other variables. However, the advantage of RDS compared with convenience samples is that it has diagnostic tests that can document such weaknesses in our data, and make us aware of the limitations of its applicability.
Bottlenecks
It is a common mistake in RDS is to target respondent groups that do not make up a naturally occurring network (Friberg & Horst, Citation2014). This was also the case in a survey conducted among Ukrainian migrants in Warsaw in 2012, where RDS recruitment gave samples from what appear to be two almost completely distinct populations (see illustration in ). One seed produced a large group of recruits where most respondents were students, while the other two seeds mainly recruited Ukrainians working in construction and cleaning in Warsaw (Napierala & Gorny, Citation2013).
Figure 4. Visualisation of recruitment pattern (recruitment tree) between cleaners (red), construction workers (green), students (blue) and other occupations (yellow). Ukrainian migrants in Warsaw
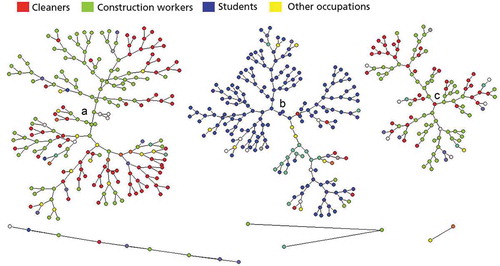
shows how, in the survey among Ukrainian migrants in Warsaw, the probability of being a student is far higher for respondents who can be traced back to seed B, than for those stemming from seeds A and C.Footnote7 The probability of being a construction worker or a cleaner is similarly higher for respondents that can be traced back to seeds B and C. The students engage in systematic in-group recruitment, and the same goes for the construction workers and cleaners, who systematically recruit other construction workers and cleaners rather than students.
Had the in-group recruitment been exclusive, it would be possible to treat these as two distinct populations and analyse them separately. However, the in-group recruitment is not exclusive. Occasionally, a student will recruit a construction worker/cleaner. In theory, this is all it takes for the recruitment to branch off from the student group. However, these construction workers and cleaners do not, in turn, recruit other construction workers and cleaners. Instead, the construction workers and cleaners who were recruited by students tend to recruit new students – the network does not branch off. Similarly, we see that the construction workers stemming from seeds A and C sometimes recruit students, but these students almost never recruit other students.
One of the basic assumptions of RDS methodology is that the recruitment process corresponds to a first order – or memory-less – Markov process (Gile et al., Citation2015; Heckathorn, Citation1997). A memory-less Markov process implies that the characteristics of any given state depend on the characteristics of the immediately preceding state, but not on the state that came before the preceding state. This means that if the probability of a student recruiting another student is higher than the probability of students recruiting a construction worker, the RDS estimators can adjust for this (up to a certain level). However, the probability of a student recruiting another student or a construction worker should be independent of who recruited the student to start with. If this is not the case, we cannot calculate transition probabilities that are stable across seeds and branches.
So how can recruitment processes appear to have ‘memory’? In the case of Ukrainian migrants in Warsaw, it could be hypothesised that there is an underlying social structure related to class and/or age which only partially overlaps with the occupation variable. The construction workers who were recruited by students seem to belong to the same social networks as the students (they may, for example, just be working temporarily to finance their studies) and have very little involvement with the main branch of construction workers from seeds A and C. If variables do not capture such underlying dividing lines within the population, stable transitional probabilities cannot be calculated.
Speed of recruitment
The above-described bottlenecks in the recruitment of Roma and non-Roma respondents in the Oslo survey were boosted by differences in the speed of recruitment in the two sub-populations. This is a common problem in RDS surveys of migrant populations and needs to be addressed to secure good quality data. Variation in the speed of recruitment was even more pronounced in our survey among Polish workers in Oslo.
A substantial part of our Polish respondents worked long hours and the majority preferred being interviewed between 8 p.m. and 10 p.m. on weekdays or on weekends, and our field organisation was adapted to accommodate this. Recruitment also went quite smoothly for the group that worked long hours, as they lived in overcrowded barracks with little to do in their spare time. A group that was more challenging to reach were young women who worked as au pairs; some of them would only have Sundays off and could only be interviewed then. When an au pair was recruited it was therefore not uncommon for it to take two weeks before the next interview took place. Male construction workers would on average recruit within one or two days. This resulted in large differences in the speed of recruitment for various respondent groups. While some branches of the recruitment tree would reach wave 12 in two weeks, others would still be at wave 4. As the number of respondents doubled from one wave to the next (with two coupons), such differences in tempo of recruitment have a major impact on the composition of the sample. In the Oslo survey, we found a strong correlation between characteristics of respondents, their working and living conditions and their speed of recruitment. As our target sample size was 500, we risked filling our sample with posted workers who had nothing to do in their spare time while we had too few women and family fathers in our sample to be able to say anything about them. We, therefore, decided to stop all recruitment beyond wave 12 to allow the slower recruiting branches to catch up.
In a similar survey conducted among Poles in Reykjavik, long recruitment chains were not closed down but allowed to develop almost to the end of the survey, at which point some branches had reached wave 26 while others were still recruiting early waves. Being a small island community, Iceland has relatively good register data for its migrant population and in official registers, unemployment among Polish residents was reported to be between 22 and 25 percent in the fieldwork months. The survey estimated unemployment of 31 percent. On closer inspection of the data, we found that the unemployed were recruited more rapidly than other groups, probably because they could come at times less convenient for those working and because they were in more need of money. If we adjust estimates for the speed of recruitment, the level of unemployment among Poles in Reykjavik is estimated to be 26 percent for the three months of fieldwork, a number that is much closer to that of official registers.
If speed of recruitment varies significantly between groups, there are three different strategies that can be applied to adjust for this. In the 2007 survey of Poles in Oslo, all recruitment chains were stopped at wave 12 to allow the slower recruiting chains to catch up. Such an approach is, however, in conflict with the key aim of RDS to reach long recruitment chains. It is also possible to put validation dates on coupons, forcing all respondent groups to wait a specific number of hours or days before they come in for interviews. Such an approach should be implemented with care to make sure that recruitment does not drop because respondents forget to recruit because of the wait. A final option is to adjust for variation in the speed of recruitment when analysing the data. In the current version of RDS analysts (http://wiki.stat.ucla.edu/hpmrg/index.php/RDS_Analyst_Install), such adjustments are now made possible if the interview date for the respondent and recruiter is entered. However, if the differences in tempo of recruitment are large, and sample sizes are relatively small, there is still a risk of not getting enough respondents from the slower recruiting groups to make proper inferences, if such an approach is chosen.
Conclusion
RDS is a methodology for producing and analysing survey data that holds significant potential for improving our knowledge of more marginalised migrant groups. While the more established migrant groups are increasingly targeted in official statistics, methodologies are still poorly adapted to surveying more marginalised migrant groups, including irregular migrants, asylum seekers, and temporary workers in the informal sectors of the labour market. This has given a lack of systematic studies of these migrant groups, leaving descriptions of what happens in these highly politicized fields open to NGOs and political actors, who sometimes cherry pick among qualitative studies and convenience samples to find descriptions that suit their purpose.
RDS provides an opportunity to do produce more systematic survey data on marginalised migrant groups, to better understand the causes and consequences of their mobility. However, the RDS methodology builds on a number of assumptions that cannot always be met. This means that the RDS methodology must be implemented with close monitoring of how the recruitment process develops, and with an awareness of the many limitations associated with it.
In this article, I have addressed two key issues that are particularly important when RDS is used to survey migrant populations: ensuring that the eligibility criteria correspond with a naturally occurring network, and the importance of monitoring the speed of recruitment during fieldwork.
For most survey sampling, design is developed in full prior to fieldwork, and implementation can be delegated to a fieldwork organisation that rarely needs to make adjustments after fieldwork starts. RDS is not like this but demands close monitoring and more hands on approach to allow for adaptations also during fieldwork. RDS data are better if the survey is able to produce long recruitment chains. This gives access to less visible subgroups of the population that normally is not included in convenience samples, and increases chances that equilibrium is met. When recruitment chains are long, it is however particularly important to keep an eye on the tempo of recruitment.
The quality of data produced through RDS will depend on how the population responds to the recruitment. Sometimes, there will be too much clustering and differences in recruitment behaviour between groups for the data to be used to generalise to the population at large. Nevertheless, RDS has an advantage over convenience samples in that it provides tools that enable an assessment of the quality of data, allowing us to take this into account in our reporting and analysis.
Disclosure statement
No potential conflict of interest was reported by the author.
Additional information
Funding
Notes on contributors
Guri Tyldum
Dr. Guri Tyldum is a sociologist and senior research fellow at Fafo. Her current research interests lie in the study of migration aspiration, migration decisions and migration flows, and she has published extensively on marginalised migrant groups, human trafficking and ethical and methodological issues for studies of rare and elusive populations
Notes
1. This section draws on some paragraphs in the introduction from (Tyldum & Johnston, Citation2014).
2. 95% confidence interval.
3. Confidence intervals here are large, as this is a relatively small group and there is some in-group recruitment among some male construction workers.
4. The population was usually not homeless in a strict sense, as they would normally have dwellings in Romania. While in Scandinavia they would however either sleep rough, or stay in shelters or rent a mattress on a daily basis in informal lodging for low-income migrants.
5. The survey population was delimited to only include migrants who had arrived for the first time after 2004, excluding the parts of the population that had come as refugees earlier.
6. The RDS software does not recognise that this is a finite population. The estimators treat it as a bottleneck and boost these numbers in the estimators for the population, although it would probably be more accurate to estimate the share in the total population to be less than 30 percent, as the majority of the non-surveyed population is assumed to be Roma.
7. Note that there are also three additional seeds from which only limited recruitment occurred.
References
- de Haas, H. (2010). The internal dynamics of migration processes: A theoretical inquiry. Journal of Ethnic and Migration Studies, 36(10), 1587–1617. https://doi.org/10.1080/1369183X.2010.489361
- De Vroome, T., Hooghe, M., & Marien, S. (2013). The origins of generalized and political trust among immigrant minorities and the majority population in the Netherlands. European Sociological Review, 29(6), 1336–1350. https://doi.org/10.1093/esr/jct018
- Deding, M., Fridberg, T., & Jakobsen, V. (2008). Non-response in a survey among immigrants in Denmark. Survey Research Methods. 2(3), 107–121. https://doi.org/10.18148/srm/2008.v2i3.98
- Djuve, A. B., Friberg, J. H., Tyldum, G., & Zhang, H. (2015). When poverty meets affluence. Migrants from Romania on the streets of the Scandinavian capitals. Oslo: Fafo.
- Dustmann, C., & Glitz, A. (2011). Migration and education. In Hanushek, Eric A., Stephen J. Machin, and Ludger Woessmann, (eds) Handbook of the economics of education (Vol. 4, pp. 327–439): Elsevier.
- Friberg, J. H. (2011). Culture at work: Polish migrants in the ethnic division of labour on Norwegian construction sites. Ethnic and Racial Studies, 35(11), 1914–1933. https://doi.org/10.1080/01419870.2011.605456
- Friberg, J. H. (2012). The stages of migration. From going abroad to settling down: Post-accession Polish migrant workers in Norway. Journal of Ethnic and Migration Studies, 38(10), 1589–1605. https://doi.org/10.1080/1369183X.2012.711055
- Friberg, J. H., & Eldring, L. (Eds.). (2013). Labour migrants from Central and Eastern Europe in the Nordic countries. Patterns of migration, working conditions and recruitment practices (Vol. 2013:570). Nordic Council of Ministers.
- Friberg, J. H., & Horst, C. (2014). RDS and the structure of migrant populations In G. Tyldum & L. G. Johnston (Eds.), Applying respondent driven sampling to migrant populations. Lessons from the field. (pp. 17–26) Palgrave Macmillan.
- Friberg, J. H., & Tyldum, G. (2007). Polonia i Oslo. En studie av arbeids- og levekår blant polakker i hovedstadsområdet. Oslo: Fafo.
- Gile, K. J., & Handcock, M. S. (2010). Respondent-driven sampling: An assessment of current methodology. Sociological Methodology, 40(1), 285–327. http://www.ncbi.nlm.nih.gov/pmc/articles/PMC3437336/ https://doi.org/10.1111/j.1467-9531.2010.01223.x
- Gile, K. J., & Handcock, M. S. (2015). Network model-assisted inference from respondent-driven sampling data. Journal of the Royal Statistical Society: Series A (Statistics in Society), 178(3), 619–639. https://doi.org/10.1111/rssa.12091
- Gile, K. J., Johnston, L. G., & Salganik, M. J. (2015). Diagnostics for respondent-driven sampling. Journal of the Royal Statistical Society: Series A (Statistics in Society), 178(1), 241–269. https://doi.org/10.1111/rssa.12059
- Groves, R. M., Singer, E., & Corning, A. (2000). Leverage-saliency theory of survey participation – Description and an illustration. Public Opinion Quarterly, 64(3), 299–308. <go to isi>://000166024000004 https://doi.org/10.1086/317990
- Heckathorn, D. D. (1997). Respondent-driven sampling: A new approach to the study of hidden populations. Social Problems, 44(2), 174–199. https://doi.org/10.2307/3096941
- Heckathorn, D. D. (2002). Respondent-driven sampling II: Deriving valid population estimates from chain-referral samples of hidden populations. Social Problems, 49(1), 11–34. <go to isi>://000174752600002 https://doi.org/10.1525/sp.2002.49.1.11
- Johnston, L. G. (2014). Sampling migrants: How respondent driven sampling works. In G. Tyldum & L. G. Johnston (Eds.), Applying respondent driven sampling to migrant populations: Lessons from the field (pp. 9–16). Palgrave Macmillan UK.
- Johnston, L. G., & Luthra, R. (2014). Analyzing data in RDS. In G. Tyldum & L. G. Johnston (Eds.), Applying respondent driven sampling to migrant populations: Lessons from the field (pp. 84–100). Palgrave Macmillan UK.
- MacDonald, J. S., & MacDonald, L. D. (1964). Chain migration ethnic neighborhood formation and social networks. The Milbank Memorial Fund Quarterly, 42(1), 82–97. http://www.jstor.org/stable/3348581
- Montealegre, J. R., Risser, J. M., Sabin, K., Selwyn, B. J., & McCurdy, S. A. (2013). Effectiveness of respondent driven sampling among undocumented Central American immigrant women in Huston, Texas. AIDS and Behaviour, 17, 719–727. https://doi.org/10.1007/s10461-012-0306-y
- Napierala, J., & Gorny, A. (2013) Assessment of effectiveness of RDS sampling method in migration studies[Paper presented]. Examining Migration Dynamics: Networks and Beyond, Unviersity of Oxford, UK.
- Pando, M. A., Balán, I. C., Marone, R., Dolezal, C., Leu, C.-S., Squiquera, L., Rodriguez Fermepín, M., Gallo Vaulet, L., Rey, J., Picconi, M., Carballo-Diéguez, A., Avila, M. M., & Barreda, V. (2012). HIV and other sexually transmitted infections among men who have sex with men recruited by RDS in Buenos Aires, Argentina: High HIV and HPV infection. PloS One, 7 (6) e39834 https://doi.org/10.1371/journal.pone.0039834
- Pratesi, M. (2016). Analysis of poverty data by small area estimation: John Wiley & Sons.
- Szwarcwald, C. L., de Souza Júnior, P. R. B., Damacena, G. N., Junior, A. B., & Kendall, C. (2011). Analysis of data collected by RDS among sex workers in 10 Brazilian cities, 2009: Estimation of the prevalence of HIV, variance, and design effect. JAIDS Journal of Acquired Immune Deficiency Syndromes, 57, Supplement 3, S129–S135. https://doi.org/10.1097/QAI.0b013e31821e9a36
- Trehan, N., & Sigona, N. (Eds.). (2009). Romani politics in contemporary Europe: poverty, ethnic mobilization, and the neoliberal order. Palgrave Macmillan.
- Tyldum, G., & Johnston, L. (Eds.). (2014). Applying respondent driven sampling to migrant populations. Lessons from the field. Palgrave Macmillan.
- UNDP. (2019). Scaling Fences: Voices of Irregular African Migrans to Europe. UNDP
- Van Meeteren, M., Engbersen, G., & Van San, M. (2009). Striving for a better position: Aspirations and the role of cultural, economic, and social capital for irregular migrants in Belgium. International Migration Review, 43(4), 881–907. https://doi.org/10.1111/j.1747-7379.2009.00788.x
- Wickramasekara, P. (2008). Globalisation, international labour migration and the rights of migrant workers. Third World Quarterly, 29(7), 1247–1264. https://doi.org/10.1080/01436590802386278
- Wojtynska, A. (2011). From shortage of labour to shortage of work: Polish unemployed immigrants in Iceland. In Á. G. Asgeirsdottir, H. Bjørnsdottir, & H. Olafs (Eds.), Rannsoknir i felagsvisindum XII. (pp. 46–56). University of Iceland.