
 ?Mathematical formulae have been encoded as MathML and are displayed in this HTML version using MathJax in order to improve their display. Uncheck the box to turn MathJax off. This feature requires Javascript. Click on a formula to zoom.
Abstract
We analyze fish pricing in the São Paulo wholesale market, the second largest seafood market in South America. Quantitative price analysis is complemented by interviews with participants in the value chain to answer how the multitude of fish products supplied in this market are related and the challenges facing future growth. The results reveal a clear separate pricing of domestically produced fishery species (whitefish and pelagics) from the internationally traded aquaculture species (tilapia and salmon). Tilapia and salmon are uniquely priced, less volatile and more persistent with a price dynamic more akin to local terrestrial meats. Fishery prices show large month-by-month fluctuations and compete more with each other. Participants in the different levels of the value chain corroborate the uniqueness of salmon and state a preference for stable availability and low prices, with less concern about the specific sourcing of fish (aquaculture/fisher, or domestic/imported).
Introduction
The CEAGESP wholesale market in São Paulo is the second largest seafood wholesale market in Latin America (Companhia de Entrepostos e Armazéns Gerais de São Paulo [CEAGESP], 2021), selling 200 tonnes of seafood per day. This paper investigates the pricing of fish at the CEAGESP wholesale market. We analyze the price history of 17 major species to investigate to what degree different species share common pricing, e.g., are in competition/show substantial substitutability. We look at common pricing across different types of fish (whitefish/pelagic/salmonids) and different sourcing (fishery/aquaculture).Footnote1 We follow up the price analysis with a presentation of responses from interviews with participants in the value chain. This reveals features of the fish product space that are valued by market participants and is used to complement the price analysis.
Analyzing common pricing reveals how consumers value different species in relation to each other. This can provide valuable information for policy efforts to support the expansion of seafood consumption in Brazil. For instance, our results suggest that aquaculture species (salmon and tilapia) share no common pricing with each other or with the many domestic fishery species in this market. As such, expansion of these product forms in the market is unlikely to have large negative price effects on the domestic fisheries species. On the other hand, major domestic whitefish species such as whitemouth croaker and codling show a high degree of common pricing, suggesting strong substitutability and a need to evaluate these species jointly in the market.
Brazil has historically been one of the world’s largest producers of poultry, beef and pork. This pattern is also reflected in domestic consumption, with poultry being the main consumed protein (OECD, Citation2021). However, demand for fish has increased over the last decades. Seafood consumption reached a peak in 2014, with ∼13 kg per capita (from which ∼8 kg was of fish), but has since declined somewhat (). Overall, the per capita consumption is low compared to the average seafood available for consumption worldwide—20 kg/person/year. In addition, a small share of the population is responsible for most of this consumption and is concentrated in the North-Northeast region (Kato et al., Citation2021; Sonoda et al., Citation2012). The richest markets which are located mainly in the Southeast regions, such as São Paulo and Rio de Janeiro states, eat the least fish. This points to a potentially underdeveloped seafood market, given Brazil’s 212 million inhabitants, an increasing awareness around healthy eating habits and cheaper and convenient imported and aquaculture seafood products available.
Figure 1. Apparent seafood consumption per capita per year in Brazil, and its components (domestic production from capture and aquaculture, imports, and exports) from 2000 to 2020. Apparent consumption per capita is defined as production (from aquaculture and fisheries) plus imports minus exports, divided by population. Source: FAO (Citation2021) ans Seafood Brasil (Citation2021).
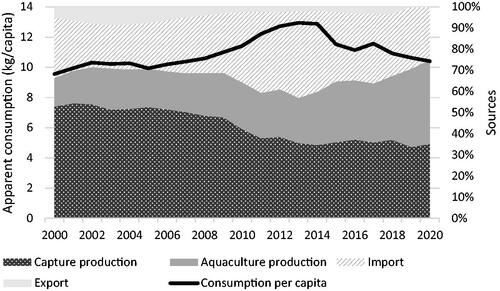
As seen in , the main source of seafood in Brazil used to be domestic fisheries (capture production), but overexploitation and weak governance have limited this source’s contribution to domestic consumption (Pincinato & Asche, Citation2016a, Citation2018; Pincinato & Gasalla, Citation2019). Brazilian fisheries offer a diverse species portfolio, but sardines and whitemouth croaker can be considered the main groups of domestic fisheries products.Footnote2 In the last decades, domestic aquaculture and imports have filled the gap in seafood supply. The increase in aquaculture production has mainly been driven by tilapia and some native species, such as tambaqui (Muñoz et al., Citation2017; Pincinato & Asche, Citation2016b). While imports have been led by sardines, salmon and whitefish (e.g., cod and Alaska pollock). Some of the imported fish, such as salmon and salted and dried cod, are related to cultural traditions (e.g., Portuguese cuisine) and food trends (e.g., Japanese cuisine). Some cultural traditions are related to societal festivities, such as Easter (Good Friday) and Christmas holidays, which also add a seasonal dimension to seafood consumption in Brazil.
A relevant question that our analyses seek to address is to what degree the aquaculture and imports expansion has affected domestic fishery prices. Origin (e.g., domestic vs imported) and production technology (e.g., fisheries vs. aquaculture) can lead to market segmentation and/or expansion depending on the degree of market integration between the products within the market (Ankamah-Yeboah & Bronnmann, Citation2018; Landazuri-Tveteraas et al., Citation2021; Pincinato & Asche, Citation2016a, Citation2018; Salazar & Dresdner, Citation2020). Thus, establishing seafood market boundaries and interactions between products (e.g., substitution effects) are important to understand the potential of seafood production and marketing opportunities. For instance, a differentiated product facilitates higher prices in limited consumer segments (Asche et al., Citation2021; Lim et al., Citation2018; Zhang et al., Citation2020). Integrated products, i.e., close substitute, facilitates the expansion of the product in the wider seafood market. Supporting the expansion of aquaculture and imports in the domestic markets will be easier if these products directly compete with the domestic fishery prices.
The next section presents the São Paulo wholesale market and the main species groups in the market. We then conduct an empirical analysis of the seafood prices, before presenting the results of interviews with participants in the seafood value chain. Finally, we offer some concluding remarks.
São Paulo seafood market and value chain
The São Paulo state is located in the Southeast region of Brazil, with a population of almost 47 million people. This large population center in the region, along with important logistics infrastructure (e.g., the biggest port in Brazil—Porto de Santos, the main airport—Guarulhos, and one of the main cargo airports in Latin América—Viracopos, and a major wholesale market—CEAGESP) makes São Paulo an important hub for seafood in South America.
The state is not only a major producer of both farmed and wild caught fish, but also a major importer (Instituto de Pesca de São Paulo, Citation2021; Ministério da Economia, Citation2021). There are approximately 175 importers specialized in seafood in Brazil (Ministério da Economia, Citation2021). Most of them are registered in São Paulo (56), followed by Santa Catarina (37). They focus mainly on frozen fish fillets (Barone et al., Citation2017). The major seafood production in this region comprises tilapia, from aquaculture, and sardines and whitemouth croaker from fisheries.
There are several different value chains depending on the production region within the country, production system (e.g., small scale or industrial fisheries, and cage or pound farming systems), and product market (e.g., whole or fillet). For instance, tilapia culture in São Paulo has grown enormously using cage culture in reservoirs and focus on the tilapia fillet market. For this value chain, part of production goes to processing plants and then directly to the retail market (e.g., supermarkets) (Barroso et al., Citation2019). However, there are other producers that sell their whole fish to distributers, and/or the wholesale market, and then to restaurants and fishmongers.Footnote3
A major node in the value chain is the São Paulo wholesale market (CEAGESP), which is the second largest seafood wholesale market in Latin America selling 200 tonnes/day of seafood (CEAGESP, Citation2021). Marine fish represent 60% of sales, followed by 30% farmed (freshwater) seafood, and 10% imports. The South and Southeast states are the main source of the domestic seafood in the market, with sardines, weakfish, whitemouth croaker, and tilapia as the main species available. Imported seafood includes Chilean salmon, frozen whitemouth croaker, and hake fillet (CEAGESP, Citation2021). The CEAGESP is particularly important to food services, and smaller supermarkets (Wilkinson et al., Citation2006).
At the self-service retail level, supermarkets, fairs, fishmongers, and markets are the main suppliers to final consumers. In fact, supermarkets have not only increased their share in the Brazilian seafood market, but also shortened the supply chain since the 1990s (Sonoda et al., Citation2002; Wilkinson et al., Citation2006). According to Wilkinson et al. (Citation2006), supermarkets in the main cities, such as São Paulo, have been able to impose standards, which also complies with government regulations, and to develop independent marketing and distribution channels. For instance, suppliers must meet supermarkets’ quality standards for fresh fish or the product is returned, while prices are subject to negotiation to secure the lowest price (which is paid within thirty to fifty days). In addition, supermarkets tend to purchase directly from importers, nearby sources from the domestic industrial fisheries, and aquaculture (direct producers or their immediate suppliers), especially for fresh fish.
Seafood end consumers are increasingly buying convenience products at supermarkets or deliveries, in particular after the pandemic (Kato et al., Citation2021). However, restaurants and other food services have also been important in the value chain for seafood consumption in São Paulo. These include restaurants specialized in seafood, and other cuisines with seafood tradition (e.g., Japanese and Portuguese), buffets, bars, pizza places, bakeries. Even for non-specialized restaurants it is relatively common to offer a seafood option in the menu at least on Fridays; a tradition related to religious costumes. In general, in 2021, the food industry jumped 3.2% and 1.3% in sales and physical production, respectively. Together, the domestic and foreign markets were responsible for revenues of ∼186 billion 2021 USD (922.6 billion BRL), 16.9% higher than in 2020. In this scenario, the performance of food service was also outstanding. Considering only sales to the domestic market, which represent 73.5% of sales, the increase was 1.8%, driven by the food service sector, which accounted for 26.3% of industry sales in 2021, compared to 24.4% in 2020, according to Associação Brasileira da Indústria de Alimentos (ABIA, 2022). Another survey from Instituto Food Service Brasil, (Citation2022) showed that spending on food away from home represented ∼33 billion 2021 USD (164.4 billion BRL) in 2021. Each Brazilian spent an average of ∼3.3 BRL 16.21 per meal, an increase of 12% compared to 2020, due to, among other factors, digital transformations in food market.
Main species groups analyzed
Daily fish prices were collected from the São Paulo wholesale market (CEAGESP) website from August 2013 to July 2021. This includes 14 categories of domestic wild caught marine fish, 2 categories of domestic farmed fish, and 3 categories, which are imported or partly imported (). These species were selected according to their price data availability, i.e., the most frequently traded in the market, which indicates that these species are among the main marketed species. They also represent different sourcing (i.e., fisheries, aquaculture and imports), and price ranges. Appendix 1 provides a summary of the species s together with sourcing and markets.
Table 1. Descriptive statistics of fish and meat prices.
In addition to the fish prices, we also collected comparable price data on chicken, livestock (beef), and pork (CEPEA, Citation2021). More specifically, surveyed prices of whole chicken (chilled and frozen), fed male, castrated or not, common and tracked cattle (arroba), and live swine ready to be slaughtered (male or female, from 80 to 120 kilos).
Price analysis and results
plots price indices for fish and meats in São Paulo from August 2013 to July 2021. The price index tracks the cost of spending the average monthly Brazilian salary on meat (chicken, poultry, and pork) or fish (the 17 São Paulo wholesale market fish species), normalized to 100 for the first 12 months of the sample, August 2013 to August 2014. The index is calculated as where
is a single product price,
is a reference kilogram of product purchased, and
is the equally weighted average product price from August 2013 to August 2014. The reference quantity
is the full sample average such that the share of wages spent on each product in the index is the same each month.
Figure 2. Monthly fish and meat price indices for São Paulo August 2013 to July 2021. Source: CEAGESP (Citation2021) and CEPEA (Citation2021).
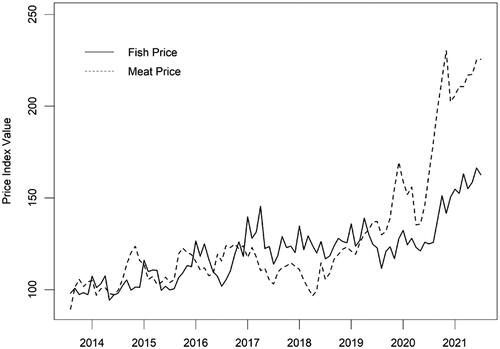
The figure reveals that both fish and meat costs increased similarly up to around the start of the Covid-19 pandemic. Since then, the cost of meat has increased considerably, both in absolute terms and relative to fish.Footnote4 Fish in São Paulo has become relatively cheaper, and so has remained an important source of cheaper protein for domestic consumers during the crisis.
In we provide more detailed descriptive price statistics of the products making up the price indices and analyzed in this chapter. We report the sample mean prices (R$/kg), the coefficient of variation of the prices (measuring long run low frequency volatility), and the standard deviation of monthly logarithmic price changes (Volatility). We also highlight the production mode (Fishery/Aquaculture), the primary production source (Domestic/Imports), and species type (Whitefish, Pelagic, Salmonids). We also classify whether prices are trend stationary (TS) or non-stationary/stochastic trend (NS) according to the results from unit root tests ().
Table 2. Unit root test statistics.
There is price variation across fish species. We observe that whitefish, such as whitemouth croaker, codling and tilapia, have similar prices to chicken and pork. On the other hand, high value species, such as salmon and common snook, are far more expensive than beef.
With the exception of largehead hairtail, the unit root analysis is able to classify the fish species into fishery and aquaculture sourcing. Specifically, all aquaculture species show evidence of stochastic trends, while the fishery prices are all classified as trend stationary. Consistent with this, price volatility of aquaculture species is lower than fishery species. Price variation in aquaculture species is persistent (low frequency variation), as is revealed by the higher C.V. being relatively higher than volatility for aquaculture. On the other hand, fishery prices tend to be dominated by more short run volatility. The lower volatility of aquaculture species is consistent with the findings in Dahl and Oglend (Citation2014) and can be explained by the larger control over production and supply in aquaculture together with the substantial international trade in these products limiting the price effects of idiosyncratic local supply/demand shocks. This makes the price dynamics of the aquaculture species more similar to the terrestrial meats.
Most of the fishery products supplied at the wholesale market have considerable domestic production. The vulnerability of these products to specific supply/demand shocks, such as domestic catch variations, means consumers of these fishery products are exposed to considerable month-by-month variation in the purchase prices. The aquaculture prices provide far less month-by-month price variability for purchasers. For restaurants, this translates to far more stable costs buying aquaculture species. Individual species price volatility can be hedged by purchasing a portfolio of products. The efficiency of this however depends on how correlated price movements are.
Short run price correlations
We now look at correlations in monthly logarithmic price changes across the different products. Specifically, we calculate correlations between all price pairs i,j, where
shows product pairs with statistically significant short run correlations (p-value < 0.01). Amberjack and yellowtail show highly correlated monthly price changes. These are both domestically produced large pelagic fish relatively similar and high valued. Whitemouth croaker and codling, two low prices domestically produced whitefish, also show high correlation in monthly price changes. Both of the above pairs are therefore likely strong substitutes in the market. In general, perch and whitemouth croaker are the two fishery species with the highest number of positive significant short run correlations with other fish species at the market. For the meats, chicken and pork are correlated but show no short run correlation with fish prices.
Figure 3. Significant (p-value < 0.01) correlations in monthly logarithmic price changes.
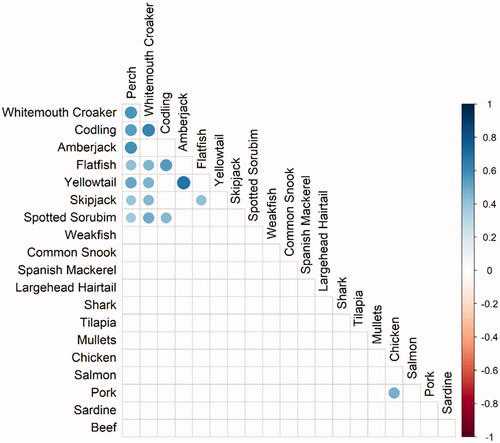
Neither tilapia or salmon show any significant month-by-month correlation in prices to any other fish species. Spotted sorubim, a domestically produced freshwater catfish, show a significant positive correlation with domestically produced fishery whitefish (perch, whitemouth croaker, and codling). This suggests some substitution between the marine fishery and aquaculture produced whitefish.
Overall, we observe mainly significant month-by-month price correlations within the domestic whitefish group and the large pelagic fish group.
Long run relationships: stationary prices
Stationary prices cannot share any long-run relationship with non-stationary prices. This means the aquaculture and terrestrial meat prices, which have stochastic trends, do not share any long run price relationship with the fishery species.
We evaluate the hypothesis that two species within the group of stationary fishery prices do not share a significant long-run price relationship.
To do so we estimate linear regression models and evaluate the price coefficient
A
different from zero means significant common pricing. The regressions are conducted for all combinations of species pairs.
Since different species prices have different volatility, the estimated price coefficients will differ conditional on which species in a pair is chosen as the dependent variable. Because of this, reports price level correlations for species pairs that show a significant long run price relationship (value < 0.01). These correlations are just parameters for standardized prices. For instance, the price correlation of 0.84 between whitemouth croaker and codling means that when one of these prices increase by one standard deviation, the other price increases on average by 0.84 standard deviations.
Figure 4. Significant (p-value < 0.01) price level correlations among stationary fish prices. Significance evaluated using Newey West standard errors.
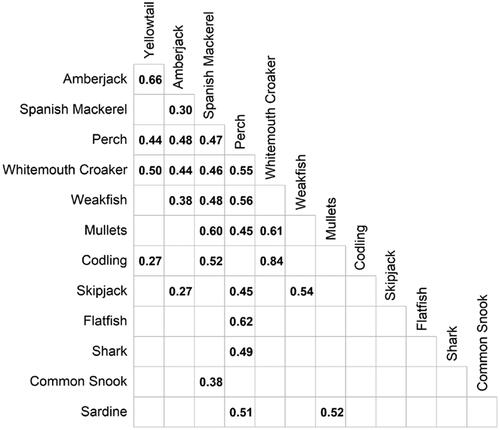
All significant price relationships are positive. The two whitefish species, whitemouth croaker and codling, show a very high degree of common pricing with correlation of 0.84. Amberjack and yellowtail also show strong common pricing with a correlation of 0.66. Perch also shows strong common pricing with flatfish.
There is a fairly high degree of common pricing within all fishery prices, with perch being the species that share common pricing with the greatest number of other species. Flatfish, shark and common snook have the least degree of common pricing with other fishery species.
Long run relationships: non-stationary prices
We next move to the non-stationary aquaculture and domestic meat prices. To evaluate significant long-run price relationships we now test for cointegration using the Johansen (Citation1988) procedure. We form bivariate VAR models for each price pair and test for the rank of the cointegrating matrix. A rank of one implies a common stochastic trend and a significant long run price relationship.
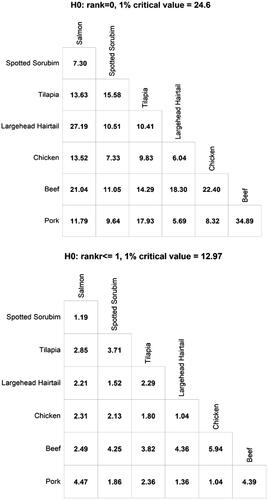
shows the results of the cointegration rank test. The first upper table shows the test statistics for rank of zero, while the bottom table shows test statistics for rank < = 1. Only two of the pairs (largehead hairtail and salmon, and pork and beef) reject zero rank. This implies the rest of the price pairs show no evidence of common trends. Both the price pairs fail to reject rank < = 1, which implies cointegration. Given that largehead hairtail price shows mixed evidence of non-stationarity (), and the fact that this is a cheap pelagic fish, its common trend with salmon is likely coincidental. There are no clear economic reasons, either on the production or consumption side, why these species should share a common long-run price relationship.
Figure 5. Trace test statistics for the rank of the bivariate cointegration matrix. A stable price relationship requires rejection of the first H0: r = 0 but non-rejection of H0: r < = 1, implying a common stochastic price trend. Specification assumes unrestricted constant, and lag order of the VAR testing equation selected according to the AIC with a maximum lag of 6 months.
Tilapia is priced uniquely in the São Paulo wholesale market. According to Barroso et al. (Citation2017) whole tilapia’s potential substitutes include weakfish, tucunaré, snapper, whitemouth croaker, and dourado. While for tilapia fillets substitutes include hake, pangasius, weakfish, shark, cioba, and flatfish. Thus, the potential substitutes include not only relatively cheap fish (some weakfish and whitemouth croaker), but also some expensive groups, such as flatfish, and snapper. However, tilapia is an internationally traded fish with a substantial global production volume. Some Brazilian production is exported, and so is exposed to international competition. Because of this, tilapia prices are unlikely to be substantially affected by domestic Brazilian demand. Furthermore, the prices of potential substitutes for tilapia in the São Paulo wholesale market do not appear to be influenced by tilapia prices to any statistically significant degree.
Interviews
In order to understand better how the several fish species analyzed are related, and to address opportunities and challenges in the seafood value chain in the São Paulo region, semi-structured explorative interviews were carried out during 2019 with two importers, two distributors, one retailer, and five restaurant owners/managers, covering key levels of the seafood value chain.Footnote5 The interviews main topics concerned the respondents’ seafood purchase and selling characteristics (e.g., criteria, preferences, portfolio, substitution and seasonal patterns), their perceptions on the seafood origin (i.e., imported vs domestic fish, and farmed vs wild caught fish), and challenges for increasing seafood consumption. The interviews were recorded, transcribed, and anonymized.
Most of the respondents have seafood as their main product and have more than 10 years of experience in their area. The starting point of the interviews was about their purchase and selling patterns. In general, few suppliers are used along the value chain, but they must be trustworthy. In particular, restaurants reported using apps and delivery systems to acquire seafood more than going to the market.
The most common products bought by the respondents are salmon, tilapia, pangasius, shrimp, tuna, squid, dried and salted cod (bacalhau), shark, hake, weakfish, sardines, and flatfish. Most levels of the value chain offer a fixed portfolio of seafood products all year around based mostly on farmed or imported seafood, except high end restaurants with focus on sourcing from the local economy. This highlights the importance of stability of supply that aquaculture and imports can provide.
Domestic fisheries offer some diversity and seasonality in the menu, such as groupers, some shrimps, snappers, and few other species.Footnote6 It is an opportunity to try a new product if the benefits outweigh the cost. However, seasonality is an issue for those agents relying on domestic fisheries offering a fixed portfolio. Our finding that salmon and tilapia do not share common pricing with fishery species suggests that the portfolio price risk does not increase by including the aquaculture species.
With respect to their preferences for seafood, there is a wide range that varies over the season, especially in the higher end of the value chain. Tuna, amberjacks, mackerels, pangasius, weakfishes, pink cusk-eel, flatfish, salted and dried cod, trout, salmon (love or hate), blue fish, sardines, fried fish and fish fillets are among the species mentioned during the interviews. However, at the lower levels of the value chain, the cheaper fish is the most preferred, such as tilapia and pangasius.
Along all the value chain substitution for similar products is relatively common in the seafood market, in particular for whitefish. This is consistent with our finding of common pricing for domestic whitefish from fisheries. Salmon, tuna, sardines and other seafood are more difficult to substitute other than fresh for frozen or domestic for imported forms. The main reason for substitution is seasonality or general non availability leading to high prices (e.g., output crisis, exchange rate or regulation changes, etc). For salmon in particular, even though there is no direct substitution to other fish because of lack of similarity, in some cases there is substitution for other fish if the client’s portfolio allows some level of flexibility. Otherwise, especially restaurants, in case there is no flexibility in the menu, tend to pass on the price increase to the consumers. In general, price transmission from suppliers to consumers will depend on the market power the agents in each level of the value chain have (Bukeviciute et al., Citation2009; Fang & Asche, Citation2021). Given that food service, e.g., restaurants, is a highly competitive business, there is little room for passing increasing prices to consumers.
Origin, both from fisheries or farmed products or whether imported or domestic, is not an important direct criterion when buying seafood. This fact is corroborated also in the interviews with supermarket consumers in several Brazilian capital cities in Pedroza Filho et al. (Citation2020). In general, most final consumers do not ask about origin, except high end restaurants where this information is actively provided during the dish presentation. In the other levels of the value chain, even when customers ask about that, it is not an important criterion for buying seafood. Flores et al. (Citation2021) have also suggested strong relationships between fish knowledge and species selection preferences for Brazilian seafood in the retail market. Consumer’s preference toward tambaqui, a farmed native species, was attributed to the consumer’s knowledge on identifying it on the supermarket counter.
For all the value chain respondents, other criteria, such as price, quality (good taste, smell, texture, and standard), constant supply, and service are perceived as more important. One of the restaurants pointed out yield in filleting as an important buying criterion, due to reducing costs. The respondent provided the example of whitemouth croaker, which is bought whole, and its yield is around 20%. So, in some circumstances a whitemouth croaker fillet might end up costing more than salmon and tuna. However, origin associated with safety issues has been a subject of cooperation across different levels of the value chain (e.g., distributors and supermarkets and restaurants) in order to inform final consumers and associate the brand with quality. Focus on food safety is likely to have increased even more after the pandemic.
Still, there were some differences reported on the perception of imported vs domestic fish, and farmed vs wild caught fish. In general, imported fish were perceived as better than domestic fish, mostly because of handling issues and food safety in the domestic market. For instance, hake and pollack from Argentina are already processed on the boat. Also, domestic sharks were mentioned as dark, bad taste and appearance, but not the ones from Uruguay and Argentina. Whereas, domestic flatfish is perceived as much less firm than the imported ones. Other examples of good quality imported seafood include salmon, dried and salted cod, and scallops.
Salmon, which is an important imported species, is considered along the value chain a good fish and easy to sell.Footnote7 This is related to the appreciation (e.g., taste) salmon has among consumers (REF). However, 2 out of 5 restaurants in our sample did not work with salmon. Along the value chain, there were no preferences regarding origin, but Chilean salmon is the main product given the exception in import tax and proximity with easy logistics to Brazil (∼10 days by truck). One of the restaurants’ respondents suggested that consumers prefer redder salmon in color, which is associated with the Japanese culture in Brazil. It seems that “the salmon coming from China is redder, and wider than the salmon coming from Chile, but it melts in the pan, so that consumers do not like it.”
The growth of exports of Chilean fish to Brazil, from 2000 to 2011, was almost 500%, considering the three species that Chile exports, led by salmon. It is interesting to note that the exponential growth of Chilean salmon sales in the Brazilian market in 2008 and 2009 is related to the contamination of ISA (infectious salmon anemia) in Chile, which forced the country's industry to anticipate the harvesting of practically all the biomass of Atlantic salmon. This fish, although safe for consumption, was too small to be sold in fillet form to the United States and Europe, so it was redirected in large volumes in the form of whole fish to the Brazilian market, at a price below production cost (Asche et al., Citation2009, Citation2018). The strategy served to promote the consumption of fish among millions of new consumers. Since then, the boost in sales is due to promotional campaigns to increase the consumption of salmon, the acceptance of the products by consumers, the appeal to healthy eating, highlighting salmon as a source of omega 3 and because Brazil, due to distance and transport time, it is a natural market for Chilean industry. A new promotional campaign by the Chilean association of the Chilean salmon industry (Salmon de Chile) in the Brazilian market began in June 2012 and lasted until October 2013, with an emphasis on the states of São Paulo and Rio de Janeiro. Among the results of this public-private initiative, the following stand out: 49% growth in the volume exported to Brazil between 2011 and 2012, 212% increase in value added in the first quarter of 2013 compared to the first quarter of 2012 (Henríquez, Citation2013).
Perspectives on farmed fish seem to be more positive than on wild caught fish. This is, in fact, the opposite of the supermarket consumers interviewed by Pedroza Filho et al. (Citation2020) suggested. Farmed fish is perceived to have more constant offer and standards, and this is reflected in the price as well. However, the taste is somewhat perceived as better from fisheries products. This might be related to the differences from marine and freshwater fish, since a large share of farmed fish consumed in Brazil come from freshwater (e.g., tilapia and tambaqui). In particular, the respondents mentioned among tilapia’s potential consumption challenges, its off-flavor taste, along with its firmness, and the wide price and quality range. On the other hand, tilapia seems to be perceived as easy to sell, with a relatively good price and stable supply for most of the value chain stakeholders interviewed. Wilkinson et al. (Citation2006) found similar perceptions by interviewing supermarket managers for fresh fish in São Paulo. In fact, it was suggested that fresh farmed fish would provide higher quality standards to fresh fish, since farmed fish can be “brought live to the supermarket distribution platform, supplies can be programmed, guaranteeing permanent availability, and prices stabilized.” In addition, production conditions, inspection and auditing can be specified in the retailer's contract with the supplier.
Other domestic farmed species, such as tambaqui, pacu and tucunaré (i.e., native species), are perceived as very good, but not easily accessible in São Paulo. For other native farmed fish, quality varies a lot. The main issues reported were weak supply, seasonality, and bad logistics and governance.
Finally, the main challenges for the Brazilian seafood market pointed out by the interviews were (1) the Brazilian food habits, since in general Brazilians do not eat fish; (2) price, compared to other animal proteins like chicken and pork; and (3) logistics. In addition, suggestions to increase consumption included improving processing aspects, such as convenience, filleting yield, quality (different fish standards with respect to size and texture), and food safety issues, storage, and good packaging. Another point mentioned was with respect to import tax, and the tariffs charged in the different states (ICMS) on the products. These increase the seafood price, which also limits its consumption.
4. Concluding remarks
The São Paulo region in Brazil has a considerable population and is an untapped seafood consumption market. In particular, fish comprises more than half of the seafood food consumption (∼8 kg/per capita in 2017; FAO, Citation2021). This paper provides insights on potential opportunities and challenges related to increasing fish consumption by analyzing fish pricing in the São Paulo wholesale market and complementing it by interviews with participants in the value chain.
The econometric results reveal a clear separate pricing of domestically produced fishery species (whitefish and pelagic) from the internationally traded aquaculture species (tilapia and salmon). Fisheries prices are classified as trend stationary prices with most of the variation in their prices coming from month-to-month fluctuations. This is most likely due to larger variability in monthly fisheries supply. We also document significant positive correlation in the prices of different related wild fish species. Amberjack and yellowtail show highly correlated prices. These are both domestically produced large pelagic fish. Whitemouth croaker and codling, two low priced domestically produced whitefish, also show high price correlation.
On the other hand, tilapia and salmon are classified econometrically as non-stationary, with relatively stable month-to-month pricing and more of the price variation coming from slow moving trend changes. Their price dynamics are more akin to the local terrestrial meats than wild fish. This is consistent with a greater stability of supply afforded by aquaculture production on a month-by-month basis, and the larger markets for these species overall. Tilapia and salmon are also uniquely priced in the São Paulo wholesale market. Thus, we do not find evidence that the expansion of aquaculture and imports in the domestic markets directly affects the domestic fishery prices. Our interview results also show that market participants did not show concern about the specific sourcing of fish (aquaculture/fisher, or domestic/imported).
The interviewees highlight the importance of stability of supply, standardized products, and lower prices as important across the value chain. The price analysis suggests farmed fish offer more price stability and predictable supply. However, farmed and imported seafood may face increasing prices and volatility because of higher feed ingredients prices (e.g., fishmeal prices), higher logistics cost due for instance to the container crisis during the pandemic in 2020/2021. In addition, imports depend on the exchange rate, which can be volatile.
Convenience is another key factor mentioned in the interviews, and together with the pandemic, this means new forms of purchase, such as e-commerce. Thus, for perishables, such as seafood, there is a need to adapt storage and packing for this increasing form of purchase.
Additional information
Funding
Notes
1 Tilapia, whitemouth croaker, pangasius, weakfishes, cod, hake, and flatfish are examples of fish considered in the broader group of «whitefish».
2 The main consumed marine wild caught seafood include herrings, cod and cod-like fish, weakfish, croakers, catfish, sharks and rays, salmons, tunas, bonitos and billfishes, snappers, mackerels, jacks and pompanos, mullets, and dolphinfish (FAO, Citation2021).
3 Considering a 32% average fillet yield, i.e., 3.1 kg of whole tilapia to produce 1 kg of tilapia fillet, the farmgate markup is around 5% of the fillet value, while the processing plant markup is around 25%, and the retail markup, 30 percent. So, typically, farmed tilapia sold to processing plants receives a lower price than those sold to local markets. While for the farmgate the markup value represents farmer’s profit, for the other levels (e.g., processing plants) it includes not only profit, but also other costs (e.g., storage, transportation, packing, etc.). In general, reduced consumer’s purchase power, and increased supply of competitive imported products have challenged producers’ profits.
4 According to Rabobank (Shaffer, Citation2021), beef producers in Brazil, the leading beef exporter to China, have delayed sales of cattle until the animals reach heavier weights, which has delayed slaughter. Approximately 50–60% of Brazilian cattle feeds exclusively on pasture, but Brazil has experienced a delay in seasonal rainfall. High cattle prices have also encouraged breeders to hold females, further limiting the supply of cattle.
5 We used open questions for the interview, which were carried out in March, April, June, and October.
6 Other species mentioned by the interviewees: whitemouth croaker, flatfish, weakfish, sardines, shark, tuna, horse mackerel, squid, octopus, mussels, and urchin.
7 We used open questions for the interview. So, the words “good” and “easy to sell” are attributes that the interviewees used to describe salmon.
References
- Ankamah-Yeboah, I., & Bronnmann, J. (2018). Market integration in the crustaceans market: Evidence from Germany. Marine Policy, 87(October 2017), 72–77. https://doi.org/10.1016/j.marpol.2017.10.012
- Asche, F., Bronnmann, J., & Cojocaru, A. L. (2021). The value of responsibly farmed fish : A hedonic price study of ASC-certified whitefish. Ecological Economics, 188(June), 107135. https://doi.org/10.1016/j.ecolecon.2021.107135
- Asche, F., Cojocaru, A. L., & Sikveland, M. (2018). Market shocks in salmon aquaculture: The impact of the Chilean disease crisis. Journal of Agricultural and Applied Economics, 50(2), 255–269. https://doi.org/10.1017/aae.2017.33
- Asche, F., Hansen, H., Tveteras, R., & Tveterås, S. (2009). The salmon disease crisis in Chile. Marine Resource Economics, 24(4), 405–411. https://doi.org/10.5950/0738-1360-24.4.405
- Associação Brasileira da Indústria de Alimentos. https://www.abia.org.br/downloads/PesquisaConjuntural-ABIA-fevereiro2022b.pdf
- Barone, R. S. C., Lorenz, E. K., Sonoda, D. Y., & Cyrino, J. E. P. (2017). Fish and fishery products trade in Brazil, 2005 to 2015: A review of available data and trends. Scientia Agricola, 74(5), 417–424. https://doi.org/10.1590/1678-992x-2016-0300
- Barreto, R. R., Bornatowski, H., Motta, F. S., Santander-Neto, J., Vianna, G. M. S., & Lessa, R. (2017). Rethinking use and trade of pelagic sharks from Brazil. Marine Policy, 85, 114–122. https://doi.org/10.1016/j.marpol.2017.08.016
- Barroso, R. M., Muñoz, A. E. P., & Cai, J. (2019). Social and economic performance of Tilapia farming in Brazil. FAO. https://doi.org/10.4060/ca5304en.
- Barroso, R. M., Picinato, R. B. M., & Munoz, A. E. P. (2017). O mercado da tilápia - 2° trimestre de 2017 e Análise da estrutura do preço da tilápia no varejo. Informativo Mercado Da Tilápia, 11(Embrapa), 10.
- Barroso, R. M., & Wiefels, A. C. (2010). O mercado de pescado na região metropolitana do Rio de Janeiro. INFOPESCA.
- Begossi, A., Salivonchyk, S., Lopes, P. F. M., & Silvano, R. A. M. (2016). Fishers' knowledge on the coast of Brazil. Journal of Ethnobiology and Ethnomedicine, 12(1), 20. https://doi.org/10.1186/s13002-016-0091-1
- Bukeviciute, L., Dierx, A., Ilzkovitz, F., & Roty, G. (2009). Price transmission along the food supply chain in the European Union. https://ageconsearch.umn.edu/record/57987/?ln=en
- CEAGESP (Companhia de Entrepostos e Armazéns Gerais de São Paulo). (2021). CEAGESP (Companhia de Entrepostos e Armazéns Gerais de São Paulo). Pescado. http://www.ceagesp.gov.br/entrepostos/pescado/
- CEPEA. (2021). Agricultural prices. https://www.cepea.esalq.usp.br/br
- Cergole, M. C., Ávila-da-Silva, A. O., & Rossi-Wongtschowski, C. L. D. B. (Eds.) (2005). Análise das principais pescarias comerciais da região Sudeste-Sul do Brasil: dinâmica populacional das espécies em explotação. São Paulo: Instituto Oceanográfico-USP (Série documentos Revizee).
- Dahl, R. E., & Oglend, A. (2014). Fish price volatility. Marine Resource Economics, 29(4), 305–322. https://doi.org/10.1086/678925
- FAO. (2021). Aquaculture production 1950-2019. Universal Software for Fishery Statistical Time Series.
- Fang, Y., & Asche, F. (2021). Can U.S. import regulations reduce IUU fishing and improve production practices in aquaculture? Ecological Economics, 187, 107084. https://doi.org/10.1016/j.ecolecon.2021.107084
- Felizola-Freire, K. M., Sumaila, U. R., Pauly, D., & Adelino, G. (2018). The offshore recreational fisheries of northeastern Brazil. Latin American Journal of Aquatic Research, 46(4), 765–778. https://doi.org/10.3856/vol46-issue4-fulltext-14
- Flores, R. M. V., Widmar, N. O., Preckel, P. V., Xavier, M., & Filho, P. (2021). Establishing linkages between consumer fish knowledge and demand for fillet attributes in Brazilian supermarkets. Journal of International Food & Agribusiness Marketing, 0(0), 1–21. https://doi.org/10.1080/08974438.2021.1900016
- Fogliarini, C. O., Ferreira, C. E. L., Bornholdt, J., Barbosa, M. C., Giglio, V. J., & Bender, M. G. (2021). Telling the same story: Fishers and landing data reveal changes in fisheries on the Southeastern Brazilian Coast. PLoS One, 16(6), e0252391–21. https://doi.org/10.1371/journal.pone.0252391
- Henríquez, A. (2013). Salmão chileno: um salto até o mercado brasileiro. Revista Panorama Da Aquicultura, 133, 53–55.
- IBGE – Instituto Brasileiro de Geografia e Estatística. Pesquisa de Orçamentos. (2010). Familiares 2008–2009 – POF. Rio de Janeiro.
- Instituto de Pesca de São Paulo. (2021). Banco de Dados. http://www.propesq.pesca.sp.gov.br/
- Instituto Food Service Brasil. (2022). A transformação digital em bares e restaurantes. https://foodbizbrasil.com/negocios/a-transformacao-digital-em-bares-e-restaurantes/
- Johansen, S. (1988). Statistical analysis of cointegration vectors. Journal of Economic Dynamics and Control, 12(2-3), 231–254. https://doi.org/10.1016/0165-1889(88)90041-3
- Kato, H. C. A., Sousa, D. N., Maciel, E. S., Lima, L. K. F., Santos, V. R. V., & Chicrala, P. M. S. (2021). Efeitos do isolamento social durante a pandemia de Covid-19 na comercialização e no consumo de pescado no Brasil. Revista Científica Multidisciplinar Núcleo do Conhecimento (Série Documentos). https://doi.org/10.32749/nucleodoconhecimento.com.br/psicologia/isolamento-social
- Kubitza, F., Campos, J. L., & Brum, J. A. (1998). Surubim: Produção intensiva no Projeto Pacu Ltda. e Agropeixe Ltda. Panorama Da Aquicultura, 49, 25–32.
- Landazuri-Tveteraas, U., Oglend, A., Steen, M., & Straume, H. M. (2021). Salmon trout, the forgotten cousin? Aquaculture Economics & Management, 25(2), 159–176. https://doi.org/10.1080/13657305.2020.1857469
- Lim, K. H., Hu, W., & Nayga, R. M. (2018). Is Marine Stewardship Council’s ecolabel a rising tide for all? Consumers’ willingness to pay for origin-differentiated ecolabeled canned tuna. Marine Policy, 96, 18–26. https://doi.org/10.1016/j.marpol.2018.07.015
- Madureira, L. A. S. P., & Monteiro-Neto, C. (Eds.) (2020). Sustentabilidade da Pesca do Bonito-Listrado no Brasil. Rio de Janeiro: Walprint Gráfica e Editora.
- MDIC- Ministry of Development Industry and Foreign Trade of Brazil. (2021). Aliceweb: sistema de análise das informações de comércio exterior [WWW Document]. http://aliceweb2.mdic.gov.br/
- Ministério da Economia. (2021). Estatísticas de Comércio Exterior em Dados Abertos. http://comexstat.mdic.gov.br/pt/home
- Muñoz, A. E. P., Rezende, F. P., Mataveli, M., & Barroso, R. M. (2017). Comparative economic performance of aquaculture farms in Brazil. World Aquaculture, 48(4), 44–47.
- Muñoz, A. E. P., Santos, V. R. V. d., Sousa, D. N. d., & Chicrala, P. C. M. S. (2015). Viabilidade Econômica do Matrinxã em Conserva como Matéria-Prima Alternativa à Sardinha. https://www.embrapa.br/busca-de-publicacoes/-/publicacao/1023020/viabilidade-economica-do-matrinxa-em-conserva-como-materia-prima-alternativa-a-sardinha
- Neiva, C. R. P., Tomita, R. Y., Cerqueira, M. A. S., Miura, M., Furlan, E. F., Machado, T. M., & Neto, M. J. L. (2010). O mercado do pescado da Região Metropolitana de São Paulo (O Mercado Do Pescado Nas Grandes Cidades Latino-Americanas). Santos: CFC/FAO/INFOPESCA.
- OECD. (2021). Meat consumption. https://data.oecd.org/agroutput/meat-consumption.htm
- Pedroza Filho, M. X., Flores, R. M. V., Rocha, H. S., Silva, H. J. T. d., Sonoda, D. Y., Carvalho, V. B. d., Oliveira, L. d., & Rodrigues, F. L. M. (2020). O mercado de peixes da piscicultura no: estudo do segmento de supermercados. https://www.embrapa.br/busca-de-publicacoes/-/publicacao/1124524/o-mercado-de-peixes-da-piscicultura-no-brasil-estudo-do-segmento-de-supermercados
- Pincinato, R. B. M., & Asche, F. (2016a). Market integration in Brazilian shrimp markets. Aquaculture Economics & Management, 20(4), 357–367. https://doi.org/10.1080/13657305.2016.1212124
- Pincinato, R. B. M., & Asche, F. (2016b). The development of Brazilian aquaculture: Introduced and native species. Aquaculture Economics & Management, 20(3), 312–323. https://doi.org/10.1080/13657305.2016.1177862
- Pincinato, R. B. M., & Asche, F. (2018). Domestic landings and imports of seafood in emerging economies: The Brazilian sardines market. Ocean & Coastal Management, 165, 9–14. https://doi.org/10.1016/j.ocecoaman.2018.08.008
- Pincinato, R. B. M., & Gasalla, M. A. (2019). Exploring simple ecological indicators on landings and market trends in the South Brazil Shelf Large Marine Ecosystem. Fisheries Management and Ecology, 26(3), 200–210. https://doi.org/10.1111/fme.12340
- Pincinato, R. B. M., Gasalla, M. A., Garlock, T., & Anderson, J. L. (2022). Market incentives for shark fisheries. Marine Policy, 139, 105031. https://doi.org/10.1016/j.marpol.2022.105031
- Rossi-Wongtschowski, C. L. D. B., Ávila-da-Silva, A. O., & Cergole, M. C. (Eds.) (2006). Análise das principais pescarias comerciais do sudeste-sul do Brasil: dinâmica populacional das espécies em explotação II. São Paulo: Instituto Oceanográfico-USP (Série documentos Revizee).
- Salazar, L., & Dresdner, J. (2020). Market integration and price leadership: The U.S. Atlantic salmon market. Aquaculture Economics and Management, 0(0), 1–15. https://doi.org/10.1080/13657305.2020.1843562
- Seafood Brasil. (2021). Você sabe quanto o brasileiro realmente come de pescado? Seafood Brasil, 9.
- Shaffer, E. (2021). Rabobank: Factors that drive beef, cattle prices to record highs (pp. 6–8). https://www.meatpoultry.com/articles/25040-rabobank-factors-that-drive-beef-cattle-prices-to-record-highs
- Sonoda, D. Y., Campos, S. K., Cyrino, J. E. P., & Shirota, R. (2012). Demand for fisheries products in Brazil. Scientia Agricola, 69(5), 313–319. https://doi.org/10.1590/S0103-90162012000500005
- Sonoda, D. Y., Conte, L., Scorvo-Filho, J. D., Shirota, R., & Cyrino, J. E. P. (2002). Análise comparativa dos dados de comercialização de pescados da CEAGESP nas décadas de 80 e 90. Informações Econômicas, 32(11), 50–55.
- Wilkinson, J., Rocha, R., & Fuertes, P. (2006). Supermarkets and the artisanal fisheries sector in Latin America. No. 85; FAO GLOBEFISH Research Programme, Vol. 85.
- Zhang, X., Fang, Y., & Gao, Z. (2020). Accounting for attribute non-attendance (ANA) in Chinese consumers’ away-from-home sustainable Salmon consumption. Marine Resource Economics, 35(3), 263–284. https://doi.org/10.1086/709458
Appendix 1.
Summary of the main species groups analyzed
Common snook (robalo in Portuguese)
Common snook is high value estuarine and coastal fish caught by domestic fisheries in small scale vessels, and also by recreational fisheries (Begossi et al., Citation2016). It is mainly consumed nationally, prepared especially roasted. Virtually no trade has occurred for these species for the last decades.
Flatfish (linguado in Portuguese)
Flatfish is a groundfish, found in shallow coastal waters all along the coast. Domestic fisheries is its main source, but small amounts are traded internationally (i.e., imported and exported). It is a high value fish.
Mullets (tainha in Portuguese)
Mullets are coastal species which migrate from April to August northwards along the Brazilian South and Southeast coast (Rossi-Wongtschowski et al., Citation2006). This resource supports several small communities through fishing, and its fishing season is an important cultural event in these regions. It is mainly consumed nationally including the eggs, but a small part of the production of mullet’s eggs is exported to Europe and Asian countries (MDIC, Citation2021).
Brazilian sardine (sardinha-verdadeira in Portuguese)
Sardines are among the main seafood consumed domestically, canned or fresh (Pincinato & Asche, Citation2018). It is a cheap fish, sold mainly in canned form and targeted to low-income consumers (Muñoz et al., Citation2015). Half of its supply comes from a seasonal domestic fishery, which targets the main coastal small-pelagic resource in Brazil in quantity. Imports constitute the other half of the supply to the domestic sardines market. Domestic fisheries and imports support the canning industry, which has a small percentage of exports (MDIC, Citation2021).
Spanish mackerel (serra in Portuguese)
Mackerels from domestic fisheries are related to the species from the genus Scomberomorus, which include Spanish mackerel (Scomberomorus brasiliensis) and King mackerel (Scomberomorus cavalla). The majority of their production is from the North and Northeast regions, and sold domestically (Brasil, 2011).
Shark (cação in Portuguese)
Shark comprises several wild caught species from domestic fisheries and imports. During the last decade, imports have increased its share in supplying the domestic market, which nowadays comprises around 50% (Pincinato et al. Citation2022). A small percentage of shark produced in Brazil is exported, mainly dried fins (MDIC, Citation2021). Shark meat is considered low-value seafood when compared to other main consumed fish, and is usually traded without proper labeling (Barreto et al., Citation2017). Shark steak can reach higher prices in the retail market (Neiva et al. Citation2010; Barroso & Wiefels, Citation2010). Very popular meat for its boneless and whiteness characteristics.
Skipjack (bonito-listrado in Portuguese)
Skipjack tuna is a highly migratory pelagic fish caught by a highly selective domestic fishery in both South-Southeast and Northeast regions (Cergole et al. Citation2005). A major share of production goes to the canning industry, with a small share to the fresh market, and with another share exported as frozen, mostly to countries with a canning industry, such as Ecuador, or as canned tuna to countries within South America (Madureira & Monteiro-Neto Citation2020). A small share of frozen tuna for the domestic canning industry, and canned tuna are imported (MDIC, Citation2021).
Weakfish (pescada in Portuguese)
Weakfish consists of several domestic wild caught whitefish species from the Sciaenidae family, and are popular in Brazil. This aggregated group may include higher value weakfish, such as acoupa weakfish, green weakfish (Cynoscion acoupa, C. virescense), king weakfish (Macrodon ancylodon), but also other lower value weakfish such as Jamaica weakfish (Cynoscion jamaicensis), and bigtooth corvina (Isopisthus parvipinnis). Exports of higher value weakfish (Cynoscion) occur in small quantities frozen.
Whitemouth croaker (corvina in Portuguese)
Whitemouth croaker is a whitefish, and a major fishery resource in Brazil. Relatively low value fish, mostly sold in the domestic market as fresh fish (Neiva et al., Citation2010; Barroso & Wiefels, Citation2010). In particular, whitemouth croaker comprises a large share, in volume, of sold fish in the wholesale markets in São Paulo (CEAGESP (Companhia de Entrepostos e Armazéns Gerais de São Paulo, Citation2021) and Rio de Janeiro (Barroso & Wiefels, Citation2010). A small, but increasing, share is exported to countries such as China and USA, and also some frozen croakers are imported whole.
Brazilian codling (abrótea in Portuguese)
Codling is a whitefish, member of the gadiform order, and a fishery resource specially for the South and Southeast vessels fishing with trawl and gillnets. Can be found in the market as fresh cod or salted as a cheaper substitute to salted and dried cod (bacalhau), which is an important product imported mainly from Portugal, Norway, and China.
Greater amberjack (olho de boi in Portuguese)
Greater amberjack is a pelagic fish with a wide distribution range. It is found throughout the Brazilian coast, from the south to the north of the country, and it usually lives at deeper waters. It is a commercial fishery resource along all the Brazilian coast, and also of interest for sport fishing (Felizola-Freire et al., Citation2018). It is considered a high value fish.
Perch (namorado in Portuguese)
Perch is a high value whitefish, caught by fisheries in the South and Southeast region.
Yellowtail (olhete in Portuguese)
Yellowtail is from the same genus as greater amberjack, but has a lower price. It is not only caught by commercial fisheries along the Brazilian coast, but also of interest for sport fishing (Felizola-Freire et al., Citation2018).
Salmon
Salmon is an imported fish, mostly from Chile, where it is farmed. There is no domestic production. An important share is consumed in Asian restaurants (e.g., as sashimi in Japanese restaurants).
Spotted sorubim (pintado in Portuguese)
Spotted sorubim is a freshwater catfish. Traditionally, spotted sorubim has been an important freshwater fisheries resource, but in the last decade, farming has increased its total production. The effort to increase production in captivity in recent years is justified, among other reasons, to offset the fall in stocks from extractive fishing, mostly in the Pantanal region of Mato Grosso and Mato Grosso do Sul, as well as in some rivers in the Brazilian Amazon. This species is of particular interest for aquaculture due to its high growth and carcass yield (>50%), not many bones, high commercial value and consumers (Kubitza et al., Citation1998). Its light-colored meat, firm texture, mild flavor, low fat content and absence of intramuscular thorns makes it a relatively popular product in the domestic and foreign market (Kubitza et al., Citation1998). It is mainly sold in the Brazilian market, but a small share is exported to several countries (MDIC Citation2021).
Tilapia
Tilapia is a freshwater fish, which has been introduced to the Brazilian ecosystems in the 50s and nowadays is the main farmed species (Pincinato & Asche, Citation2016b). Most of its supply to the domestic market comes from aquaculture, and, recently, a small but increasing share of this production is exported to the USA (MDCI 2021). Tilapia is among the 10th seafood products most consumed in Brazil according to the National household survey in 2008/2009 (IBGE, Citation2010).
Largehead hairtail (espada in Portuguese)
Low value fish sold in the domestic market sourced from bycatch of domestic fisheries that used to be discarded before main target species became overexploited (Fogliarini et al., Citation2021).