
 ?Mathematical formulae have been encoded as MathML and are displayed in this HTML version using MathJax in order to improve their display. Uncheck the box to turn MathJax off. This feature requires Javascript. Click on a formula to zoom.
Abstract
With the expansion of offshore renewable energy, countries across the world are researching the different ways to maximize the space between wind turbines by coupling multiple maritime activities within the same ocean space. This technique is referred to as co-location and can result in economic and environmental benefits. Using data from a choice experiment and random utility modeling, this research quantifies public preferences for various co-location options within the lease area of a developing wind farm off Virginia’s coastline. Our estimates show that the average Virginia public household is willing-to-pay upwards of $20 per 1,000 acres for co-location activities. By comparing our results to estimated implementation and management costs of each activity, there is a strong indication that the benefits of co-location exceed the costs. The experimental design of this study can be applied to other offshore wind installments around the U.S. and abroad.
Introduction
In the wake of the United States’ expansion of the offshore wind (OSW) industry are opportunities for marine businesses to improve and innovate. Specifically, offshore wind farms present opportunities for co-location, which is defined as the co-existence of multiple marine activities within the same ocean space. Co-location (also referred to as multi-use) is known as a suitable solution to some of the spatial limitations associated with offshore expansion (Holm et al., Citation2017). Countries across the world are recognizing the capabilities of marine coexistence and are researching ways in which featureless space between OSW turbines can be used to provide economic and environmental benefits and perhaps also increase the scale of ocean food production (Buck & Langan, Citation2017; Craig, Citation2018; Rockmann et al., Citation2017). For example, in March of 2023 the United States Department of Energy (DOE) released a Request for Information (DE-FOA-0002943) for Synergies Between Offshore Wind, Marine Energy, and Aquaculture (Department Of Energy, Citation2023). Also in 2023, Amazon announced plans to provide $1.6 million to fund a commercial-scale scheme to grow and harvest seaweed within the confines of a floating offshore wind farm (Lee, Citation2023).
The ocean is a vital resource to a broad range of stakeholders, thus, an important component to success in co-location is determining if societal benefits outweigh societal costs (Buck & Langan, Citation2017; Krause, Citation2015). The rapid changes within energy markets make it crucial for utility companies to understand the preferences and values of the public before implementing new techniques and management strategies (Haggett, Citation2011; Krause & Mikkelsen, Citation2017). Utility-scale development projects are by law required to undergo a public comment period and, in some cases, public hearings, making it imperative to the permitting process and in the developer’s best interest to attain public support (Mayeda & Boyd, Citation2020; Russell et al., Citation2021).
At present, literature regarding co-location techniques focuses on the economic and technological feasibility of certain types of co-location. While there is research involving the perception of offshore wind as an energy source (Bates, Citation2016; Knapp & Ladenburg, Citation2015) and on the economic feasibility of certain co-location activities with OSW around the world (Kite-Powell, Citation2017; Krause & Mikkelsen, Citation2017; Rockmann et al., Citation2017; van den Burg et al., Citation2016), academic literature is specifically deficient in addressing the public WTP for different types of co-location activities.
To understand Virginia (VA) public preference and give the public a platform to share their preferences, this study utilizes data from a choice experiment (CE) to estimate public willingness-to-pay (WTP) to combine various marine activities with an OSW farm currently under construction off the VA coast.
Application
The national transition to renewable energy led Governor Ralph Northam, of VA to sign an executive order committing the Commonwealth to a goal of 100% reliance on renewable energy by the year 2050 (Commonwealth of Virginia & Executive Office of the Governor [Ralph Northam], 2019). In May of 2023, Governor Glenn Youngkin publicly supported Dominion Energy’s Integrated Resource Plan (IRP) of which the main goal is to expand generation technologies, including wind energy (Office of Governor Glenn Youngkin, Citation2023). In efforts to incorporate more renewable energy into VA’s market, Dominion Energy® (a major electricity utility provider to the mid-Atlantic region) is developing the Coastal Virginia Offshore Wind (CVOW) project (Coastal Virginia Offshore Wind, Citation2020). The CVOW project is located within a 2,135-acre offshore lease area regulated by the Bureau of Ocean Energy Management (BOEM), which lies 27 miles off the coast of Virginia Beach, VA () (Coastal Virginia Offshore Wind, Citation2020).This commercial wind deployment is intended to connect to electrical grids within 13 eastern states and Washington, D.C., to deliver up to 8.8 million megawatts (MW) of offshore wind energy to consumers annually (Coastal Virginia Offshore Wind, Citation2020). The CVOW project is expected to include between 180 and 195, 12-MW turbines which “combined will provide enough energy to serve more than 650,000 customers” (Coastal Virginia Offshore Wind, Citation2020). To transmit the generated energy, a submerged power cable connecting the turbines will be buried under the seabed and will ultimately come ashore through a 1,000-meter conduit installed under the beach (Coastal Virginia Offshore Wind, Citation2020). As of summer 2020, Dominion Energy® completed and activated a CVOW pilot study consisting of two 12-MW turbines.
Figure 1. CVOW Lease area.
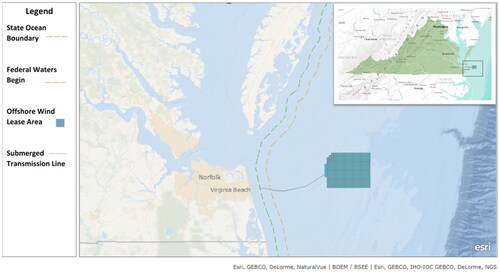
The CVOW project is the first OSW farm in U.S. Federal waters and the first wind farm directly off the coast of VA and hosts regular activity from recreational and commercial fishing, boating, and charter operations, including sparse commercial fishing activity and moderate levels of recreational fishing and party-boat charters (Mid-Atlantic Regional Council on the Ocean, Citation2020). With the intent to minimize the impact of the OSW farm on current offshore pursuits, it is unlikely Dominion Energy® or BOEM will restrict public access within the CVOW lease area (Webster & Porter, Citation2020). Permitting the public to access the open ocean between the turbines for recreation and commercial fishing is therefore considered the status quo (SQ) operations throughout our CE, discussed below.
Offshore structures are also known to attract marine species which create reef communities attached to the monopoles of the wind turbines (Langhamer, Citation2012). This can increase species abundance, including game fish (Langhamer, Citation2012; van den Burg et al., Citation2016). These reefs then become ecologically biodiverse communities which support maturation of recreationally popular fish species.
An additional advantage of turning OSW farms into multi-use sites is the option to share operation and maintenance costs between activities. For example, a case study, in the North Sea calculated that synergy between seaweed aquaculture and OSW can reduce shareable operation and maintenance (O&M) costs of labor and transport by up to 10% (van den Burg et al., Citation2016). As an additional example for possible synergies, aquaculturists, researchers, recreationists, and energy providers would economically benefit from collaborating with ocean monitoring networks since these spatial planning systems have significant potential to serve as oceanic environmental quality monitoring stations (Buck & Langan, Citation2017). This collaboration would involve sharing oceanic data with one another to increase efficiency across enterprises and assist organizations which monitor ocean health.
Based on the specific characteristics and available technologies associated with the CVOW project, this study focuses on three additional co-location activities as viable options to couple with the CVOW project: (1) a seaweed aquaculture farm,Footnote1 (2) a non-harvested seaweed forest, and (3) a designated research area.
Justification of chosen co-location activities
Seaweed aquaculture
One form of co-location that has the potential to be compatible with the CVOW farm is macroalgae or seaweed aquaculture. Researchers are discovering additional creative uses for seaweed that can expand the seaweed market globally. Emerging technologies have had success transforming seaweed into biofuel, decomposable “plastics,” components for the nutraceutical industry, and edible packaging material (Siah et al., Citation2015; World Bank Group, Citation2016).Footnote2
In addition to its marketability as commercial product, macroalgae also provide important environmental benefits during growth, such as sequestration of carbon dioxide and nitrogen, stimulation of healthy habitats for marine species, and storm surge protection (Buck & Langan, Citation2017). Some research has found that areas with seaweed farms show higher species richness in comparison to nearby regions without seaweed farms (Grebe et al., Citation2019). Seaweed is also known as a resource that fights effects of climate change and ocean acidification through reduction of ocean eutrophication as nutrients are taken up during growth and are transformed by the harvesting process (He et al., Citation2008). According to the World Bank, one acre of seaweed can absorb about 8.27 tons of carbon dioxide (CO2) and 161.87 pounds of nitrogen (N) annually (World Bank Group, Citation2016).
Offshore aquaculture is an emerging industry in the US and gaining in popularity across the world. Due to its infancy in the US, it can be a contentious topic for competing ocean spatial use disagreements and for its potential for environmental impact (Asche et al., Citation2022). Offshore finfish aquaculture is one of the more controversial forms of aquaculture with greater pollution potential from fish feed, antibiotics, and the risk of escapes (Asche et al., Citation2022).
Conversely, seaweed aquaculture is considered one of the most sustainable types of farming as a zero-input crop, not requiring feed, freshwater, land, or fertilizer for farming (Gertz, Citation2017). This type of aquaculture requires simplistic technology, such as anchored rope and buoy systems which have experienced success in offshore environments (Gertz, Citation2017; Roesijadi et al., Citation2008). While there is limited research on the social acceptance of seaweed aquaculture in comparison to other forms of offshore aquaculture, less resource intensive practices and more primitive technologies present less risk to the surrounding environment (Jones et al., Citation2022).
The anchored rope seaweed aquaculture system is the method assumed in this study. This system utilizes ropes tethered to buoys and anchored in some fashion to remain in place (Roesijadi et al., Citation2008). The risk to the marine environment from this form of offshore aquaculture is through the introduction of foreign materials such as ropes and buoys to the marine environment via equipment failure. In this case, this could lead to ropes becoming untethered in the ocean, which presents risk of entanglement to marine species (Grebe et al., Citation2019). However, research from 2019 reported that there have been no records of marine mammal entanglement in offshore seaweed aquaculture farms (Grebe et al., Citation2019). To help mitigate such risks to marine species, permitted offshore seaweed aquaculture farms are often required to develop a marine mammal monitoring plan to ensure all equipment is properly functioning to limit marine debris as well as report interactions with marine mammals.
Due to the complexities associated with offshore developments, offshore seaweed aquaculture can also be accompanied by potential permitting hurdles that would need to be overcome to establish an aquaculture farm within an OSW lease area. In a study comparing the stringency of environmental regulations across the world, it was found that the U.S. and Canada had the highest level of regulatory stringency, resulting in lower growth rates within the aquaculture industry (Abate et al., Citation2016).
While acknowledging the challenges associated with offshore aquaculture, opening up opportunities to move aquaculture operations offshore can also result in societal benefits. As the US coastal communities become more crowded with riparian and coastal aquaculture farms, offering aquaculturists the opportunity to expand their operations offshore can reduce nearshore conflict (Finley, Citation2017; Krause & Mikkelsen, Citation2017). By providing aquaculturists with additional areas to cultivate food, there are added opportunities to meet the growing demand for food nationally (Michler-Cieluch & Kodeih, Citation2008). Not only does offshore aquaculture reduce nearshore disputes over water rights, but it can benefit the aquaculturists financially. Studies show that if located offshore, aquaculture operations can be larger resulting in more cost-efficient scales of production (Krause & Mikkelsen, Citation2017).
Overall, offshore aquaculture is an industry gaining interest and popularity and siting and permitting an aquaculture installation is a complex effort. Each offshore aquaculture installation will need to be evaluated on a case-by-case bases to determine compatibility.
Non-harvested seaweed forest
The option to plant a seaweed forest in the unused space within the CVOW lease area is another viable co-location technique. Separate from seaweed aquaculture, environmental and ecosystem benefits are the driving reason behind planting a non-harvested seaweed forest. There are non-market service values associated with this technique that indirectly affect stakeholder populations, such as absorption of CO2 and ecosystem services (Kite-Powell, Citation2017). As previously discussed, seaweed can sequester CO2 and N, which is considered an ecosystem service (World Bank Group Citation2016). The environmental benefit of sequestering a ton of CO2 and N from the atmosphere would be the value provided to the public (Kite-Powell, Citation2017).
Seaweed forests are also known to produce other ecosystem contributions besides the storage of CO2 and N. According to the MARCO Mid-Atlantic Ocean Data Portal, migratory fish species, turtle species, conch, and migratory bird species are known to travel within the CVOW lease area (Mid-Atlantic Regional Council on the Ocean, Citation2020). The seaweed forest could contribute additional food and habitat resources to some pelagic species (Bailey et al., Citation2014; Leung & Yang, Citation2012).
Designated research area
The final co-location activity included in this CE is a designated research area. Such an area would prohibit public access and fishing but allow funded research projects to occur within a specified portion of the available ocean space within the CVOW lease area (Wenzel & D’lorio, Citation2011). The intent of setting aside ocean space within the lease area is to offer scientists the opportunity to collect valuable scientific data on the impact of OSW farms on marine life. By restricting public access to a portion of the lease area, the industry can research the effects of OSW turbines on the surrounding marine environment in absence of additional human impact. According to the National Marine Protected Areas Center, “research only” areas are often referred to and managed as marine reserves (Wenzel & D’lorio, Citation2011).
Marine reserves are also known to foster aquatic biodiversity, which can support surrounding fisheries (Ashley et al., Citation2018; Bartholomew et al., Citation2008; Pauly et al., Citation2002; White et al., Citation2008). By disallowing extraction and degradation of marine species within a marine reserve, juvenile species are permitted to mature to adulthood causing a 'spillover’ effect outside of the marine reserve into fishing areas (Halpern & Warner, Citation2003; Howarth et al., Citation2015).Footnote3
Research methodology
Our approach to modeling the WTP for co-location activities with the CVOW project incorporates the use of focus groups, a web-based survey instrument including a CE, and random utility modeling. Lessons learned from pre-survey focus groups were integrated into the CE., and random utility and conditional logit models were utilized to estimate public WTP. These benefits were then compared to estimate costs of implementation and maintenance of each co-location activity to determine which combinations of activities are most viable.Footnote4
Stated preference choice experiment theory
Given the hypothetical nature of the envisioned co-location activities and the objective of eliciting marginal values for attributes of a differentiated good (the co-location mix), an attractive way to learn about stakeholders’ preferences is through a stated preference choice experiment. A strength of choice experiments compared to other stated preference methods is its ability to assess consumer preferences along multiple dimensions/attributes, and allow for the estimation of attribute-specific WTP (Atkinson et al., Citation2018).Footnote5 Some services offered by co-location activities such as carbon and nitrogen storage, increased opportunities for local seafood, and research findings are nonmarket products, so it can be difficult to quantify a consumer’s preference for each service via market signals. By assigning a price to each choice, the survey responses can be used in nonmarket valuation calculations to determine WTP values for each form of co-location.
Focus groups
To assist with developing the web-based survey, two focus groups were conducted virtually, via Zoom video conferencing in December 2020. The purpose of the focus groups was to gain insight on and assess the perception of co-location activities. Both focus group consisted of adult (18 years or older) VA residents with varying knowledge and experience levels related to maritime activities and marine research industries. The first focus group included individuals recruited through VA Sea Grant’s list of industry contacts, Virginia Tech’s Center of Coastal studies, and the professional networks of the research team. These individuals have career experience directly related to the topics of this research.
The second focus group consisted of members of the VA public whose occupation is not directly related to OSW and marine topics. The participants in the second focus group were recruited via personal and professional connections of the research team who reside in varying regions throughout the Commonwealth of VA. Each focus groupFootnote6 session lasted 90 min during which, participants were asked open-ended questions about their current level of knowledge of the CVOW farm, their relationship to the ocean and ocean-related activities (i.e., experience boating, fishing, and seafood consumption), and their perspectives on various co-location options.Footnote7
Once the survey instrument was developed, it was tested on a pilot sample of 50 respondents, which eventually contributed to further sharpening the survey instrument to achieve increased survey efficiency.
Survey design
Qualtrics professional survey services were hired to collect data from a representative sample of adult VA residents with a demographic profile that matches U.S. Census information. During the survey, respondents were provided with the option to pay an annual tax for the implementation of various combinations of co-location techniques or stick with the SQ of “unlimited public access,” to otherwise featureless, between-turbine space. The purpose of the annual tax was described to participants as necessary for the implementation and management costs of each activity. These taxes were based on researched and estimated costs of implementation and management of each co-location activity. A tax linked to seaweed aquaculture would be derivative of regulatory and port needs when introducing a new industry to the region. Furthermore, farming and food are regulated by government bodies which would require financial resources to enforce regulations and standards.
Overall, the survey consisted of a combination of narrative and visual techniques to describe necessary information to the respondents to assist with making informed decisions. Narrative included short descriptive paragraphs about the CVOW project and relevant co-location activities coupled with images to assist the participant with visualizing the concepts presented and the scale of the OSW farm.
The survey started with background information detailing the CVOW farm and the U.S. OSW industry. The remainder of the first section supplied information and implications associated with each co-location activity. A link to the online survey instrument is provided in Appendix A. Additionally, in section two of the survey, respondents were reminded that there are valid reasons for selecting various co-location scenarios and the SQ option. By highlighting justifications for each decision that can be made, we reduced unintended predisposition toward certain choices which align with best practices in contingent valuation research (Mitchell & Carson, Citation1989; Moeltner et al., Citation2023).
In the third section of the survey, respondents were shown four choice sets pertaining to a specific choice block. To continue through the survey, respondents were required to choose either option A, B, or C for each choice set to collect a total of four votes from each individual. Depending on the responses to the four choice sets, respondents were shown one of two follow-up questions. Those who chose SQ (option C), on all four occasions received the first follow-up question to help us better understand if the response is considered a “protest vote” which can bias the economic values estimated in this study (Meyerhoff et al., Citation2012; Moeltner et al., Citation2023). Protest responses were flagged based on their follow-up question answers, which reflected opinions that the co-location activities are (1) not scientifically feasible, (2) that co-location activities should be funded by the government with existing taxes and fees, and/or (3) that the individual believes their household already pays enough taxes. Based on their responses to the survey and follow-up questions, these individuals were flagged as protest votes because they show signs of unwillingness to accept the scientific information provided to them or have a predisposed bias or political qualm with the topic. Upon initial review of the data, 108 responses were dropped from the sample due to nonsensical or invalid responses.
The final section of the survey consisted of a set of questions requesting the respondents’ perceptions of the quality and helpfulness of the background information, the ability to make their own decisions, and whether they felt pressured to choose any one co-location option (). Additionally, these questions assist us in identifying protest votes and detecting observations that are suitable for econometric observation by understanding if the requested assumptions were made by individuals during the CE. Following the survey quality questions, the study collected general demographic information such as household size, ZIP code of residence, education level, and income level.
Table 1. Clarity and v alidity check questions.
Attributes and attribute levels
The four levels for each co-location activity were represented as percentages of available acreage within the CVOW lease area: 0%, 25%, 75% and. 100%. The fifth attribute was a state annual tax associated with each option and was represented by four uniformly spaced dollar values. These taxes were identified as a mix of state and local taxes based on estimated costs of implementation and management of each co-location activity. Based on information collected during focus groups and available literature on implementation and management costs of each co-location activity, four tax values were chosen. The chosen amounts for this study were $1, $6, $11, and $16.Footnote8 After eliminating nonsensical combinations of attributes and levels (i.e. combinations which exceeded or fell below 100%, or that set “public access” to 100% (thus replicating the SQ option) there were a total of 64 unique permissible profiles (specific combinations of attribute settings). The 64 profiles were then combined into 40 choice sets. Stata’s decreate function was utilized to design choice sets, which comprise of two different co-location scenarios, plus the (invariant) SQ option of 100% public access at no additional cost.
One of the known disadvantages to choice experiments is possible cognitive overload also referred to as survey fatigue, which can arise when deciding between complicated choices or being faced with a long list of repeated choices (Atkinson et al., Citation2018). To prevent this, the final number of profiles was determined to ensure that respondents were not shown too many choice sets which could cause survey fatigue, but enough choice sets to obtain the required number of observations to estimate all targeted model parameters. Each respondent was randomly shown four independent choice sets (a sub-set of four choice sets is referred to as a “choice block”). In total, the survey included ten different choice blocks, with each administered to a sub-sample of respondents of approximately equal size.Footnote9 represents an example of a choice set that was incorporated in the survey. Attributes and attribute levels that were included in the survey are displayed in . The status quo option in the choice set was always listed as 100% public access with $0 annual tax.
Figure 2. Example choice set.
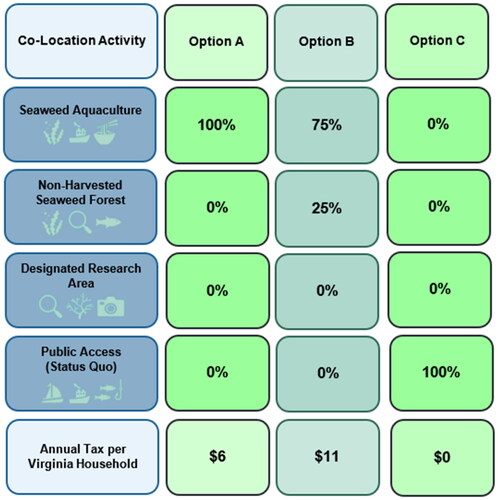
Table 2. Choice experiment attributes.
Participants were then asked to assume there were 1,000 acres of available lease area for the incorporation of co-location activities and that co-location activities were mutually exclusive. For example, if a choice set designated 75% of the open 1,000 acres as a research area, that would mean the research area occupies 750 acres and other co-location activities would be prohibited within that same 750 acres.
Important precautions were followed to ensure the high quality and efficiency of the survey design to elicit reliable responses (Champ et al., Citation2017; Johnston et al., Citation2017; Scarpa & Rose, Citation2008). For example, each choice set was evaluated to safeguard against dominant options (i.e., there were no choice sets in which two options displayed the same combination of attributes and levels with differing taxes). Descriptions of attributes were displayed in non-technical language and clear and concise directions were provided in the survey instrument. To mimic realistic and binding decisions for each respondent, we stressed that this data would be shared with regulators and industry professionals who may utilize the results of this study, and requested respondents vote as if their household would incur the cost associated with each option. To ensure participants voted in line with personal financial abilities, we stressed that any income that went toward a co-location option would reduce available income for other daily expenses. By explicitly addressing this consequence, we align with CE best practices to induce financial discipline in decision-making (Johnston et al., Citation2017; Moeltner et al., Citation2023).
The survey also asked the respondents to make four main assumptions when answering choice questions. The first is to make choices as if they would be incurring the costs associated with the choice sets; the second is to vote as they would in a public election; the third is to assume all co-location activities will not overlap within the space between turbines; and the fourth is to evaluate each choice set individually without comparing a prior set to the next. The fourth assumption is important for reducing potential sequencing effects in the survey responses often caused by allowing earlier choices to influence later votes (Johnston et al., Citation2017; Moeltner et al., Citation2023).
Another precaution taken to circumvent undesired sequencing effects, is the rotation of the choice sets within each block for sub-sets of respondents that were assigned to the same block, ensuring all four choice sets had an equal opportunity to be seen first throughout the entire sample. By implementing these measures in the survey design phase, we were afforded the option to estimate our econometric models utilizing only the first vote for each respondent.
Survey implementation
The final survey instrument was initiated by Qualtrics on 15 February 2021 and closed when the targeted population size and demographics were collected, on March 12, 2021. Qualtrics implemented the survey and utilized “opt-in panels” to recruit survey respondents. In the contract associated with this research, Qualtrics was required to collect a sample size representative of the VA population based on specific quotas. Participants were required to be at least 18 years of age, VA residents, and fall within the requested demographics (shown in ). The survey yielded 1,037 usable questionnaires, representative of the population of VA.
Table 3. General demographics.
Econometric models
The driving theoretical concept behind our empirical modeling is random utility maximization (RUM) theory. RUM theory assumes that given a set of alternative options, an individual will choose the option which provides them with the highest utility or benefit (Holmes et al., Citation2017). McFadden (Citation1974) established the RUM approach which has become a foundation for economic valuation through choice experiments (McFadden, Citation1974). Indirect utility for a given individual i on choice occasion t for option j can be expressed as:
(1)
(1)
where vector zitj includes the co-location scenario attributes, mi is annual income, Pitj is the annual tax associated with the co-location scenario, and εitj captures all other components that affect the utility but are not visible to the researcher. The RUM utility function for individuals who choose the status quo (SQ) option, which stipulates “100% public access” where z only includes a binary indicator for SQ (option C) with θ capturing the corresponding coefficient. Additionally, P equals zero in the SQ scenario and is thus not included in the utility for the SQ option.
In a RUM model, a certain choice can be explained only up to the probability of an alternative being chosen (Krueger et al., Citation2011). If the error term follows a Type-I Extreme Value distribution, as indicated in (Equation 1), and errors are independently and identically distributed, the probability of individual i selecting option j on a given occasion (t) is expressed as:
(2)
(2)
for which, yitj is a binary indicator that takes the value of 1 if an individual chooses j on the tth occasion, and a value of zero if otherwise (McFadden, Citation1974).
The sample likelihood for i = 1…N independent individuals, each facing T independent choice occasions involving J alternatives is then given by EquationEquation 3(3)
(3) .
(3)
(3)
The clogit command in Stata was utilized to estimate the conditional logit regression.
Willingness-to-pay predictions
Expected WTP wi for a given individual to obtain a specific co-location scenario with given attributes zp is derived implicitly by equating the observed portion of indirect utility for the SQ at full income mi with the observed portion of indirect utility associated with either A or B co-location scenarios and reduced income mi – wi (Moeltner et al., Citation2023). Essentially, the maximum amount the individual is willing to tradeoff for a given co-location scenario is wi. By separating β into a sub-vector βz that corresponds to co-location shares, and the SQ coefficient βSQ, expected WTP is calculated using EquationEquation 4(4)
(4) .
(4)
(4)
We apply the nlcom command in Stata to obtain WTP predictions for co-location scenarios along with standard errors and confidence intervals.Footnote10
Results
Descriptive statistics
After removing flagged protest responses (108 responses, roughly 10%) and responses that had unrealistic answers (91 responses, roughly 8%) to general demographic questions, our sample size was reduced to 838 useful questionnaires. With each contributor providing four votes, this translates to a sample of 3,352 observations for economic analysis. General demographics of the 838 respondents are given in . As visible in the table, our sample of respondents largely reflects population demographics from the U.S. Census, with slight differences in some demographics. For instance, our sample has a slightly larger number of females, individuals in the 18–24 age group, 25–34 age group, 35–44 age group, and higher portions of parties with an annual income of less than $50,000.
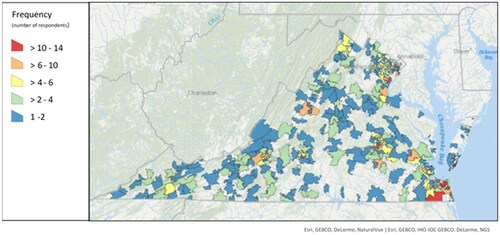
Survey takers were also asked how many years they have been VA resident and their zip code of residence. displays the distribution of survey respondents based on zip code. Of all respondents (N = 1,037), 1,033 individuals provided the number of years they have lived in VA. Of the responses, almost 10% have lived in VA for 0–5 years, approximately 9% have lived in VA for 5–10 years, and 81% have been VA residents for 10+ years.
Figure 3. Zip code survey response distribution map.
The survey asked respondents about their familiarity with the CVOW project and the two-turbine pilot study to help gauge sample knowledge of local offshore developments. Approximately 62% of respondents were unaware of the CVOW project before reading the information provided in the survey, while 72% were unaware of the active two-turbine pilot study prior to reading the information provided in the survey.
Of the 838 useful responses, 812 individuals (approximately 97%) chose either co-location scenario A or B on at least one occasion. Those individuals were shown a corresponding follow-up question, to assist in characterizing their rationale behind their vote.Footnote11 Conversely, 26Footnote12 respondents (approximately 3%) chose the SQ option for all four votes. These respondents viewed a separate follow-up question which provided respondents the opportunity to elaborate on their choice. Responses were flagged as protest responses and eliminated from the sample based on their answers to these follow up questions.Footnote13 The responses to these questions provided extra insurance on the validity of the data.
Estimation results
Within the clogit model, attributes levels were expressed as binary indicators, which allows for nonlinear attribute effects, while the tax associated with each option was treated as a single continuous regressor (Hensher et al., Citation2015; Holmes et al., Citation2017; Moeltner et al., Citation2023). Clogit estimation results are available in . As mentioned in the “Attributes and Attribute Levels” section, we are also able to use only the first vote for every individual to estimate all model parameters. These results can be viewed in columns five through seven in . The table provides the coefficient, standard deviation, and z-score for the clogit regression. Based on the similarities between the full set and respondent’s first choice, these observations suggest there are no ordering or sequencing effects in the data. This means respondents contemplated each choice set independently, as instructed.
Table 4. Conditional logit estimation results.
By taking the coefficients for “all four sets,” and dividing them by the coefficient on the price, individuals are willing to pay approximately $20.23 to increase seaweed aquaculture acreage from zero acres to 250 acres and $26.74 to increase seaweed aquaculture acreage from zero acres to 750 acres. This implies that the public values the extra 500 acres of seaweed aquaculture at $6.98. When comparing the increase of seaweed aquaculture from 75% to 100%, there is a loss of about $6.44. When assessing the coefficients for both the seaweed forest and designated research area activities, 750 acres is also the most preferred amount for those activities. In contrast to the seaweed aquaculture preferences, however, marginal WTP is greater for 1,000 acres than 250 acres for both activities.
Willingness-to-pay results
The estimated coefficients from the clogit regression were used to generate estimated WTP values for each feasible scenario for both models (all four sets and first set only). WTP values are represented in . The mean is the expected WTP over the entire sample. The high and low values are the upper and lower bounds of the 95% confidence intervals. Due to the smaller sample size in the reduced model (first set only), the high and low ranges are larger, but the mean WTP values are comparable to the model using the full sample. To encapsulate all estimations, we will henceforth use the output from the full model for the following discussion.
Table 5. WTP Estimation results (annual $'s per HH).
It can be seen from that the average VA household is willing to pay nearly $40 annually for the combination that includes all four co-location activities. The desire for variety among co-location activities suggests that respondents are generally information seekers and want to explore all options. Due to the lack of precedents for co-location in the US and VA specifically, this preference for “maximum information seeking” was anticipated. The second highest WTP amount is for the combination which includes 75% seaweed aquaculture and 25% non-harvest seaweed forest at more than $31. Willingness-to-pay for the SQ scenario (100% public access for zero dollars) decreases to less than $4 across households.
These values can be utilized by regulators and energy providers to compare the implementation and management costs of each co-location activity to understand if incorporating these activities with the CVOW farm is economically viable, as we will show in the next section. If the public is willing to financially support the co-location option, this can help offset the costs of implementation and management of that co-location option.
One of the goals of this research is to inform offshore development managers about the public benefits of potential co-location opportunities with the CVOW farm. Available literature and industry best practices for each co-location activity were applied to calculate broad cost estimates used to compare with the dollar per 1,000-acre estimations from the survey responses. A summary of the cost estimate calculations is included in Appendix B.
To calculate a conservative annual cost per acre for the seaweed farm, the startup and maintenance values were aggregated to produce an annual dollar per acre expense of $2,703.49 (Laylin, Citation2015; van den Burg et al., Citation2016). When the expenses are divided by the Census Bureau’s 2020 number of households in VA (3,128,415), the annual cost per 1,000 acres per household is $0.86 (Census Bureau, Citation2020). To estimate costs for the non-harvested seaweed forest, the harvesting cost was subtracted from the annual maintenance costs used for the seaweed farm estimation, and yielded an annual expense of $0.81, for 1,000 acres. Once the forest is established and ropes are removed the seaweed forest is likely to require infrequent management. According to an analysis evaluating expenditures of marine reserves across the world, a marine reserve of similar size to the CVOW lease area costs approximately $849.72 per acre to implement and maintain (McCrea-Strub et al., Citation2011). This puts the cost per 1,000 acres, per household at $0.27, which is far less than the households that participated in this study are willing-to-pay for implementation.Footnote14
demonstrates the comparison of the estimated costs of each co-location scenario per Virginian household to the estimated WTP values per household on a per 1,000 acre basis. This comparison is valuable because it shows that for each scenario, the average Virginia household is willing to pay far more than what the co-location scenario costs to see it implemented. These results further demonstrate public interest in incorporating co-location with offshore wind and are willing to financially support the cause.
Table 6. Estimated cost vs WTP comparison.
Conclusion
As offshore development continues to grow in popularity and there are increasing ways in which the ocean is utilized as a resource, there can be spatial challenges that arise from various offshore industries competing for ocean space. The co-existence of OSW farms and other marine activities provides potential for synergies across industries, and efficient use of offshore space. Our research sought to fill a void in the OSW industry, which is, valuing public preference for practical co-location activities to occupy the ocean space between the turbines of the CVOW farm.
WTP data on this topic from the public is helpful information for energy providers, researchers, aquaculturists, and policymakers because it shows the value that the public places on the presence of each activity in contrast to the perceived implementation and maintenance costs of each activity. By understanding public predilection toward various offshore activities through calculating WTP, energy providers can make informed decision regarding implementation of certain co-location techniques which can potentially lead to decreased public opposition.
Since the public is entitled to a certain level of power in the development sphere, a well-informed public is important to the success of development projects. This survey also asked respondents to demonstrate their awareness of the CVOW project prior to the survey. As previously discussed, the results show 62% percent of participants were unaware of the already approved CVOW project before reading the information provided in this survey. This level of unawareness suggests room for improvement on information sharing or potential benefit of an education campaign from the energy providers and regulators regarding the expansion of VA’s OSW industry. A well-informed public regarding development projects which directly impact their daily-lives can help prevent disinformation and more useful public involvement for future offshore development projects.
Additionally, implementation of co-location activities largely depends on the associated costs. It is recommended that regulators and energy providers complete a more comprehensive cost-benefit analysis involving existing feasible co-location technologies, include information about permitting processes, and understand transaction costs associated with the implementation and management of each technique.
In sum, the U.S. OSW industry is growing rapidly and presents exciting opportunities for other businesses to collaborate. While implementation of co-location has logistical and regulatory challenges, our findings demonstrate Virginians associate monetary value with the option of incorporating co-location techniques besides public access and are willing to pay exponentially more than the estimated implementation and management costs to incorporate co-location in VA. In addition to public preference, there are many potential benefits to the local economy and marine environment that favor further exploration of co-location opportunities in the Commonwealth of VA.
Disclosure statement
No potential conflict of interest was reported by the author(s).
Additional information
Funding
Notes
1 Seaweed has several uses in multiple markets and is becoming a more popular alternative to land-grown products in various food, fuel, and feed markets (van den Burg et al., Citation2016).
2 Investigators have discovered that as an alternative feed for livestock, the U.S. production of seaweed can reduce soy imports, and combat deforestation that occurs in soy-producing countries (Wassef et al., Citation2005).
3 Literature indicates that research-only marine areas are sometimes met with tension among anglers and recreational boaters (Bartholomew et al. Citation2008). To mitigate conflict and negative perceptions regarding the designated research area, it is advised regulators incorporate perspectives of local anglers and recreationists when designating marine reserves and making management decisions (Suman et al., Citation1999).
4 The materials associated with the research methods involved in this study (ID # 20-580) complied with and were approved by Virginia Tech’s (VT) Institutional Review Board (IRB) to ensure the safety of all participants.
5 For a broader discussion on the benefits and challenges of choice experiments and other stated preference tools please refer to Henscher et al. (2015), Johnston et al. (Citation2017), and Holmes et al. (Citation2017).
6 Moderation of focus group sessions adhered to best practices by fostering free-flowing discussion, the inclusion of all participants, abstaining from technical jargon, and emphasis on experiences of participants related to the research topic (Edmunds, Citation1999; Nyumba et al., Citation2018).
7 Participants were compensated $40 for their time and opportunities for breaks were provided throughout both sessions.
8 Once a range of realistic tax values was determined, four uniformly spaced values along that spectrum were chosen. We follow Moeltner et al. (Citation2023) and space these bids uniformly, so no one tax value seemed overly cheap or burdensome.
9 Using 40 unique choice sets also kept survey time down and allowed each respondent to visualize 1 of 10 choice blocks and vote on a total of four choice sets. This method represents optimal grouping of alternatives into the 40 choice sets which follows D-efficiency design criterion (Holmes et al., Citation2017).
10 As is evident from EquationEquation 4(4)
(4) , expected WTP is dependent upon the estimate of λ, which is the marginal utility of income. A smaller λ will increase mean WTP. For instance, if many people choose co-location options (A or B) in the questionnaire, even at the highest tax provided, this suggests a relatively small marginal utility of income, leading to a small estimate of λ. This explains how WTP estimates can surpass the tax values offered in the survey. The SQ interaction variable in the nlcom model captures the implicit utility of the SQ option.
11 Individuals were permitted to select as many reasons as applicable.
12 After excluding protest no, and unreliable follow-up question responses.
13 Responses were flagged based on their follow-up question answers, which reflected opinions that the co-location activities are (1) not scientifically feasible, (2) that co-location activities should be funded by the government with existing taxes and fees, and/or (3) that the individual believes their household already pays enough taxes
14 An implementation and management cost estimate was not calculated for the public access co-location activity because this study assumed that public access is the SQ, and Virginians will not be taxed extra to access this portion of the CVOW lease area.
References
- Abate, T. G., Nielsen, R., & Tveterås, R. (2016). Stringency of environmental regulation and aquaculture growth: A cross-country analysis. Aquaculture Economics & Management, 20(2), 201–221. https://doi.org/10.1080/13657305.2016.1156191
- Asche, F., Eggert, H., Oglend, A., Roheim, C. A., & Smith, M. D. (2022). Aquaculture: Externalities and policy options. Review of Environmental Economics and Policy, 16(2), 282–305. https://doi.org/10.1086/721055
- Ashley, M., Austen, M., Rodwell, L., & Mangi, C. S. (2018). Co-locating offshore wind farms and marine protected areas. In K. L. Yates & C. J. A. Bradshaw (Eds.), Offshore energy and marine spatial planning (1st ed.). Routledge. https://doi.org/10.4324/9781315666877
- Atkinson, G., Braathen, N. A., Groom, B., & Mourato, S. (2018). Cost-benefit analysis and the environment. OECDLibrary.
- Bailey, H., Brookes, K. L., & Thompson, P. M. (2014). Assessing environmental impacts of offshore wind farms: Lessons learned and recommendations for the future. Aquatic Biosystems, 10(1), 8. https://doi.org/10.1186/2046-9063-10-8
- Bartholomew, A., Bohnsack, J. A., Smith, S. G., Ault, J. S., Harper, D. E., & McClellan, D. B. (2008). Influence of marine reserve size and boundary length on the initial response of exploited reef fishes in the Florida Keys National Marine Sanctuary, USA. Landscape Ecology, 23(S1), 55–65. https://doi.org/10.1007/s10980-007-9136-0
- Bates, A. W. (2016). Key challenges of offshore wind power: Three essays addressing public acceptance, stakeholder conflict, and wildlife impacts. University of Delaware, ProQuest Dissertations Publishing. https://search.proquest.com/openview/ed0eafb4d5872259f5e8c22a7c9e9102/1?pq-origsite=gscholar&cbl=18750&diss=y
- Buck, B. H., & Langan, R. (Eds.). (2017). Aquaculture perspective of multi-use sites in the open ocean. Springer International Publishing. https://doi.org/10.1007/978-3-319-51159-7
- Census Bureau. (2020). Coastal areas. The United States Census Bureau. https://www.census.gov/topics/preparedness/about/coastal-areas.html
- Champ, P. A., Boyle, K. J., & Brown, T. C. (Eds.). (2017). A primer on nonmarket valuation (Vol. 13). Springer. https://doi.org/10.1007/978-94-007-7104-8
- Coastal Virginia Offshore Wind. (2020). Dominion energy. https://www.dominionenergy.com/projects-and-facilities/wind-power-facilities-and-projects/coastal-virginia-offshore-wind
- Commonwealth of Virginia & Executive Office of the Governor [Ralph Northam]. (2019). Executive order 43: Expanding access to clean energy and growing the clean energy jobs of the future. Commonwealth of Virginia.
- Craig, R. K. (2018). Harvest the wind, harvest your dinner: Using law to encourage an offshore energy-food multiple-use nexus. Utah Law Faculty Scholarship. 97. https://dc.law.utah.edu/scholarship/97
- Department of Energy. (2023). Request for informaiton: Offshore wind centers of excelence and synergies between offshore wind, marine energy, and aquaculture. https://eere-exchange.energy.gov/Default.aspx#FoaId9dfc17bc-3bff-49a4-8734-9e1f61ff2d20
- Edmunds, H. (1999). The focus group research handbook. McGraw-Hill Education. http://search.ebscohost.com.ezproxy.lib.vt.edu/login.aspx?direct=true&db=nlebk&AN=68453&scope=site
- Finley, B. (2017, May 1). Wealthy homeowners take on oystermen in war for the coast. AP NEWS. https://apnews.com/da5e952082414e38bc8c03da2f2bcf95
- Gertz, E. (2017). Vertical ocean farms that can feed us and help our seas. https://ideas.ted.com/vertical-ocean-farms-that-can-feed-us-and-help-our-seas/
- Grebe, G. S., Byron, C. J., Gelais, A. S., Kotowicz, D. M., & Olson, T. K. (2019). An ecosystem approach to kelp aquaculture in the Americas and Europe. Aquaculture Reports, 15, 100215. https://doi.org/10.1016/j.aqrep.2019.100215
- Haggett, C. (2011). Understanding public responses to offshore wind power. Energy Policy, 39(2), 503–510. https://doi.org/10.1016/j.enpol.2010.10.014
- Halpern, B. S., & Warner, R. R. (2003). Review paper. Matching marine reserve design to reserve objectives. Proceedings. Biological Sciences, 270(1527), 1871–1878. https://doi.org/10.1098/rspb.2003.2405
- He, P., Xu, S., Zhang, H., Wen, S., Dai, Y., Lin, S., & Yarish, C. (2008). Bioremediation efficiency in the removal of dissolved inorganic nutrients by the red seaweed, Porphyra yezoensis, cultivated in the open sea. Water Research, 42(4–5), 1281–1289. https://doi.org/10.1016/j.watres.2007.09.023
- Hensher, D. A., Rose, J. M., & Greene, W. H. (2015). Applied choice analysis. Cambridge University Press. https://doi.org/10.1017/CBO9781316136232
- Holm, P., Buck, B. H., & Langan, R. (2017). Introduction: New approaches to sustainable offshore food production and the development of offshore platforms. In B. H. Buck & R. Langan (Eds.), Aquaculture perspective of multi-use sites in the open ocean (pp. 1–20). Springer International Publishing. https://doi.org/10.1007/978-3-319-51159-7_1
- Holmes, T. P., Adamowicz, W. L., & Carlsson, F. (2017). Choice experiments. In P. A. Champ, K. J. Boyle, & T. C. Brown (Eds.), A primer on nonmarket valuation (Vol. 13, pp. 133–186). Springer. https://doi.org/10.1007/978-94-007-7104-8_5
- Howarth, L. M., Roberts, C. M., Hawkins, J. P., Steadman, D. J., & Beukers-Stewart, B. D. (2015). Effects of ecosystem protection on scallop populations within a community-led temperate marine reserve. Marine Biology, 162(4), 823–840. https://doi.org/10.1007/s00227-015-2627-7
- Johnston, R. J., Boyle, K. J., Adamowicz, W., Bennett, J., Brouwer, R., Cameron, T. A., Hanemann, W. M., Hanley, N., Ryan, M., Scarpa, R., Tourangeau, R., & Vossler, C. A. (2017). Contemporary guidance for stated preference studies. Contemporary Guidance for Stated Preference Studies, 4(2), 319–405. https://doi.org/10.1086/691697
- Jones, A. R., Alleway, H. K., McAfee, D., Reis-Santos, P., Theuerkauf, S. J., & Jones, R. C. (2022). Climate-friendly seafood: The potential for emissions reduction and carbon capture in marine aquaculture. Bioscience, 72(2), 123–143. https://doi.org/10.1093/biosci/biab126
- Kite-Powell, H. L. (2017). Economics of multi-use and co-location. In B. H. Buck & R. Langan (Eds.), Aquaculture perspective of multi-use sites in the open ocean: The untapped potential for marine resources in the anthropocene (pp. 233–249). Springer International Publishing. https://doi.org/10.1007/978-3-319-51159-7_10
- Knapp, L., & Ladenburg, J. (2015). How spatial relationships influence economic preferences for wind power—A review. Energies, 8(6), 6177–6201. https://doi.org/10.3390/en8066177
- Krause, G., Brugere, C., Diedrich, A., Ebeling, M. W., Ferse, S. C., Mikkelsen, E., Pérez Agúndez, J. A., Stead, S. M., Stybel, N., & Troell, M. (2015). A revolution without people? Closing the people–policy gap in aquaculture development. Aquaculture, 447, 44–55. https://doi.org/10.1016/j.aquaculture.2015.02.009
- Krause, G., & Mikkelsen, E. (2017). The socio-economic dimensions of offshore aquaculture in a multi-use setting. In B. H. Buck & R. Langan (Eds.), Aquaculture perspective of multi-use sites in the open ocean: The untapped potential for marine resources in the anthropocene (pp. 163–186). Springer International Publishing. https://doi.org/10.1007/978-3-319-51159-7_8
- Krueger, A. D., Parsons, G. R., & Firestone, J. (2011). Valuing the visual disamenity of offshore wind power projects at varying distances from the shore: An application on the Delaware Shoreline. Land Economics, 87(2), 268–283. https://doi.org/10.3368/le.87.2.268
- Langhamer, O. (2012). Artificial Reef Effect in relation to Offshore Renewable Energy Conversion: State of the art. TheScientificWorldJournal, 2012, 386713–386718. https://doi.org/10.1100/2012/386713
- Laylin, T. (2015, October 22). GreenWave ocean farming model scoops $100,000 sustainability prize. Guardian sustainable business | The Guardian. https://www.theguardian.com/sustainable-business/2015/oct/22/greenwave-ocean-farming-bren-smith-fuller-challenge-sustainability-climate-change
- Lee, A. (2023, February 16). Amazon puts $1.6m behind “world-first” plan to harvest seaweed at offshore wind farm. Recharge | Latest Renewable Energy News. https://www.rechargenews.com/wind/amazon-puts-1-6m-behind-world-first-plan-to-harvest-seaweed-at-offshore-wind-farm/2-1-1405052
- Leung, D. Y. C., & Yang, Y. (2012). Wind energy development and its environmental impact: A review. Renewable and Sustainable Energy Reviews, 16(1), 1031–1039. https://doi.org/10.1016/j.rser.2011.09.024
- Mayeda, A. M., & Boyd, A. D. (2020). Factors influencing public perceptions of hydropower projects: A systematic literature review. Renewable and Sustainable Energy Reviews, 121, 109713. https://doi.org/10.1016/j.rser.2020.109713
- McCrea-Strub, A., Zeller, D., Rashid Sumaila, U., Nelson, J., Balmford, A., & Pauly, D. (2011). Understanding the cost of establishing marine protected areas. Marine Policy, 35(1), 1–9. https://doi.org/10.1016/j.marpol.2010.07.001
- McFadden, D. (1974). Conditional logit analysis of qualitative choice behaviour. Frontiers in Econometrics, 105–142. https://eml.berkeley.edu/reprints/mcfadden/zarembka.pdf
- Meyerhoff, J., Bartczak, A., & Liebe, U. (2012). Protester or non-protester: A binary state? On the use (and non-use) of latent class models to analyse protesting in economic valuation. Australian Journal of Agricultural and Resource Economics, 56(3), 438–454. https://doi.org/10.1111/j.1467-8489.2012.00582.x
- Michler-Cieluch, T., & Kodeih, S. (2008). Mussel and seaweed cultivation in offshore wind farms: An opinion survey. Coastal Management, 36(4), 392–411. https://doi.org/10.1080/08920750802273185
- Mid-Atlantic Regional Council on the Ocean. (2020). Mid-Atlantic ocean data portal—Marine planner. http://portal.midatlanticocean.org/visualize/#x=-73.24&y=38.93&z=7&logo=true&controls=true&basemap=Ocean&tab=data&legends=false&layers=true
- Mitchell, R., & Carson, R. (1989). Using surveys to value public goods: The contingent valuation method (Vol. 14). Resources for the Future http://www.sciencedirect.com/science/article/pii/0198971590900674
- Moeltner, K., Fanara, T., Foroutan, H., Hanlon, R., Lovko, V., Ross, S., & David, S. I. (2023). Harmful algal blooms and toxic air: The economic value of improved forecasts. Marine Resource Economics, 38(1), 1–28. https://doi.org/10.1086/722598
- Nyumba, T., Wilson, K., Derrick, C. J., & Mukherjee, N. (2018). The use of focus group discussion methodology: Insights from two decades of application in conservation. Methods in Ecology and Evolution, 9(1), 20–32. https://doi.org/10.1111/2041-210X.12860
- Office of Governor Glenn Youngkin. (2023). Governor Glenn Youngkin on Dominion Energy’s 2023 integrated resource plan. Goveror of Virginia Glenn Youngkin. https://www.governor.virginia.gov/newsroom/news-releases/2023/may/name-1002282-en.html
- Pauly, D., Christensen, V., Guénette, S., Pitcher, T. J., Sumaila, U. R., Walters, C. J., Watson, R., & Zeller, D. (2002). Towards sustainability in world fisheries. Nature, 418(6898), 689–695. https://doi.org/10.1038/nature01017
- Rockmann, C., Lagerveld, S., & Stavenuiter, J. (2017). Operation and maintenance costs of offshore wind farms and potential multi-use platforms in the Dutch North Sea. In B. H. Buck & R. Langan (Eds.), Aquaculture perspective of multi-use sites in the open ocean: The untapped potential for marine resources in the anthropocene (pp. 97–113). Springer International Publishing. https://doi.org/10.1007/978-3-319-51159-7_4
- Roesijadi, G., Copping, A. E., Huesemann, M. H., Forster, J., Benemann, J. R., Thom, R. M., Hanisak, M. D. (2008). Techno-economic feasibility analysis of offshore seaweed farming for bioenergy and biobased products. Battelle Pacific Northwest Division.
- Russell, A., Bingaman, S., & Garcia, H.-M. (2021). Threading a moving needle: The spatial dimensions characterizing US offshore wind policy drivers. Energy Policy, 157, 112516. https://doi.org/10.1016/j.enpol.2021.112516
- Scarpa, R., & Rose, J. M. (2008). Design efficiency for non-market valuation with choice modelling: How to measure it, what to report and why. Australian Journal of Agricultural and Resource Economics, 52(3), 253–282. https://doi.org/10.1111/j.1467-8489.2007.00436.x
- Siah, W. M., Aminah, A., & Ishak, A. (2015). Edible films from seaweed (Kappaphycus alvarezii). International Food Research Journal; Selangor, 22(6), 2230–2236.
- Suman, D., Shivlani, M., & Walter Milon, J. (1999). Perceptions and attitudes regarding marine reserves: A comparison of stakeholder groups in the Florida Keys National Marine Sanctuary. Ocean & Coastal Management, 42(12), 1019–1040. https://doi.org/10.1016/S0964-5691(99)00062-9
- van den Burg, S. W. K., Duijn, A. P., Van, Bartelings, H., Krimpen, M. M. v., & Poelman, M. (2016). The economic feasibility of seaweed production in the North Sea. Aquaculture Economics & Management, 20(3), 235–252. https://doi.org/10.1080/13657305.2016.1177859
- Wassef, E. A., El-Sayed, A. F. M., Kandeel, K. M., & Sakr, E. M. (2005). Evaluation of Pterocla Dia (Rhodophyta) and Ulva (Chlorophyta) meals as additives to gilthead seabream Sparus aurata diets. Egyptian Journal of Aquatic Research. 31, 321–332.
- Webster, K., & Porter, R. (2020). Legal limits on recreational fishing near offshore wind facilities. https://docs.rwu.edu/cgi/viewcontent.cgi?article=1100&context=law_ma_seagrant
- Wenzel, L., & D’lorio, M. (2011). NOAA definition and classification system form US marine protected areas.pdf. Marine Protected Area. https://media.nationalgeographic.org/assets/file/NOAA-_Definition_and_Classification_System_for_US_Marine_Protected_Areas.pdf
- White, C., Kendall, B. E., Gaines, S., Siegel, D. A., & Costello, C. (2008). Marine reserve effects on fishery profit. Ecology Letters, 11(4), 370–379. https://doi.org/10.1111/j.1461-0248.2007.01151.x
- World Bank Group. (2016). Seaweed aquaculture for food security, income generation and environmental health in tropical developing countries. World Bank. https://doi.org/10.1596/24919
Appendix A:
Survey instrument
Link to online survey instrument to be inserted here.
Appendix B:
Cost estimation calculations
A regenerative ocean farming company that cultivates seaweed in the Atlantic Ocean estimates the market entry costs of a 20-acre offshore seaweed farm at $50,000 (Laylin, Citation2015). A study calculating maintenance costs for the operation of a seaweed farm in the North Sea approximated an annual cost of $203.50 per acre (van den Burg et al., Citation2016). This annual maintenance calculation included fixed, maintenance, harvesting and transport, labor, material, and other variable costs associated with the business. To calculate a conservative annual cost per acre, the startup and maintenance values were aggregated to produce an annual dollar per acre expense of $2,703 (Laylin, Citation2015; van den Burg et al., Citation2016). When the expenses are divided by the Census Bureau’s number of households in Virginia (3,128,415), the annual cost per 1,000 acres per household is $0.86 (Census Bureau, Citation2020). Costs associated with regulation of an offshore seaweed farm by local United States government officials and the Virginia Port Authority are additional fees potentially associated with this co-location technique that were not readily available to include in this estimation.
Due to the lack of data on comparable man-made seaweed forest ventures, valuing a non-harvested seaweed forest is comparable to the startup costs associated with the seaweed aquaculture farm. Although there would be less maintenance associated with a non-harvest seaweed forest compared to a farm, the same source was used for the maintenance costs. The harvesting cost was subtracted from the annual maintenance costs, which yielded an annual expense of $0.81, for 1,000 acres. Once the forest is established and ropes are removed the seaweed forest may require infrequent management.
Research on implementation, operation, and management costs associated with marine reserves (designated marine research areas) provided the values used to calculate the estimated price for comparison. According to an analysis evaluating expenditures of marine reserves across the world, a marine reserve of similar size to the CVOW lease area costs approximately $850 per acre to implement and maintain (McCrea-Strub et al., Citation2011). This puts the cost per 1,000 acres, per household at $0.27. Costs for marine reserves vary widely across the globe. The operation and maintenance costs associated with a marine reserve in VA may differ from the value utilized in this estimation.