
ABSTRACT
How do people perceive landscapes? What elements of the landscape do they identify as characteristic of a landscape? And how can we arrive at descriptions, and ultimately representations that better reflect people’s notions of landscapes? In this study, we collected landscape descriptions from five landscape types at 10 study sites in Switzerland. For each site, we collected data from three sources: free lists with participants, hiking blogs, and Flickr tags. Free lists were obtained through on-site interviews with visitors, hiking blogs were gathered by focused crawling of web content, and Flickr tags were selected based on spatial footprints obtained from the hiking blogs. We quantitatively compared landscape descriptions between data sources and landscape types using cosine similarity. We found that descriptions from the same data source were significantly more similar, irrespective of landscape type. Descriptions from the same landscape type were more similar, but only within the same data source. Through a qualitative analysis of different aspects of landscape in our content, we found that each data source offered a different distribution of landscape aspects. For example, while Flickr tags contained high proportions of toponyms, they contained little content relating to sense of place. In contrast, hiking blogs contained more information about sense of place. Our approach combining these varied textual sources thus offers a more holistic view on landscapes. This study constitutes a step toward extracting semantically rich descriptions of landscapes from a variety of sources and using this information to distinguish different landscapes, with potential applications for landscape monitoring and management.
1. Introduction
How do people perceive landscapes? What elements of the landscape do they identify and pick out as being characteristic? And how can we arrive at descriptions, and ultimately computational representations that better reflect people’s notions of landscapes? Making a methodological contribution to answering these questions lies at the heart of this article’s aims. In particular, we wish to make a contribution to research methods that relate to landscape policy. An important starting point is thus the European Landscape Convention (Council of Europe Citation2000), which defines landscape as being ‘an area, as perceived by people, whose character is the result of the action and interaction of natural and/or human factors’. Central to this definition is the notion of landscape as being something which is perceived and thus, presumably, characterizations of landscape should consider ways in which they are described by people (Scott Citation2002, Citation2003).
Methods to characterize and assess landscapes have a long history in landscape research (Daniel and Vining Citation1983, Zube Citation1984, Brabyn Citation1996). The importance of such methods has increased, since less tangible benefits derived by humans through landscapes form a cornerstone of the ecosystem services (ES) framework. ES aim to quantify the benefits which humans derive, either directly or indirectly, from ecosystems (Costanza et al. Citation1997, MA Citation2005) and can be broadly divided into four classes: provisioning (e.g. the provision of fresh water or biomass); regulating (e.g. the ability of a flood plain to reduce flooding downstream); supporting (e.g. the redistribution of seeds by birds); and cultural (e.g. the recreational or spiritual meaning attached to an ecosystem) (MA Citation2005). Perhaps unsurprisingly, efforts to map ES often turn to spatially continuous data and apply traditional GIS analytical techniques to locating and quantifying ES (de Groot et al. Citation2010). However, although this approach may function well in modelling ES with a relatively direct relationship to biophysical properties, such as estimates of above-ground biomass through tree cover and derived volume (Dong et al. Citation2003) or the number of visitors to a region (Nahuelhual et al. Citation2013), it is less well suited to capturing and representing many cultural values. Indeed, in a call strikingly similar to the social critique of GIS advanced by Pickles (Citation1995), Kirchhoff (Citation2012) concluded that: ‘[.] pivotal cultural values attaching to the natural/cultivated environment cannot be integrated into the ES framework, and should not be called cultural ES’.
We do not propose to revisit these debates here, but rather suggest that this problem has to do with not only what we try to model, but also how we go about doing so. If we wish to model culturally meaningful properties, then an appropriate starting point is not a continuous representation of space such as a land cover/land use map, but rather the landscape features with which cultural meanings are associated (Mark and Turk Citation2003, Kirchhoff Citation2012). Since such features are not readily embedded in spatially explicit, continuous representations (Smith and Mark Citation2003), we take as our starting point not spatial data, but spatially grounded language. This approach can be seen to overlap with recent efforts to use crowdsourced information to characterize different aspects of landscapes (e.g. van Zanten et al. Citation2016) with the underlying assumptions that, firstly, such efforts potentially allow us to characterize large areas efficiently and, secondly, that data gathered through crowdsourcing are representative of the underlying properties of landscape in which we are interested.
In this article, we explore methods to collect and compare landscape descriptions obtained from the public through three approaches. Our aim is to analyze to what extent different methodological approaches, and consequently, different data sources, result in different descriptions of landscapes, and in doing so demonstrate the potential of combining complementary approaches to characterize landscapes bottom-up. To address this aim, we specify two research questions:
• RQ1: How can empirical in situ methods be combined with data-driven approaches to collect landscape descriptions from the public?
• RQ2: How do landscape descriptions from different data sources differ?
We chose 10 study sites in Switzerland to empirically investigate these research questions. Using a triangulation of methods based on in situ free listings with visitors, full text descriptions mined from the web, and georeferenced image tags from the photo-sharing platform Flickr, we compared landscape descriptions with respect to data sources and landscape types. Our hypothesis is that landscape types reflect differences perceived by people, which are reflected in differences in the textual descriptions of these landscapes.
The remainder of this article is organized as follows: in Section 2 we introduce related work, before describing the study sites and the methods used to collect and analyze landscape descriptions in Section 3. In Section 4 we present results from comparisons of data sources and landscape types, interpreting these with respect to landscape characterization and typologies in the Swiss context. In Section 5 we discuss our results in relation to other work and our research questions, before concluding the article in Section 6.
2. Related work
Since our aim in this article is to characterize landscapes using multiple data sources in ways which are useful in both science and policy, we first briefly establish the need for improved methods to characterize landscapes, highlighting some of the key challenges. We then give a brief overview of the methodological underpinnings of the three approaches we chose to apply to the problem, identifying properties of both the data sources and the methodological tools necessary for their analysis in the context of spatially situated landscape descriptions.
2.1. Challenges in landscape characterization
Any characterization of landscape must first deal with two related fundamental questions. Firstly, should landscape be essentially treated as a continuous field, or as a set of identifiable objects to which properties are attached (Mark et al. Citation2011)? And secondly, can landscape properties be objectively extracted from spatial data or are they the product of individual perception (Warnock and Griffiths Citation2015)? We suggest these dichotomies are linked to the definition of landscape underpinning its characterization, and to the methods applied. Approaches treating landscape as a set of features that are identified and named with generic terms (e.g. stream, hedge, meadow) pay particular attention to the importance of language in structuring our experience of landscape (Johnson and Hunn Citation2010, Mark et al. Citation2011), but these terms are seldom used as the basis for mapping (Wartmann and Purves Citation2017). Approaches conceptualizing landscape as an objective, continuous field often focus on extracting landscape units from available data, based on shared biophysical and morphological properties, for example in the form of terrain attributes or land cover classes using supervised or unsupervised approaches (Bunce et al. Citation1996, Gerçek et al. Citation2011, Niesterowicz et al. Citation2016). However, such approaches typically either apply existing expert classifications of input data, as is the case when land cover data are used (Mücher et al. Citation2010, Comber Citation2013), or attach relatively simple semantics to extracted patterns (Iwahashi and Pike Citation2007).
Missing in such approaches is a direct link to how landscape is subjectively perceived, despite this being recognized as a requirement in legislation, for example in the European Landscape Convention (Council of Europe Citation2000). This gap has led to the development of approaches that attempt to characterize landscape based not only on its biophysical properties, but also more directly based on human perception (Warnock and Griffiths Citation2015).
In Switzerland, where we conducted our case study, a landscape typology exists with 38 landscape types, which are modelled using a range of mostly biophysical criteria such as geology, geomorphology, climate, topography, and land use (ARE Citation2011a). However, perceptual aspects are also recognized, although these are based on expert assessments (ARE Citation2011b), in which the views of outsiders dominate more locally grounded ones (Butler Citation2016). The Swiss Landscape Monitoring framework ‘LABES’ goes further, including both biophysical indicators and those related to cultural perception of landscapes, such as ‘distinctiveness’, ‘authenticity’, ‘fascination’, and ‘perceived landscape beauty’ (Kienast et al. Citation2015). Assessing these indicators involved sending out written questionnaires to Swiss households, with a total of 2800 questionnaires returned for analysis (Kienast et al. Citation2015). Written questionnaires, however, incur high costs, typically with relatively low response rates allowing analysis only at coarse spatial granularities, and for spatial extents that are defined by administrative boundaries, which may be at odds with how people perceive and experience landscapes.
In the United Kingdom, a long tradition of including perceptual and aesthetic aspects for landscape management and planning exists in the form of Landscape Character Assessments (LCAs) and associated approaches (Swanwick Citation2002, Natural England Citation2014, Sarlöv Herlin Citation2016). Landscape character is considered as the ‘distinct and recognizable pattern of elements that occur consistently in a certain type of landscape. […] Character is what makes landscapes distinctive and creates a particular sense of place in a locality’ (Swanwick Citation2004, p.111).The guidelines developed by the Countryside Agency and the Scottish Natural Heritage, and other similar initiatives, have also been adapted in other countries (Jessel Citation2006, Caspersen Citation2009, Van Eetvelde and Antrop Citation2009a, Citation2009b). Typically, experts assess both environmental and cultural aspects and produce outputs including textual descriptions and sketches describing relatively homogeneous regions. The views of the public may be included through a variety of empirical methods including questionnaires, group workshops, and participatory mapping (Swanwick et al. Citation2002, Caspersen Citation2009). Key to the resulting products are not only maps of bounded landscape units, but rich textual descriptions associated with these regions. These approaches come closer to incorporating ways in which landscapes are perceived, but are time-consuming and often still top-down, with limited incorporation of public perception (Butler Citation2016).
The emergence of large volumes of user-generated content, or volunteered geographic information, presents an opportunity to capture greater volumes of data with respect to landscape perception, especially in the form of images and associated descriptions. Indeed, georeferenced images have been used as proxies of landscape preference at both regional (Tenerelli et al. Citation2016, Yoshimura and Hiura Citation2017) and continental scales (van Zanten et al. Citation2016). The potential value of image descriptions has also been recognized in exploring landscapes (Dunkel Citation2015) and extracting information related to cultural ES (Richards and Friess Citation2015, Guerrero et al. Citation2016, Figueroa-Alfaro and Tang Citation2017, Oteros-Rozas et al. Citation2017). User-generated content can at least start to bridge the data gap between expert and bottom-up perceptions of landscape, and provide more spatially extensive data, at lower costs. However, it remains to be shown to what extent different data sources and approaches can complement one another.
2.2. Bottom-up approaches to collect data about landscape characteristics
In this article, we took three approaches to characterizing landscapes. The first is based on elicitation through free-listing exercises. Although inferior to more detailed ethnographic methods (Johnson and Hunn Citation2010, Mark et al. Citation2011), free-listing tasks in classroom settings have been shown to elicit landscape categories which appear to converge across languages in European and US settings (Mark et al. Citation1999, Giannakopoulou et al. Citation2013). Adding more context to the free-listing task, either by using video stimuli (Williams et al. Citation2012) or interviewing participants outdoors in different landscape settings (Wartmann Citation2015), has shown that participants name locally relevant landscape features, using cognitive associations to recall individual terms. However, though free listing is relatively straightforward, conducting in situ experiments is still time-consuming.
Our second method is based on user-generated content in the form of unstructured text. Recent work on the analysis of digitized text corpora has started to reveal the potential richness of unstructured text as a means for collecting information about landscapes. For instance, Derungs and Purves (Citation2013) georeferenced and extracted terms related to natural landscape features from a Swiss alpine mountaineering corpus. They used these features to compare landscape descriptions across space through spatially weighted term vectors of natural landscape features, generating so-called ‘spatial folksonomies’ (Derungs and Purves Citation2016). These approaches characterized landscape, at least at the level of landscape features, bottom-up, but retained a focus on a continuous, grid-based representation. More generally, there is an ongoing recognition of the potential of such unstructured text as a source of geographic information, with the important proviso that relating text to specific locations remains a challenging task (Gregory and Hardie Citation2011, Wang and Stewart Citation2015).
Our third and final approach uses image tags from user-generated content. As image tags emerged as a relevant textual data source, one important question was the extent to which it was comparable with previous empirical work. Edwardes and Purves (Citation2007) showed that lists of terms extracted from an image sharing website broadly followed similar patterns as previous work based around free lists (Mark et al. Citation1999), while Rorissa (Citation2008) demonstrated that tags associated with individual images often took the form of cognitive basic levels which also appear to emerge from free-listing experiments (Tversky and Hemenway Citation1983). However, in contrast to free-listing experiments, instances (as opposed to types) are acknowledged as being very common ways of tagging individual images, with for example 25 percent of tags reported to take the form of toponyms (Hollenstein and Purves Citation2010). Since a portion of Flickr images is also georeferenced, it is possible to both define regions based on co-occurring Flickr tags (Grothe and Schaab Citation2009, Hollenstein and Purves Citation2010), and to characterize regions based around tag occurrence (Rattenbury and Naaman Citation2009, Gschwend and Purves Citation2012, Dunkel Citation2015). However, a major shortcoming of such approaches remains the nature of the vocabulary used in tagging, and the difficulties of defining meaningful units with which to associate descriptions.
Based on the challenges associated with each of these approaches, we integrated them into a single methodology that we now outline.
3. Methodology
3.1. Overview
In support of our overall aim to explore approaches to characterizing landscapes through language, we collected landscape descriptions from 10 study sites using three different approaches, each approach resulting in a particular textual data source for further analysis. Thus, interviewing participants in the field resulted in free lists, focused web crawling resulted in a corpus of hiking blogs relating to each study site, and querying georeferenced Flickr photos resulted in lists of image tags for each location. Since we wished to compare descriptions not only with respect to the data source, but also with respect to different landscape types, we selected five landscape types that reflect the diversity of landscapes at the intersection between cultural and natural landscapes in Switzerland: mountain, moor, lake, river, and hill landscapes. These landscape types are informed by the formal Swiss landscape typology (ARE Citation2011b), except for lake landscapes, which are not a recognized landscape category in the formal typology, but which we included based on the importance of water bodies in landscape preference (Pitt Citation1989). For each of the five landscape types, we selected two study sites based on the criteria of accessibility through hiking paths and public transport, and high visitor numbers, for a total of 10 study sites ().
Table 1. Study sites and their landscape types in the Swiss landscape typology.
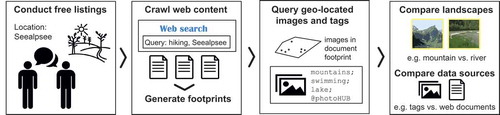
With three approaches to gathering landscape descriptions and 10 study sites, our final collection to analyze and compare consisted of 30 ‘documents’, one for each combination of study site () and data source (free lists, hiking blogs, Flickr tags). We borrow here the term ‘document’, commonly used in the information retrieval community to mean a data object (prototypically unstructured text) that can be processed, indexed, and queried. Each data collection approach is described in more detail in Section 3.2, and an overview is presented in . After collecting all our textual descriptions, we extracted and categorized terms according to which of a set of landscape aspects they best pertained to, described in Section 3.3. We then compared the distribution of these landscape aspects across our three data sources. Finally, we used the landscape aspect categories to filter terms before calculating similarity measures between documents. We calculate the statistical significance of the similarity measure across sets of documents to compare both data sources and landscape types (Section 3.4).
Figure 1. Overview of the methodological sequence applied to extract and compare landscape descriptions.
3.2. Collecting landscape terms
At each study site, we first conducted free-listing tasks with 30 visitors. A detailed description of our free-listing approach can be found elsewhere (Wartmann and Purves, Citationin press). For the sake of understanding, we here include a brief overview of the method. We selected visitors pragmatically, while attempting to achieve a balance across different age groups and gender. At the interview locations, we approached visitors and asked if they were willing to take part in a study. If they agreed, we conducted a free-listing task using the elicitation statement in Swiss German: ‘Was hätts für Sie i dere Landschaft?’, which can literally be translated as ‘What is there for you in this landscape’? Participants were instructed to list whatever came to their mind, and that there were no right or wrong answers. If participants paused during their lists, they were prompted once as to whether they wanted to continue. Participants were also asked a basic set of demographic questions. In total, we thus interviewed 300 participants (155 men, 145 women). Of the participants, 60 were aged 34 and under, 106 were between 35 and 54 years old, while 118 were 55 and older (16 participants did not share their age). The first author of this article, a native speaker of Swiss German, transcribed all answers during the interviews as lists of terms. These free lists formed our first set of documents.
For each study site, we then created a small web-crawled corpus of full text descriptions about landscapes, consisting mainly of hiking blogs. We used the open-source tool BootCaT (Baroni and Bernardini Citation2004) to create these web corpora by using a query consisting of toponyms associated with the study sites and the German terms wandern and wir as seeds. Wandern and wir can be translated as ‘walking/hiking’ and ‘we’, respectively, and were selected to find textual descriptions of first person experiences at these locations (i.e. ‘As we were hiking along the shores of Lake Zurich…’). The BootCaT interface returned around 40 to 70 web pages for each study site, from which we selected the five per site that we judged to be the longest, most landscape-related, first person accounts consisting of full text (as opposed to, for example, only images and their captions). Each web corpus of five texts formed a single ‘document’ about one of the study locations, and thus our second set of documents, hiking blogs, was complete.
In order to create our third set of documents, user-generated content in the form of Flickr tags, a key step was to use a data-driven approach for systematically identifying content associated with the landscape at our study locations (Acheson et al. Citation2017). We chose to use our second set of documents, hiking blogs, as the basis for defining an appropriately-sized region tailored to each study site, which we could then use to query georeferenced Flickr content. Therefore, we first generated a geographical footprint for each study site by using the textual content of each web corpus (or ‘document’ unit) of hiking blogs, then spatially queried Flickr for images within each resulting footprint. An overview of this process is shown in , using the Seealpsee study site as an example. Creating footprints from toponyms contained in documents relating to the study sites enabled us to define the geographic boundaries for querying Flickr content, rather than draw arbitrary boundaries ourselves, or defining a fixed radius around the interview locations that does not take into account the landscape setting at each site.
Figure 2. Processing steps to create footprints from web documents and extract georeferenced images.
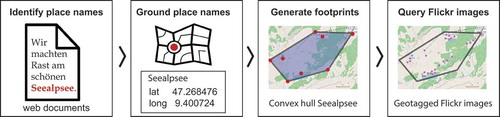
In a first step, we manually identified all toponyms in each of the 50 texts crawled from the web. This was feasible to do by hand and ensured that we had high quality toponym recognition, as poor performance on this step can propagate downstream (Amitay et al. Citation2004, Purves et al. Citation2007). We then aggregated all toponyms for each study site, resulting in a toponym list for each of the 10 study sites. We queried each of these toponyms for geographic coordinates using the location search feature of the openly available GeoAdmin API (http://api3.geo.admin.ch/), which returns results from the SwissNames3D gazetteer, a nationally produced dataset containing a comprehensive listing of place names in Switzerland, alongside their type and coordinates. To obtain a geographically focused footprint for each study site, we iteratively filtered out candidates that were more than two standard deviations away from the centroid of the points obtained for each toponym (Smith and Crane Citation2001), stopping when we reached either a footprint dimension threshold or a maximum iteration threshold, both heuristically set. Finally, we calculated the convex hull of the remaining points, resulting in a final set of 10 convex hulls used as footprints to extract georeferenced images. Using the bounding boxes of these convex hulls, we queried the Flickr API for images from these areas. We removed bulk uploads from these initial results by filtering out pictures with the same tags, thereby reducing the bias created by prolific users, often cited as a problem in user-generated content (Hollenstein and Purves Citation2010). We then further refined the set of pictures by discarding any images outside of our convex hulls. Given the long tail of the tag frequency distribution, with very many idiosyncratic tags only used once, we retained only tags that were mentioned two times or more per study site for our analysis. Thus, our third data source, Flickr tags, consisted of lists of tags and their frequencies, with one such list or ‘document’ per study site.
3.3. Coding scheme
To annotate the terms contained in our corpora, we devised a coding scheme using an iterative process with open coding informed by a literature review and our own data, followed by structured coding (Crang and Cook Citation2007). The goal for our coding scheme was that it should reflect different aspects of landscapes contained in our data, ranging from the physical landscape settings to the meanings our respondents ascribe to these settings. From the myriad of theories and conceptualizations of place, place meaning, and sense of place in the literature (Tuan Citation1977, Low and Altman Citation1992, Feld and Basso Citation1996, Twigger-Ross and Uzzell Citation1996, Jorgensen and Stedman Citation2001, Williams and Vaske Citation2003, Cresswell Citation2006), we selected the concept of place by Agnew (Citation1987), because it includes tangible as well as intangible aspects of people–place relations. The tripartite concept consists of location, locale, and sense of place. The first aspect of location is represented in our data in the form of toponyms. The second aspect is locale, or the setting where social life takes place. We further refined the aspect of locale with categories informed from landscape character assessments (Swanwick et al. Citation2002) and thus defined three subcategories: biophysical landscape elements, cultural landscape elements, and perceptual elements. Biophysical landscape elements contain terms relating to geology, landforms, soil, land cover, flora, fauna, and climate, while cultural landscape elements contain terms referring to land use, settlements, infrastructure, domesticated animals, and anthropogenic objects. Perceptual elements include terms referring to color, touch/feel, sounds, smells, and weather and atmospheric conditions. The third aspect of sense of place is represented in our data by mentions of meanings, feelings, memories, as well as terms relating to a sense of attachment, identity, or history of a place or landscape. We thus use sense of place as an umbrella concept, encompassing other concepts such as place identity and place attachment. Additional aspects derived from open coding were activities participants associated with a landscape, and people in the landscape. Thus, the final coding scheme consisted of seven categories or landscape aspects: toponym, biophysical landscape element, cultural landscape element, perceptual landscape element, sense of place, activity, and people. Based on these seven aspects, the first author applied structured coding to all our data. We then used the coded terms both to compare the data sources in terms of their distribution of aspects, and to select term subsets for cosine similarity comparisons between pairs of documents, described next.
3.4. Comparing landscape descriptions between data sources
To quantitatively compare landscape descriptions with respect to the three different data sources and five landscape types, we used cosine similarity to compare documents represented as term vectors (Manning and Schütze Citation1999). To calculate a cosine similarity between two documents, each document is represented as a vector of N terms, where N is the number of terms appearing in the corpus and each term is weighted by its frequency of occurrence in the respective document. In our study, a free list document consisted of all the terms listed by 30 visitors at a study site, a hiking blog document consisted of the full text from five web-crawled landscape descriptions relating to a site, and a Flickr tag document consisted of all the tags from images georeferenced at a study site, after the various filtering methods described previously. In a preprocessing step, all documents were cleaned of stop words, and free list entries and hiking blogs were split into their component words. For comparing particular subsets of landscape aspects, we retained only terms that had been coded as pertaining to the specified landscape aspects. The result of this process was a set of 30 term vectors, one per document, forming the basic units for all cosine similarity calculations.
All cosine similarity calculations were performed using the scikit-learn python library (Pedregosa et al. Citation2011). For one set of cosine similarity calculations, where a subset of terms pertaining to particular landscape aspects was used in the term vectors, we assessed the statistical significance of comparisons of groups of cosine similarity values using two-sided Mann-Whitney-U tests at significance level α = 0.05.
To illustrate this process, we take as an example the cosine similarities calculated with only biophysical terms, and how we compared data sources based on these cosine similarity values. First, we create a term vector for each document, where each vector has the same length M, where M is the number of words in the entire corpus that were annotated as biophysical landscape aspects. Each entry in the vector for a document represents the frequency of this word in the given document. Next we calculate cosine similarity values between all possible pairs of term vectors, resulting in a 30 × 30 matrix of values (including comparisons where a document’s term vector is compared to itself, resulting in a cosine similarity of 1.0). We then assess whether cosine similarity values were statistically more similar to each other when the pair of documents being compared was from the same data source (e.g. Flickr tags for Oeschinensee vs. Flickr tags for Seealpsee) as opposed to from different data sources (e.g. Flickr tags for Oeschinensee vs. hiking blogs for Seealpsee).
4. Results and interpretation
We first present our findings on the distribution of landscape aspects in different data sources, then our results comparing landscape descriptions across study sites and data sources.
4.1. Aspects of landscape in different data sources
After having gathered our three types of landscape descriptions and annotated each term according to the landscape aspect it best represents, we could compare data sources according to their respective content of each landscape aspect. The three data sources differed slightly in the amount of terms they contained. The free lists conducted with 300 visitors contained a mean number of 303 terms per study site (Mdn = 307, SD = 43.8). In absolute numbers, the 10 web corpora of hiking blogs contained the most terms with a mean of 427 per study site (Mdn = 307, SD = 97.3). For Flickr image tags, we collected a mean of 332 terms (Mdn = 340, SD = 156.4). In order to highlight which aspects were more abundant in which data source, we normalized these term counts by the total number of terms contained in each data source.
The distribution of aspects in each data source is presented in . Free lists contained the smallest proportion of toponyms of all three data sources, but were a rich source of biophysical properties of landscapes, while also containing high proportions of cultural landscape elements and to some extent, sense of place. The hiking blogs were the richest source of terms relating to sense of place, and contained similar amounts of toponyms, biophysical elements, cultural elements, and perceptual aspects. Flickr tags proved to be a good source of toponyms, accounting for almost half of the annotated content. Flickr tags also contained many terms relating to biophysical and cultural landscape elements, as well as perceptual aspects, but yielded little information on sense of place.
Figure 3. Relative prominence of different landscape aspects depending on the data source.
4.2. Comparing landscape descriptions between data sources
We found that filtering out toponyms and aspects not related to landscape from all data sources often considerably increased the cosine similarity values between documents from two different data sources. Intuitively, this is consistent with our results from the landscape aspect comparison which show that our three data sources contain very different proportions of toponyms. Thus, removing toponyms and non-landscape aspects is likely to make different data sources more similar, within a study site. For instance, comparing hiking blogs and free lists, before and after removing such aspects, cosine similarity increases for all study sites except River Thur, where it minimally decreases ().
Table 2. Cosine similarity values for the comparison between hiking blogs and free lists.
To statistically assess the influence of the data source on cosine similarity values, we grouped the cosine values of comparisons within the same data source and compared these to cosine values of comparisons between different data sources, repeating this for all our term subsets (e.g. without toponyms, only biophysical landscape aspects, etc.). For example, we compared whether free lists were more similar to other free lists than to image tags, irrespective of the location or landscape type. Our results show that documents of the same data source are significantly more similar than documents from different data sources. Thus, landscape descriptions were more similar within the same data source, irrespective of the study site or landscape type they were located in. For all term subsets, we obtained statistically significant differences (two-sided Mann-Whitney-U), except for the biophysical landscape terms for the hiking blog comparison ().
Table 3. Mann-Whitney-U values for within-document-type vs. across-document-type cosine similarity comparisons (statistically significant results in bold).
4.3. Comparisons between landscape types
Our second comparison was between landscape types, that is, comparing documents from one landscape type (in different data sources) against documents from all other landscape types. For example, we tested whether mountain landscapes in Flickr tags, hiking blogs, and free lists were more similar to each other than they were to all descriptions of other landscape types. Here, we found that most comparisons were not significant (). Given the results from the previous section, this result was highly probable, since documents of a particular data source were more similar to documents of the same data source than to documents from a different data source, irrespective of the landscape type. However, there were a few significant comparisons, notably for river landscapes, specifically for all terms coded as landscape aspects (both with and without toponyms) and only terms coded as biophysical aspects (). The high cosine similarity values between river landscapes seems to be driven by the similarity of terms used for biophysical properties (e.g. water, trees, river), leading us to believe that the limited vista space for river landscapes limits the inclusion of terms from other semantic fields, which could have been a potential driver for this similarity.
Table 4. Mann-Whitney-U values for within-landscape-type vs. across-landscape-type cosine similarity comparisons (statistically significant results in bold).
4.4. Comparisons between landscape types within a data source
As a final step, to control for the influence of the data source, we compared landscape types within a data source. For example, we took cosine values of comparisons between pairs of documents of Flickr tags from the same landscape type (e.g. hill landscape vs. hill landscape) and compared them to pairs of documents of Flickr tags from different landscapes types (e.g. mountain vs. river, hill vs. moor, lake vs. moor, and so on). We found that, within our three data sources, documents from the same landscape type were significantly more similar than documents from different landscape types for two-term subsets: landscape aspects excluding toponyms, and only biophysical aspects (). However, with the sense of place term subset, there were no significant differences between descriptions within and between landscape types.
Table 5. Mann-Whitney-U values for within-landscape-type vs. across-landscape-type cosine similarity comparisons, within a data source (statistically significant results in bold).
5. Discussion
In this study, we devised and applied a methodology that is based on the combination of both empirical elicitation of information about landscapes with participants in a landscape setting and more data-driven extraction approaches informed from text retrieval. The discussion is structured around the three main contributions of this article: our integrated methodology for gathering landscape descriptions, our finding that we can distinguish between formally recognized landscape types based on landscape descriptions, and our application of GIScience methods to the domain of landscape characterization.
5.1. An integrated methodology for gathering landscape descriptions from the public
Conducting free listing in outdoor settings, we elicited landscape categories and other associations with landscape from the public, including notions of scenicness, relaxation, and identity. This method from cognitive psychology has proven to be transferable to the domain of landscape and was empirically tested (Williams et al. Citation2012, Wartmann Citation2015). Our study confirms the usefulness of free listing with participants for eliciting landscape categories and associated terms, including information pertaining to sense of place. We then crawled the web for landscape descriptions, based on seeds that included the place name of the study site, to create a small corpus of full text descriptions. Though different seeds may be tested in further research, our choice of seeds provided sufficient content for each study site, enabling us to make a selection based on the suitability of the text for our use case. We purposefully focused on accounts of people having visited the landscape and writing about their first-hand experience, excluding texts such as descriptions on tourism websites. As we used these full text descriptions to create geographically focused footprints to query Flickr photos, we restricted ourselves to a small number of texts so that we could manually annotate all toponyms, thus achieving a gold standard in toponym recognition. This time-consuming task could be avoided in the future by implementing automated toponym recognition and resolution (Amitay et al. Citation2004). However, these are challenging tasks made harder still with semi-formal texts in German like our hiking blogs, and authors who liberally use vernacular and idiosyncratic spellings of place names (Augenstein et al. Citation2017), common in Switzerland with its multitude of oral German dialects. By basing our queries on site-specific footprints, we gathered images taken in focused geographical areas, rooted in the way a landscape was described in text, thus going further than methods such as queries based on a simple distance criterion.
We thus created three data sources (free lists, hiking blogs, and Flickr tags) as the basis for further comparisons. Overall, our approach proved well suited to study highly frequented landscapes. However, it would be more challenging to apply to landscapes with fewer visitors, where the time and costs to conduct interviews and free listings increase, and the availability of web content (blogs, social media) decreases, given the highly unequal distribution of user-generated content across space (Antoniou et al. Citation2010). If our intention is to eventually create data layers containing descriptions with full spatial coverage, this is a severe limitation of passively crowdsourced information. Thus, alternative approaches are to include actively crowdsourced information through citizen science initiatives (Connors et al. Citation2012, Haklay Citation2013). For instance, platforms where users upload full-text landscape descriptions for public use, such as in the Geograph Britain and Ireland project (http://www.geograph.org.uk/), can provide semantically rich crowdsourced information focused on landscape.
5.2. Comparing landscape descriptions between settings and data sources
Our results show that landscape descriptions from the same data source were more similar than between data sources, also for different landscape types. This indicates that there are considerable differences in the data we capture through these approaches in terms of the lexical aspects, resulting in low cosine similarities for comparisons between data sources (e.g. Flickr tags with hiking blogs). However, the results from coding aspects of landscape confirm that these differences are not merely lexical, but also semantic. For instance, while Flickr tags contained high percentages of toponyms but less content on sense of place, hiking blogs contained more sense of place content. The relatively high proportion of content in hiking blogs related to sense of place compared with Flickr tags and free lists could be expected, because narratives used for hiking blogs may lend themselves better to expressing sense of place than single words used as tags or in free lists. However, free-listing experiments also result in some content relating to sense of place, despite the elicitation question not aimed at documenting such content (Wartmann and Purves, Citationin press). The fact that people list terms related to sense of place in free-listing tasks at all may be linked to memory retrieval processes, where people first list landscape features, and then also list feelings and meanings associated with the landscape (Wartmann Citation2015). Thus, we argue that rather than being interchangeable, these data sources are complementary, each highlighting different aspects of landscape. Indeed, this combination of approaches is particularly promising for applications that aim to include multiple perspectives on landscapes, including expert and nonexpert opinions on landscape characterization (Dalglish and Leslie Citation2016). The limitations of our approaches are that each of them reaches a particular subset of the population (e.g. people visiting a place on a sunny summer day and being interviewed, others visiting the same place at a different time and writing about it on the web or uploading pictures), and that the content we documented is perhaps reflective of that part of the population, but not of others. For comparing descriptions between landscape types, we found that zooming into a single data source (e.g. hiking blogs), two sites in the same landscape type were lexically more similar if we excluded toponyms from our data. By narrowing the term subset further down to biophysical aspects of landscape only, we observed this effect strongly across all data sources. This finding supports our hypothesis that people, at least within a cultural-linguistic group, describe landscapes differently in terms of their biophysical properties, such as whether one is a mountain landscape characterized by rocks, cliffs, and crevasses, or a river landscape with a river flowing through woods and farmlands. Interestingly, we found no differences between landscape types in the terms relating to sense of place. This finding suggests people’s description of their experience varies to a lesser extent between different landscape types. Landscapes that are generally perceived as natural and are visited for recreational purposes may thus evoke similar feelings of identity, relaxation, and a connection to nature (in other words cultural ES), irrespective of the biophysical composition of the landscape. This is in accordance with research in environmental psychology finding pronounced differences between recreation provided by urban and natural landscapes (Velarde et al. Citation2007), but fewer differences in recreational effects between different natural landscapes such as forests, hills, and moors, with the exception of coastal landscapes that provided more restoration (White et al. Citation2013). The methodology we describe in this article thus has a range of potential applications, which we outline next.
5.3. Relevance and potential applications
This study highlights the potential of adapting methods from GIScience and geographic information retrieval (GIR) to the domain of landscape characterization, with possible applications of refining landscape character assessments and landscape typologies using data gathered from the public. Indeed, by combining data-driven approaches from GIR with in situ elicitation of landscape character, we are contributing toward enriching representations of geographic information. Our methods centered around collecting and comparing text data that contained terms for landscape features and semantically related content. We argue that integrating such information grounded in individual perceptions and language with spatial data potentially allows us to include more situated knowledge and subjective perceptions into existing, typically expert-driven, data. Our work is in line with previous efforts for bringing to the fore meanings of geographic information that are relevant to many applications of GIS (Gahegan and Pike Citation2006). Furthermore, we showed how different data sources (free lists, hiking blogs, and Flickr tags) differ in their landscape-related content. Combining these different sources thus provides a more holistic data basis (e.g. for landscape character assessments) than any of these data sources on its own.
With the arrival of new forms of crowdsourced data in ever increasing volumes, this article focused on the question of how we can ‘dig into this data avalanche’ (Miller Citation2010) to answer questions relevant to landscape research. So far, most of the research on novel data about places and landscapes has focused on the enumeration of the quantity of user-generated content relating to certain areas (Nahuelhual et al. Citation2013, Tenerelli et al. Citation2016). If semantics were taken into account at all, the focus was on retrieving content that related to a fixed set of predefined keywords (van Zanten et al. Citation2016), or in some cases, applying automated methods to define topics emerging from large volumes of data (Jenkins et al. Citation2016). In this study, we focused on the content, using the link between text and geographical space to access and harness different data sources. Our work builds on previous research revolving around the extraction of place semantics in user-generated content (Rattenbury and Naaman Citation2009, Hollenstein and Purves Citation2010, Capineri Citation2016). Instead of characterizing a single place through different data sources (Capineri Citation2016), we took a comparative approach, working out the similarities and differences in descriptions between different landscapes in different data sources. We did this both in a qualitative way by looking more closely at the semantics, as well as lexically through quantitative text comparisons. We showed that, by carefully sifting the ‘avalanche’ and creating focused corpora, we can apply semi-automated methods for processing this information that lead to more than just a shallow reading, yet which are scalable and yield sufficient landscape-related content to be interesting for practical applications. Such practical applications include, for example, the assessment of indicators for cultural landscape values (Bieling et al. Citation2014).
Our work in this field is novel in that it links the empirical method of free listing with digital traces in the form of web-crawled documents and georeferenced images. While methodological challenges remain in adapting methods to larger scales (and potentially larger volumes of data), we demonstrate the potential of combining methodologies to overcome disciplinary boundaries and provide multiple perspectives on the complex phenomenon of the relation between people and landscapes.
6. Conclusions
By using both traditional empirical methods as well as emerging crowdsourced data, our approach puts people and their perception, experience, and appreciation of landscapes at the center. Using three different data sources, we highlight the potential of gathering landscape descriptions from the bottom-up, and show how these sources allow us to distinguish landscape types based on the description of the biophysical landscape features. Such an approach constitutes a step toward including the views of a wider public, integrating multiple perspectives, and adding semantics to the typically expert-based spatial data collected for landscape assessments.
Disclosure statement
No potential conflict of interest was reported by the authors.
Additional information
Funding
References
- Acheson, E., Wartmann, F.M., and Purves, R.S., 2017. Generating spatial footprints from hiking blogs. In: P. Fogliaroni, A. Ballatore, and E. Clementini, eds. Proceedings of workshops and posters at the 13th International Conference on Spatial Information Theory (COSIT 2017). Lecture Notes in Geoinformation and Cartography. Cham: Springer, 5–7.
- Agnew, J.A., 1987. Place and politics. The geographical mediation of state and society. Boston: Allen & Unwin.
- Amitay, E., et al., 2004. Web-a-where: geotagging web content. In: Proceedings of the 27th annual international ACM SIGIR conference on Research and development in information retrieval ACM, 273–280.
- Antoniou, V., Morley, J., and Haklay, M., 2010. Web 2.0 geotagged photos: assessing the spatial dimension of the phenomenon. Geomatica, 64(1), 99–110.
- ARE, 2011a. Die Landschaften der Schweiz. Landschaftstypologie Schweiz. Technical report, ARE, Berne, Switzerland.
- ARE, 2011b. Landschaftstypologie Schweiz Teil 1, Ziele, Methode und Anwendung. Technical report, ARE, Berne, Switzerland.
- Augenstein, I., Derczynski, L., and Bontcheva, K., 2017. Generalisation in named entity recognition: a quantitative analysis. Computer Speech & Language, 44, 61–83. doi:10.1016/j.csl.2017.01.012
- Baroni, M. and Bernardini, S., 2004. BootCaT: bootstrapping corpora and terms from the web. In: LREC - International Conference on Language Resources and Evaluation ELRA.
- Bieling, C., et al., 2014. Linkages between landscapes and human well-being: an empirical exploration with short interviews. Ecological Economics, 105, 19–30. doi:10.1016/j.ecolecon.2014.05.013
- Brabyn, L., 1996. Landscape classification using GIS and national digital databases. Landscape Research, 21(3), 277–300. doi:10.1080/01426399608706493
- Bunce, R., et al. 1996. Land classification for strategic ecological survey. Journal of Environmental Management, 47(1), 37–60. doi:10.1006/jema.1996.0034
- Butler, A., 2016. Dynamics of integrating landscape values in landscape character assessment: the hidden dominance of the objective outsider. Landscape Research, 41(2), 239–252. doi:10.1080/01426397.2015.1135315
- Capineri, C., 2016. Kilburn high road revisited. Urban Planning, 1(2), 128. doi:10.17645/up.v1i2.614
- Caspersen, O.H., 2009. Public participation in strengthening cultural heritage: the role of landscape character assessment in Denmark. Geografisk Tidsskrift-Danish Journal of Geography, 109(1), 33–45. doi:10.1080/00167223.2009.10649594
- Comber, A., 2013. Comparing expert and non-expert conceptualisations of the land: an analysis of crowdsourced land cover data. In: T. Tenbrink, et al., eds. International Conference on Spatial Information Theory. COSIT 2013: Spatial Information Theory. Lecture Notes in Computer Science. Vol. 8116. Cham: Springer, 243–260.
- Connors, J.P., Lei, S., and Kelly, M., 2012. Citizen science in the age of neogeography: utilizing volunteered geographic information for environmental monitoring. Annals of the Association of American Geographers, 102(6), 1267–1289. doi:10.1080/00045608.2011.627058
- Costanza, R., et al. 1997. The value of the world’s ecosystem services and natural capital. Nature, 387(6630), 253–260. doi:10.1038/387253a0
- Council of Europe, 2000. European Landscape Convention. Technical report, Florence.
- Crang, M. and Cook, I., 2007. Doing ethnographies. London: Sage.
- Cresswell, T., 2006. Place. Malden, MA: Blackwell Pub.
- Dalglish, C. and Leslie, A., 2016. A question of what matters: landscape characterisation as a process of situated, problem-orientated public discourse. Landscape Research, 41(2), 212–226. doi:10.1080/01426397.2015.1135319
- Daniel, T.C. and Vining, J. 1983. Methodological issues in the assessment of landscape quality. In: I. Altman and J. Wohlwill, eds. Behavior and the natural environment. Human behavior and environment (Advances in theory and research). Boston, MA: Springer, Vol. 6, 39–84.
- de Groot, R., et al. 2010. Challenges in integrating the concept of ecosystem services and values in landscape planning, management and decision making. Ecological Complexity, 7(3), 260–272. doi:10.1016/j.ecocom.2009.10.006
- Derungs, C. and Purves, R.S., 2013. From text to landscape: locating, identifying and mapping the use of landscape features in a Swiss Alpine corpus. International Journal of Geographical Information Science, 28(6), 1272–1293. doi:10.1080/13658816.2013.772184
- Derungs, C. and Purves, R.S., 2016. Characterising landscape variation through spatial folksonomies. Applied Geography, 75, 60–70. doi:10.1016/j.apgeog.2016.08.005
- Dong, J., et al. 2003. Remote sensing estimates of boreal and temperate forest woody biomass: carbon pools, sources, and sinks. Remote Sensing of Environment, 84(3), 393–410. doi:10.1016/S0034-4257(02)00130-X
- Dunkel, A., 2015. Visualizing the perceived environment using crowdsourced photo geodata. Landscape and Urban Planning, 142, 173–186. doi:10.1016/j.landurbplan.2015.02.022
- Edwardes, A. and Purves, R., 2007. A theoretical grounding for semantic descriptions of place. In: J.M. Ware and G.E. Taylor, eds. Web and Wireless Geographical Information Systems. 7th International Symposium, W2GIS 2007, Cardiff, UK, November 28-29, 2007. Proceedings. Berlin Heidelberg: Springer, 106–120.
- Feld, S. and Basso, K., eds., 1996. Senses of place. Santa Fe, New Mexico: School of American Research Press.
- Figueroa-Alfaro, R.W. and Tang, Z., 2017. Evaluating the aesthetic value of cultural ecosystem services by mapping geo-tagged photographs from social media data on Panoramio and Flickr. Journal of Environmental Planning and Management, 60(2), 266–281. doi:10.1080/09640568.2016.1151772
- Gahegan, M. and Pike, W., 2006. A situated knowledge representation of geographical information. Transactions in GIS, 10(5), 727–749. doi:10.1111/tgis.2006.10.issue-5
- Gerçek, D., Toprak, V., and Strobl, J., 2011. Object-based classification of landforms based on their local geometry and geomorphometric context. International Journal of Geographical Information Science, 25(6), 1011–1023. doi:10.1080/13658816.2011.558845
- Giannakopoulou, L., et al. 2013. From compasses and maps to mountains and territories: experimental results on geographic cognitive categorization. In: M.M. Raubal, D.M. Mark, and A.U. Frank, eds. Cognitive and Linguistic Aspects of Geographic Space. Lecture Notes in Geoinformation and Cartography. Berlin: Springer, 63–81.
- Gregory, I.N. and Hardie, A., 2011. Visual GISting: bringing together corpus linguistics and geographical information systems. Literary and Linguistic Computing, 26(3), 297–314. doi:10.1093/llc/fqr022
- Grothe, C. and Schaab, J., 2009. Automated footprint generation from geotags with Kernel density estimation and support vector machines. Spatial Cognition & Computation, 9(3), 195–211. doi:10.1080/13875860903118307
- Gschwend, C. and Purves, R.S., 2012. Exploring geomorphometry through user generated content: comparing an unsupervised geomorphometric classification with terms attached to georeferenced images in Great Britain. Transactions in GIS, 16(4), 499–522. doi:10.1111/j.1467-9671.2012.01307.x
- Guerrero, P., et al. 2016. Revealing cultural ecosystem services through Instagram images: the potential of social media volunteered geographic information for urban green infrastructure planning and governance. Urban Planning, 1(2), 1. doi:10.17645/up.v1i2.609
- Haklay, M., 2013. Citizen science and volunteered geographic information: overview and typology of participation. In: M.H. Palmer and S. Kraushaar, eds. Crowdsourcing Geographic Knowledge: Volunteered Geographic Information (VGI) in Theory and Practice. Dordrecht: Springer Netherlands, 105–122.
- Hollenstein, L. and Purves, R., 2010. Exploring place through user-generated content: using Flickr to describe city cores. Journal of Spatial Information Science, 1, 21–48. doi:10.5311/JOSIS.2010.1.3
- Iwahashi, J. and Pike, R.J., 2007. Automated classifications of topography from DEMs by an unsupervised nested-means algorithm and a three-part geometric signature. Geomorphology, 86(3–4), 409–440. doi:10.1016/j.geomorph.2006.09.012
- Jenkins, A., et al. 2016. Crowdsourcing a collective sense of place. Plos One, 11(4), e0152932. doi:10.1371/journal.pone.0152932
- Jessel, B., 2006. Elements, characteristics and character – information functions of landscapes in terms of indicators. Ecological Indicators, 6(1), 153–167. doi:10.1016/j.ecolind.2005.08.009
- Johnson, L. and Hunn, E., 2010. Landscape ethnoecology. New York: Berghahn Books.
- Jorgensen, B.S. and Stedman, R.C., 2001. Sense of place as an attitude: lakeshore owners attitudes toward their properties. Journal of Environmental Psychology, 21(3), 233–248. doi:10.1006/jevp.2001.0226
- Kienast, F., et al., 2015. The Swiss landscape monitoring program – A comprehensive indicator set to measure landscape change. Ecological Modelling, 295, 136–150. doi:10.1016/j.ecolmodel.2014.08.008
- Kirchhoff, T., 2012. Pivotal cultural values of nature cannot be integrated into the ecosystem services framework. Proceedings of the National Academy of Sciences, 109(46), E3146–E3146. doi:10.1073/pnas.1212409109
- Low, S.M. and Altman, I., eds., 1992. Place attachment. New York, N.Y: Plenum Press.
- MA, 2005. Millennium ecosystem assessment. Washington D.C: World Resources Institute.
- Manning, C.D. and Schütze, H., 1999. Foundations of statistical natural language processing. Vol. 999, Cambridge: MIT Press.
- Mark, D.M., et al. 2011. Landscape in language. Amsterdam/Philadelphia: John Benjamins Publishing.
- Mark, D.M., Smith, B., and Tversky, B. 1999. Ontology and geographic objects: an empirical study of cognitive categorization. In: C. Freksa, ed. International Conference on Spatial Information Theory. COSIT 1999: Spatial Information Theory. Cognitive and Computational Foundations of Geographic Information Science. Lecture Notes in Computer Science. Berlin: Springer, Vol. 1661, 283–298.
- Mark, D.M. and Turk, A.G. 2003. Landscape categories in Yindjibarndi: ontology, environment and language. In: W. Kuhn, M. Worboys, and S. Timpf, eds. Spatial Information Theory. Foundations of Geographic Information Science. COSIT 2003. Lecture Notes in Computer Science. Berlin, Heidelberg: Springer, Vol. 2825, 28–45.
- Miller, H.J., 2010. The data avalanche is here. Shouldn’t we be digging? Journal of Regional Science, 50(1), 181–201. doi:10.1111/jors.2010.50.issue-1
- Mücher, C.A., et al. 2010. A new European Landscape Classification (LANMAP): a transparent, flexible and user-oriented methodology to distinguish landscapes. Ecological Indicators, 10(1), 87–103. doi:10.1016/j.ecolind.2009.03.018
- Nahuelhual, L., et al., 2013. Mapping recreation and ecotourism as a cultural ecosystem service: an application at the local level in Southern Chile. Applied Geography, 40, 71–82. doi:10.1016/j.apgeog.2012.12.004
- Natural England, 2014. Landscape and seascape character assessments. Technical report.
- Niesterowicz, J., Stepinski, T., and Jasiewicz, J., 2016. Unsupervised regionalization of the United States into landscape pattern types. International Journal of Geographical Information Science, 30(7), 1450–1468. doi:10.1080/13658816.2015.1134796
- Oteros-Rozas, E., et al., 2017. Using social media photos to explore the relation between cultural ecosystem services and landscape features across five European sites. Ecological Indicators. doi:10.1016/j.ecolind.2017.02.009
- Pedregosa, F., et al. 2011. Scikit-learn: {Machine} {Learning} in {Python}. Journal of Machine Learning Research, 12, 2825–2830.
- Pickles, J., 1995. Ground truth. New York: Guilford Press.
- Pitt, D., 1989. The attractiveness and use of aquatic environments as outdoor recreation places. In: I. Altman and E.H. Zube, eds. Public Spaces and Places. New York, NY: Plenum Press, 217–254.
- Purves, R.S., et al. 2007. The design and implementation of SPIRIT: a spatially aware search engine for information retrieval on the Internet. International Journal of Geographical Information Science, 21(7), 717–745. doi:10.1080/13658810601169840
- Rattenbury, T. and Naaman, M., 2009. Methods for extracting place semantics from Flickr tags. ACM Transactions on the Web, 3(1), 1–30. doi:10.1145/1462148
- Richards, D.R. and Friess, D.A., 2015. A rapid indicator of cultural ecosystem service usage at a fine spatial scale: content analysis of social media photographs. Ecological Indicators, 53, 187–195. doi:10.1016/j.ecolind.2015.01.034
- Rorissa, A., 2008. User-generated descriptions of individual images versus labels of groups of images: A comparison using basic level theory. Information Processing & Management, 44(5), 1741–1753. doi:10.1016/j.ipm.2008.03.004
- Sarlöv Herlin, I., 2016. Exploring the national contexts and cultural ideas that preceded the landscape character assessment method in England. Landscape Research, 41(2), 175–185. doi:10.1080/01426397.2015.1135317
- Scott, A., 2002. Assessing public perception of landscape: the LANDMAP experience. Landscape Research, 27(3), 271–295. doi:10.1080/01426390220149520
- Scott, A., 2003. Assessing public perception of landscape: from practice to policy. Journal of Environmental Policy & Planning, 5(2), 123–144. doi:10.1080/1523908032000121193
- Smith, B. and Mark, D.M., 2003. Do mountains exist? Towards an ontology of landforms. Environment and Planning B: Planning and Design, 30, 411–427. doi:10.1068/b12821
- Smith, D.A. and Crane, G., 2001. Disambiguating geographic names in a historical digital library. In: P. Constantopoulos and I.T. Sølvberg, eds. International Conference on Theory and Practice of Digital Libraries. Lecture Notes in Computer Science 2163. Heidelberg: Springer, 127–136.
- Swanwick, C., 2002. Landscape Character Assessment Guidance for England and Scotland. Technical report, countryside agency and Scottish natural heritage.
- Swanwick, C., 2004. The assessment of countryside and landscape character in England: an overview. In: K. Bishop and A. Phillips, eds. Countryside planning: new approaches to management and conservation. Camden, London: Earthscan, 109–124.
- Swanwick, C., Bingham, L., and Parfitt, A., 2002. Topic paper 3: landscape character assessment. How stakeholders can help. Landscape Character Assessment Guidance for England and Scotland. The Countryside Agency and Scottish Natural Heritage. Available from: http://publications.naturalengland.org.uk/publication/4902400292814848.
- Tenerelli, P., Demšar, U., and Luque, S., 2016. Crowdsourcing indicators for cultural ecosystem services: A geographically weighted approach for mountain landscapes. Ecological Indicators, 64, 237–248. doi:10.1016/j.ecolind.2015.12.042
- Tuan, Y.F., 1977. Space and place. Minneapolis: University of Minnesota press.
- Tversky, B. and Hemenway, K., 1983. Categories of environmental scenes. Cognitive Psychology, 15(1), 121–149. doi:10.1016/0010-0285(83)90006-3
- Twigger-Ross, C.L. and Uzzell, D.L., 1996. Place and identity processes. Journal of Environmental Psychology, 16(3), 205–220. doi:10.1006/jevp.1996.0017
- Van Eetvelde, V. and Antrop, M., 2009a. A stepwise multi-scaled landscape typology and characterisation for trans-regional integration, applied on the federal state of Belgium. Landscape and Urban Planning, 91(3), 160–170. doi:10.1016/j.landurbplan.2008.12.008
- Van Eetvelde, V. and Antrop, M., 2009b. Indicators for assessing changing landscape character of cultural landscapes in Flanders (Belgium). Land Use Policy, 26(4), 901–910. doi:10.1016/j.landusepol.2008.11.001
- van Zanten, B.T., et al. 2016. Continental-scale quantification of landscape values using social media data. Proceedings of the National Academy of Sciences, 113(46), 12974–12979. doi:10.1073/pnas.1614158113
- Velarde, M., Fry, G., and Tveit, M., 2007. Health effects of viewing landscapes – landscape types in environmental psychology. Urban Forestry & Urban Greening, 6(4), 199–212. doi:10.1016/j.ufug.2007.07.001
- Wang, W. and Stewart, K., 2015. Spatiotemporal and semantic information extraction from web news reports about natural hazards. Computers, Environment and Urban Systems, 50, 30–40. doi:10.1016/j.compenvurbsys.2014.11.001
- Warnock, S. and Griffiths, G., 2015. Landscape characterisation: the living landscapes approach in the UK. Landscape Research, 40(3), 261–278. doi:10.1080/01426397.2013.870541
- Wartmann, F. and Purves, R., 2017. What’s (not) on the map: landscape features from participatory sketch mapping differ from local categories used in Language. Land, 6(4), 79. doi:10.3390/land6040079
- Wartmann, F.M., 2015. More than a list: what outdoor free listings of landscape categories reveal about commonsense Geographic concepts and memory search strategies. In: S.I. Fabrikant, et al., eds. Spatial Information Theory. Lecture Notes in Computer Science. Vol. 9368. Heidelberg: Springer, 224–243.
- Wartmann, F. M., & Purves, R. S. (in press). Investigating sense of place as a cultural ecosystem service in different landscapes through the lens of language. Landscape and Urban Planning.
- White, M.P., et al., 2013. Feelings of restoration from recent nature visits. Journal of Environmental Psychology, 35, 40–51. doi:10.1016/j.jenvp.2013.04.002
- Williams, D.R. and Vaske, J.J., 2003. The measurement of place attachment: validity and generalizability of a psychometric approach. Forest Science, 49(6), 830–840.
- Williams, M., Kuhn, W., and Painho, M., 2012. The influence of landscape variation on landform categorization. Journal of Spatial Information Science. doi:10.5311/JOSIS.2012.5.107
- Yoshimura, N. and Hiura, T., 2017. Demand and supply of cultural ecosystem services: use of geotagged photos to map the aesthetic value of landscapes in Hokkaido. Ecosystem Services, 24, 68–78. doi:10.1016/j.ecoser.2017.02.009
- Zube, E.H., 1984. Themes in Landscape Assessment Theory. Landscape Journal, 3(2), 104–110. doi:10.3368/lj.3.2.104